


JuStRank: Benchmarking LLM Judges for System Ranking | Summary
12 Dec 2024 | Paper Review LLM-as-a-Judge LLM Evaluation BenchmarkContents
This article explains the key points of JuStRank: Benchmarking LLM Judges for System Ranking.
- 2024-12-12 (arXiv)
- Gera, Ariel, Boni, Odellia, Perlitz, Yotam, Bar-Haim, Roy, Eden, Lilach, Yehudai, Asaf.
- IBM Research
- Paper
- Reviewed source: arXiv:2412.09569v2, 2025-06-10.
Summary
- JuStRank examines whether large language model (LLM) judges, models used to evaluate generated responses, can reliably rank the systems producing those responses. Against a human-derived Chatbot Arena ranking, Qwen2.5-72B-Instruct using Likert scoring, a five-label quality scale, and Win-Rate aggregation, averaging response-score wins against other systems, achieves Kendall’s Tau, a measure of ranking agreement, of 0.827, compared with 0.823 for URM-LLaMa-3.1-8B, an 8B-parameter reward model that assigns response-quality scores, using Mean aggregation, the average score per system.
- The benchmark evaluates 48 judge realizations, specific implementations of response scoring, using 500 Arena Hard v0.1 instructions and responses from 63 systems, producing approximately 1.5M scores. Numeric scoring, a 0–100 rating, and Likert scoring outperform Anchor, comparison against a fixed reference response, and TokenProbs, scoring from yes/no token probabilities, on average. Performance on RewardBench, a benchmark of individual-response comparisons, does not consistently predict system-ranking performance.
- The analysis distinguishes decisiveness, the tendency to amplify differences between stronger and weaker systems, from system-specific bias, persistent overvaluation or undervaluation of particular systems. Ranking quality correlates positively with decisiveness and negatively with bias, but interpretation depends on the assumed similarity between the separate automated-evaluation and human-reference datasets.
1 Introduction
LLM judges increasingly inform model selection and assessments of training or inference methods, yet their validation usually measures decisions about individual responses. JuStRank evaluates whether aggregating those judgments reproduces a human-based system ranking.
- The study releases approximately 1.5M judgment scores at https://huggingface.co/datasets/ibm-research/justrank_judge_scores.
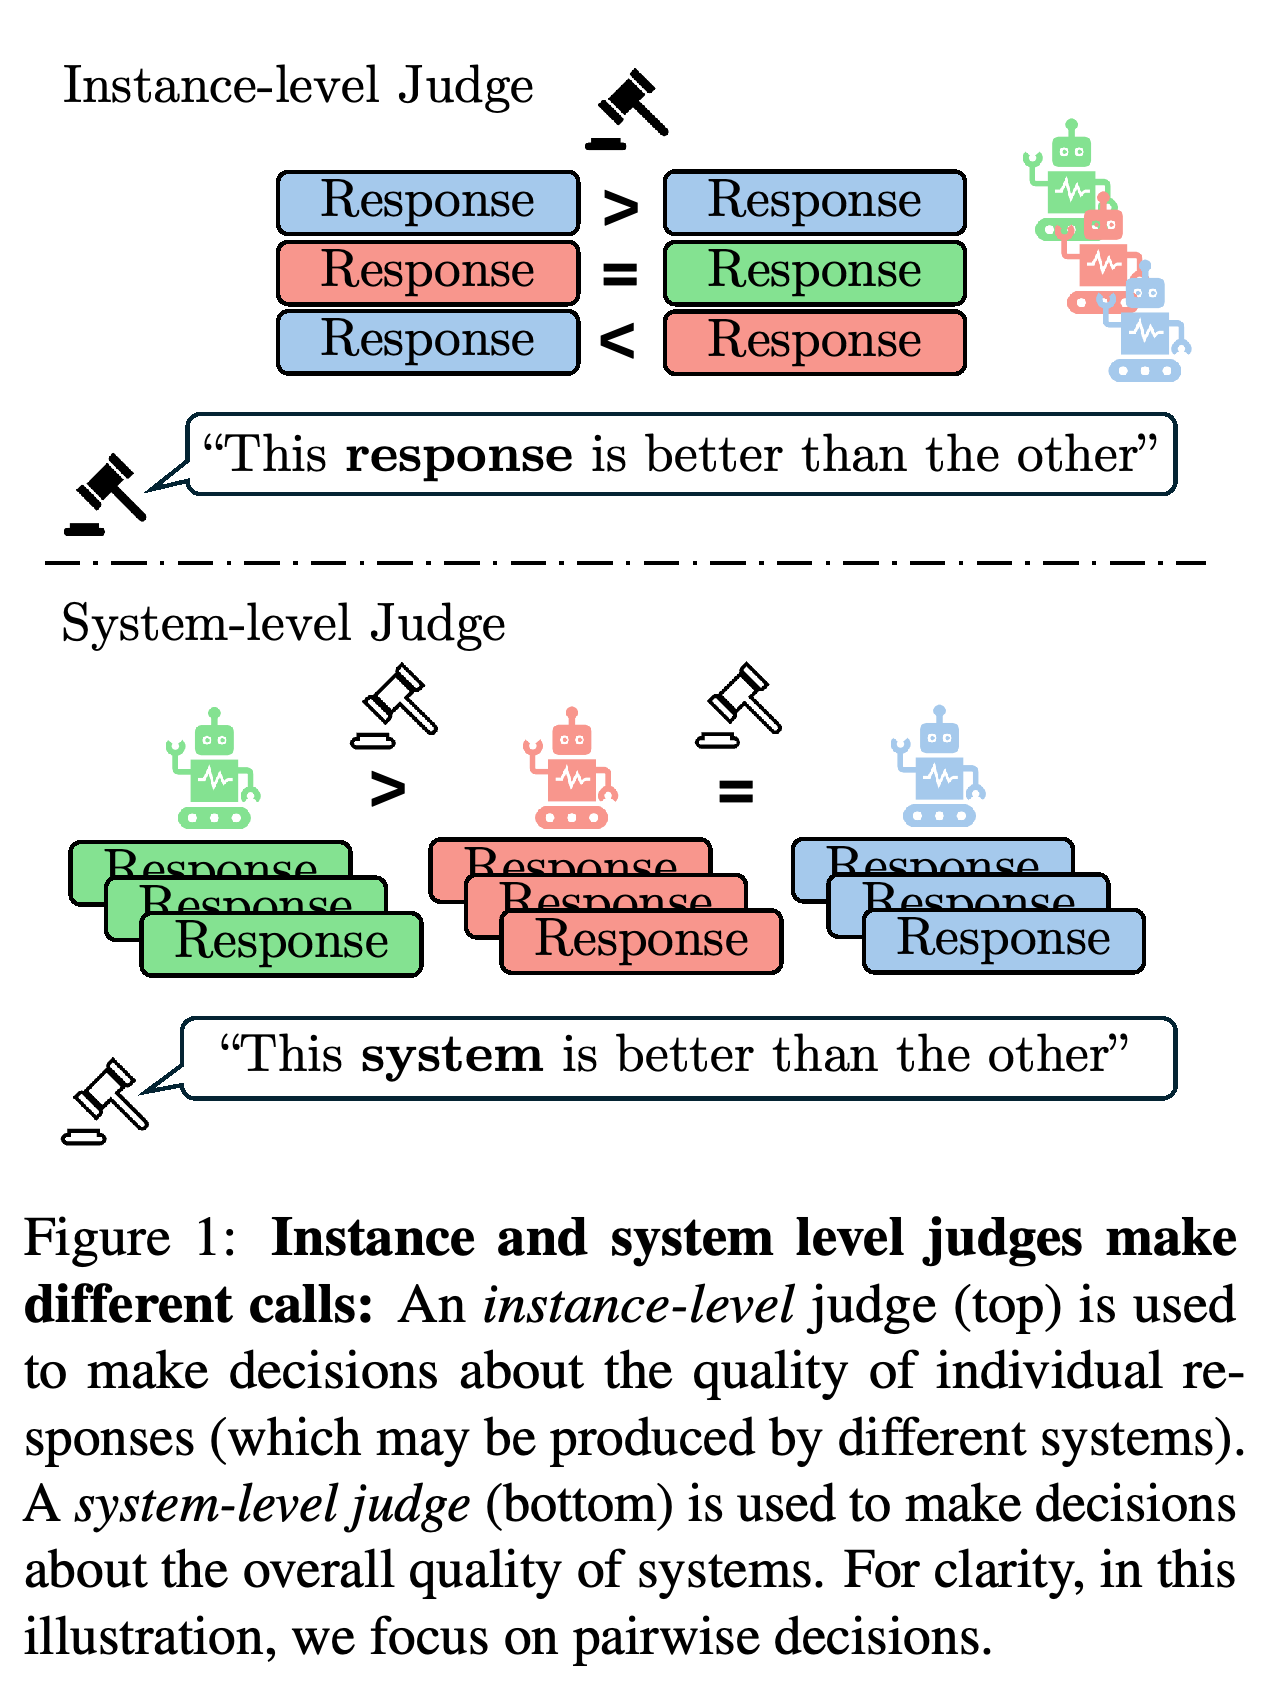
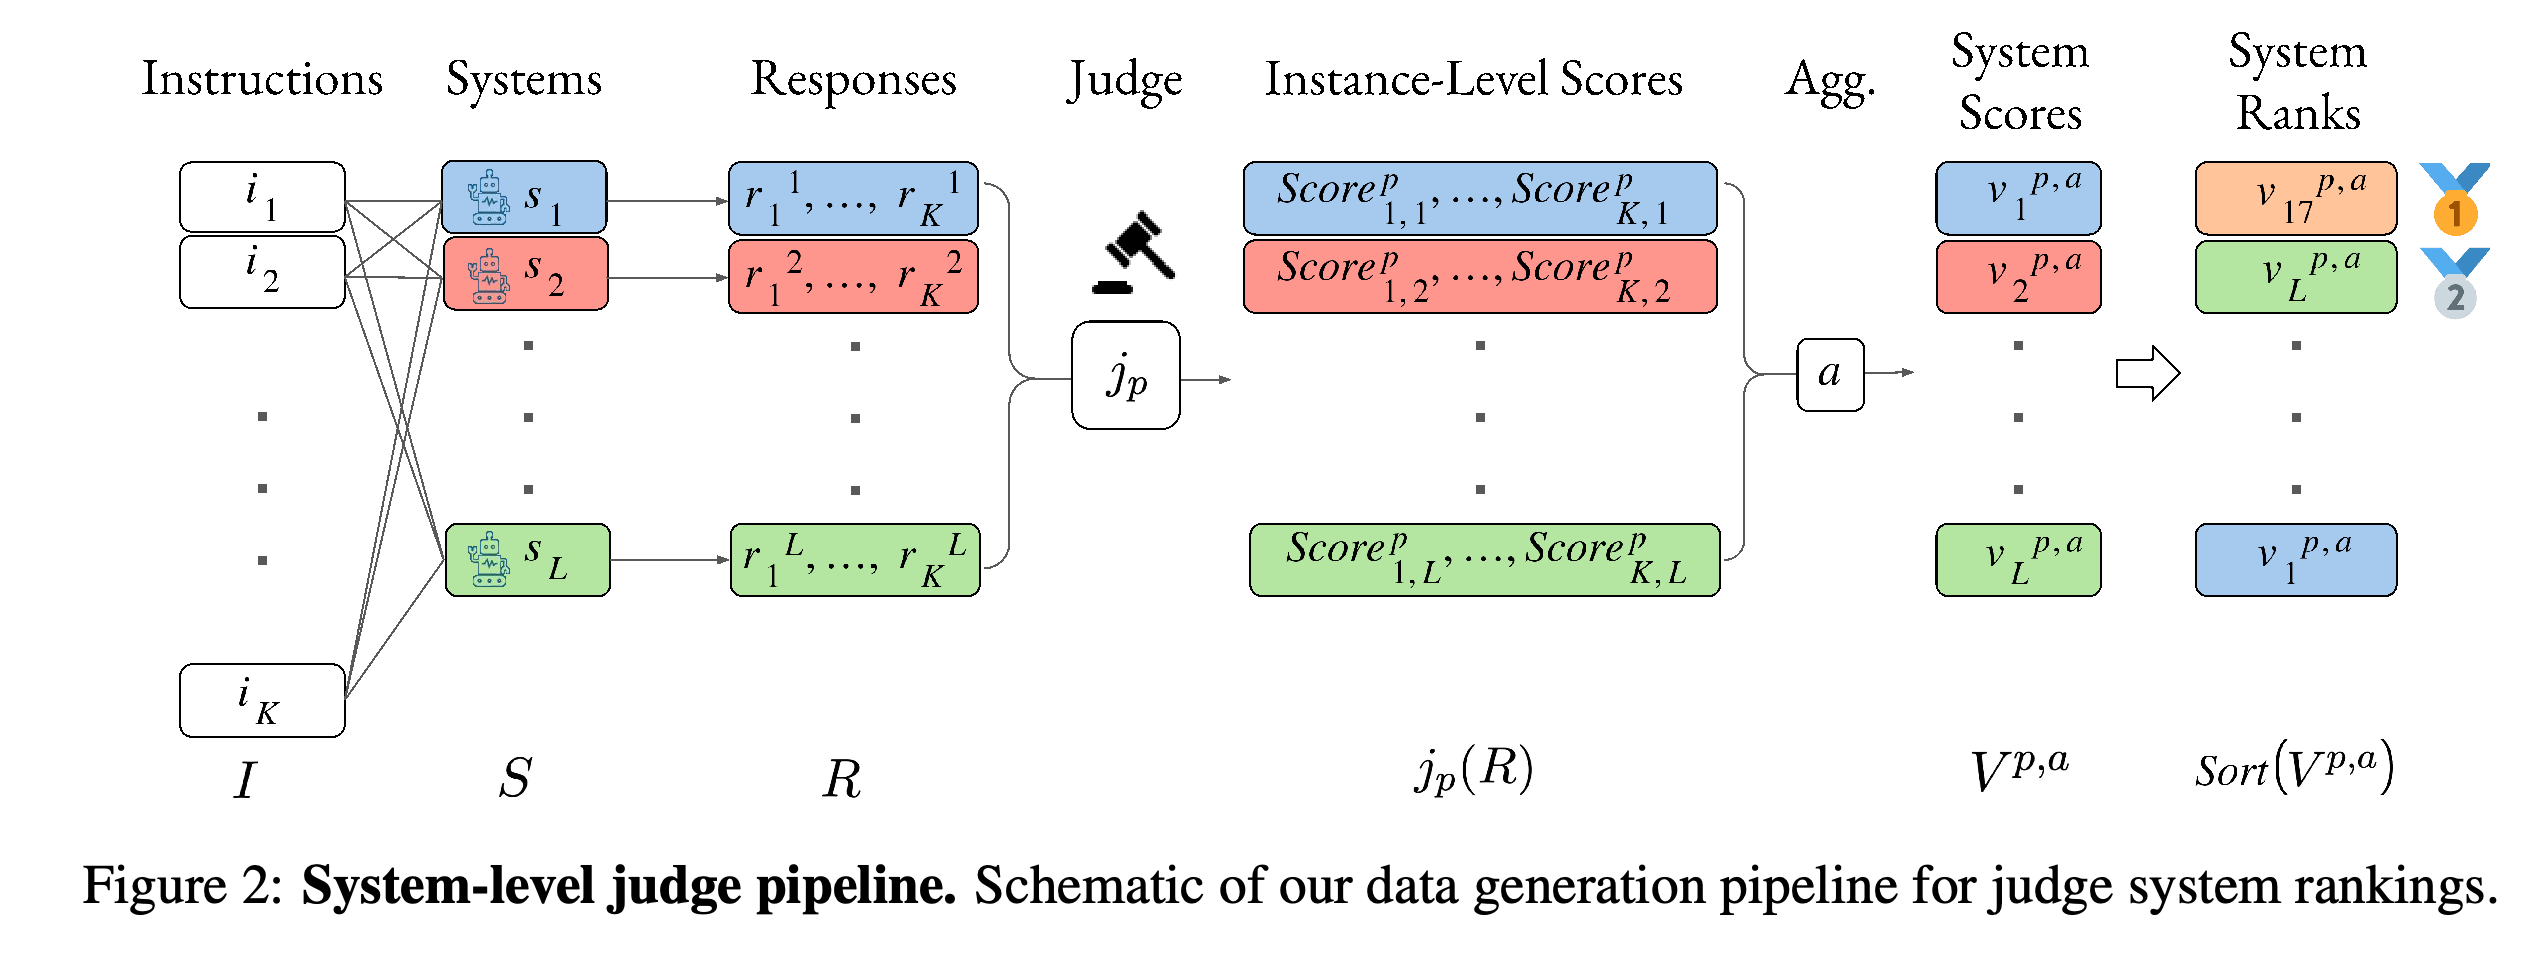
- Figure 1 separates response-level preference from system-level preference, while Figure 2 shows how response scores become a system ranking.
An evaluator can support two distinct decisions: choosing between individual outputs and choosing between the systems producing many outputs. This distinction explains why response accuracy alone is insufficient evidence for system-ranking reliability.
2 The Gap in Judge Benchmarking
Individual-response accuracy counts errors without describing how those errors are distributed across source systems. A judge can make relatively few errors overall while systematically favoring one system enough to distort its rank; imperfect response judgments can also aggregate into an accurate ranking.
- This motivates validating judges against the intended system-selection task and examining system-specific error patterns.
3 Task Formulation
Each of L systems answers the same K instructions, and each judge maps an instruction-response pair to a scalar quality score. An aggregation method converts the resulting K-by-L score matrix into one score per system; sorting these scores produces a ranking whose correlation with a human-derived reference measures judge performance.
- A system is the target model or pipeline being assessed; a judge scores or compares its responses. A generative LLM can serve either role.
The pipeline makes aggregation an explicit part of the judge configuration. A common response collection is scored by a judge, reduced to one score per system, and sorted, allowing the experiment to vary scoring and aggregation separately.
4 Experimental setup
The experiment separates response collection, judgment generation, score aggregation, and comparison with a human-derived reference. It evaluates dedicated reward models alongside generative LLMs prompted to judge responses in four different ways.
4.1 System Responses Data
Arena Hard v0.1 supplies 500 challenging instructions and, as of September 2024, responses from 63 systems, totaling about 32K instruction-response pairs. Each system answers the same instruction set, allowing judges to compare response scores across systems.
4.2 Generating Judgments
The 48 judge realizations comprise eight reward models and 40 prompted judges formed from 10 generative LLMs and four scoring realizations. Scoring 63 systems on 500 instructions with all 48 realizations yields approximately 1.5M individual scores.
- 4.2.1 Reward Models: The eight models are ArmoRM-Llama3-8B-v0.1, Eurus-RM-7b, InternLM2-7b-reward, InternLM2-20b-reward, Skywork-Reward-Llama-3.1-8B-v0.2, Llama-3-OffsetBias-RM-8B, GRM-Llama3.2-3B-ft, and URM-LLaMa-3.1-8B.
- 4.2.2 LLM Judge Realizations: The generative judges are Llama-3.1-405B-Instruct, Llama-3.1-70B-Instruct, Llama-3.1-8B-Instruct, Llama-3-70B-Instruct, Mixtral-8x22B-Instruct-v0.1, Mixtral-8x7B-Instruct-v0.1, Mistral-Large-Instruct-2407, Qwen2.5-72B-Instruct, GPT-4o, and GPT-4o-mini.
Numeric requests an absolute quality score between 0 and 100. Likert requests one of five labels, [Very Bad, Bad, Mediocre, Good, Very Good], mapped to scores from 1 to 5; TokenProbs asks whether a response is good and derives a score between 0.0 and 1.0 from first-token probabilities for yes and no.
- TokenProbs divides the summed probabilities for yes by the summed probabilities for yes and no, using the returned top log-probabilities for the first generated token.
Anchor compares each system response with the response from GPT-4-0314, the fixed reference system. Its five preference outcomes map to scores in [−2, +2], with 0 indicating a tie and +1 / +2 indicating slight/strong preference for the evaluated response.
- Using a fixed anchor avoids directly comparing every system against every other system.
4.3 Aggregations
The study constructs rankings with Win-rate, Mean, Median, and Bradley-Terry (BT), a model that estimates system strengths from pairwise outcomes, aggregation. Mean and Median, the middle response score, summarize each system’s own scores; Win-rate and BT use comparisons between systems’ response scores.
- Discrete scoring can give many systems the same median, preventing Median aggregation from separating them.
- For reward models with no tied response scores, BT and Win-rate aggregation produce similar rankings.
4.4 Gold Ranking - Chatbot Arena Battles
The reference ranking comes from human preference battles, comparisons between two system responses, in Chatbot Arena’s English Hard Prompts subset. This subset was selected because Arena Hard was designed to match its instruction distribution; judge quality is measured by Kendall’s Tau between automated and reference system rankings over the shared systems.
- The human reference and automated judgments come from separate datasets, so their comparison relies on distributional similarity rather than judgments of identical responses. There are 59 systems shared between the datasets.
5 JuStRank - Judge Performance Results
The highest-scoring configuration is Qwen2.5-72B-Instruct with Likert and Win-Rate aggregation at 0.827, followed by URM-LLaMa-3.1-8B with Mean at 0.823 and GPT-4o-2024-11-20 with Anchor and Mean at 0.822. These results show that an 8B-parameter reward model can achieve ranking agreement comparable to leading generative judges in this setting.
- Table 1 reports each judge model’s best realization and aggregation, rounding these three results to 0.83, 0.82, and 0.82; Table 2 supplies the three-decimal values.
- Equal agreement with the human reference does not imply identical rankings: judges can disagree on different system pairs.
Qwen2.5-72B-Instruct leads at the displayed precision of 0.83, while URM-LLaMa-3.1-8B and GPT-4o each reach 0.82. Each row selects that model’s best realization and aggregation, so the table compares configurations chosen separately for each model.
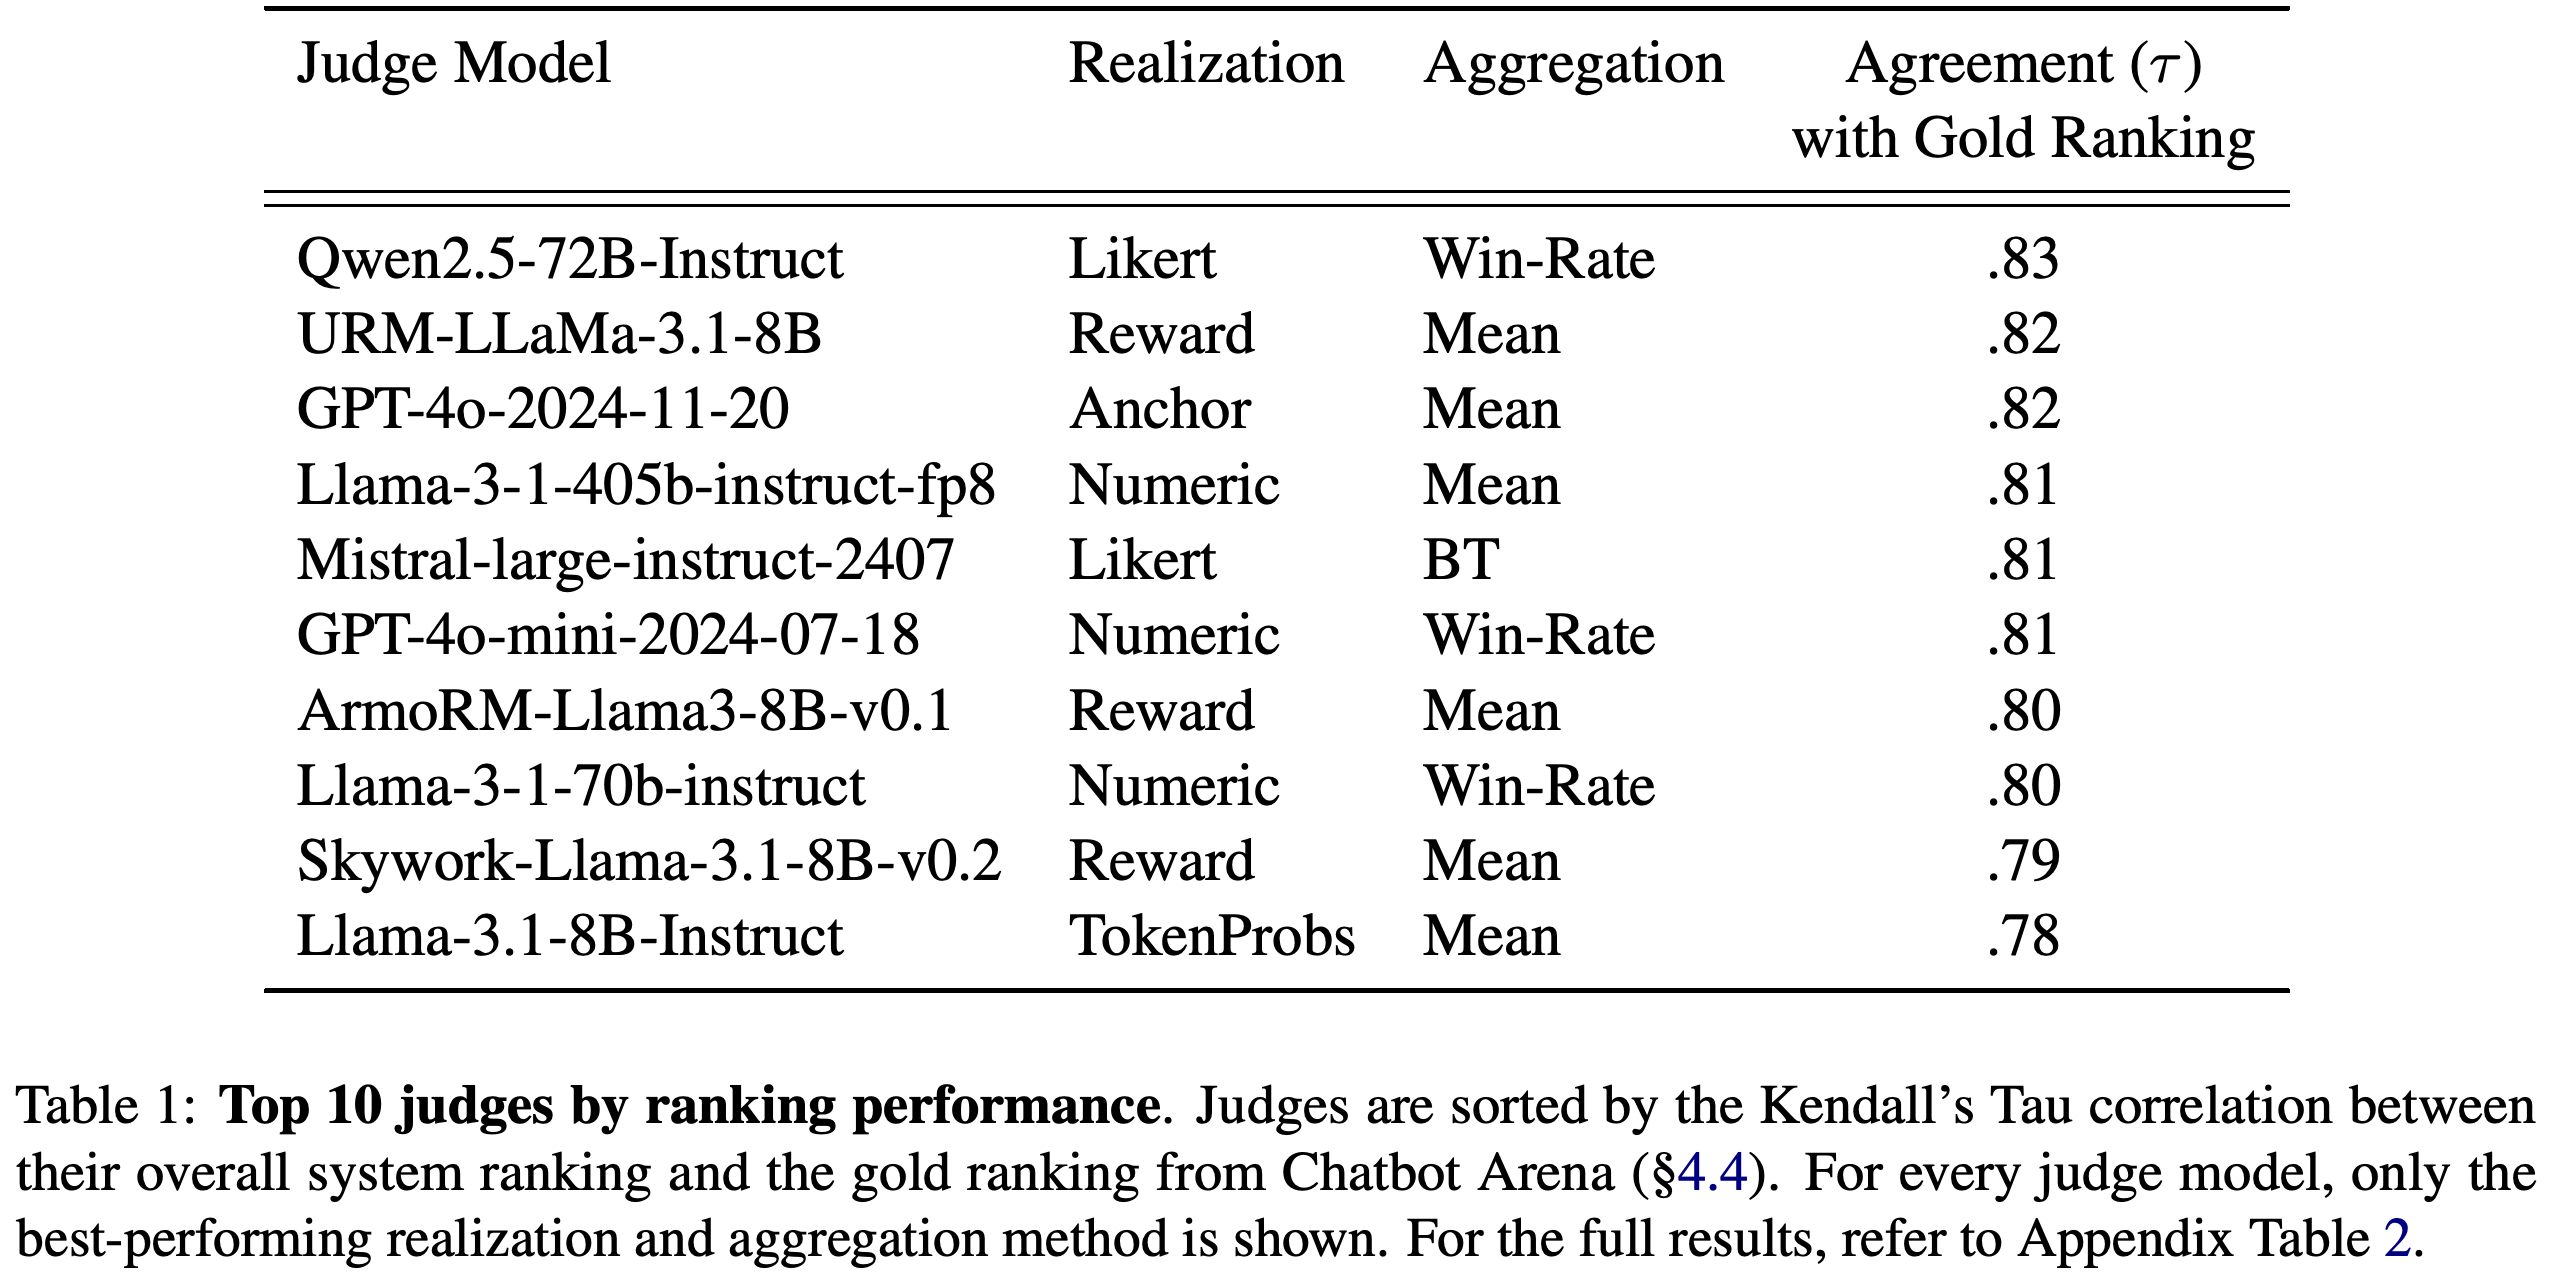
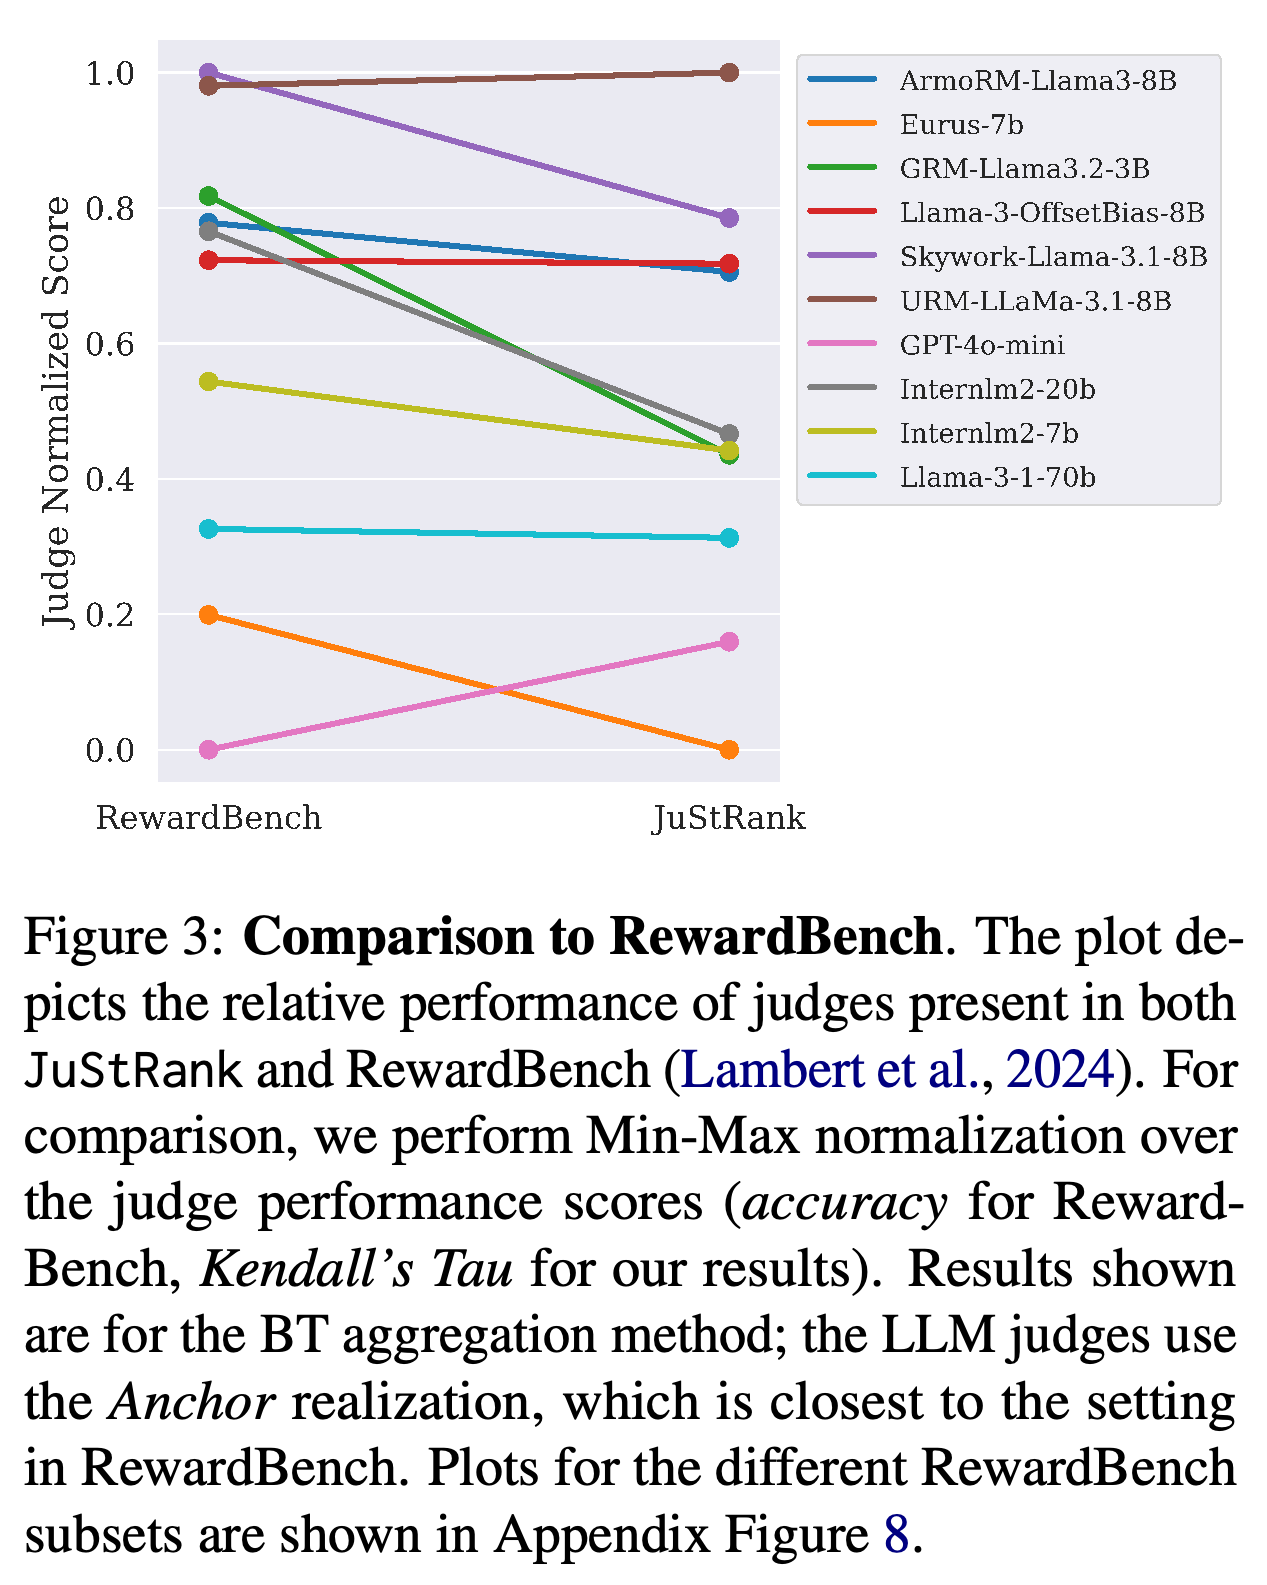
Figure 3 shows that relative performance on RewardBench does not consistently predict relative performance on JuStRank. Different comparative prompts and possible adaptation of newer reward models to RewardBench are additional explanations acknowledged by the authors.
- The plotted comparison uses BT aggregation, Anchor for generative judges, and separate Min-Max normalization, rescaling each benchmark’s observed scores to [0, 1], of RewardBench accuracy and JuStRank ranking correlation.
Crossing lines show changes in relative judge performance between response-level evaluation and system ranking. Separate Min-Max normalization permits comparison of relative positions; vertical differences do not represent differences on a common raw metric.
5.1 Effects of LLM Realizations
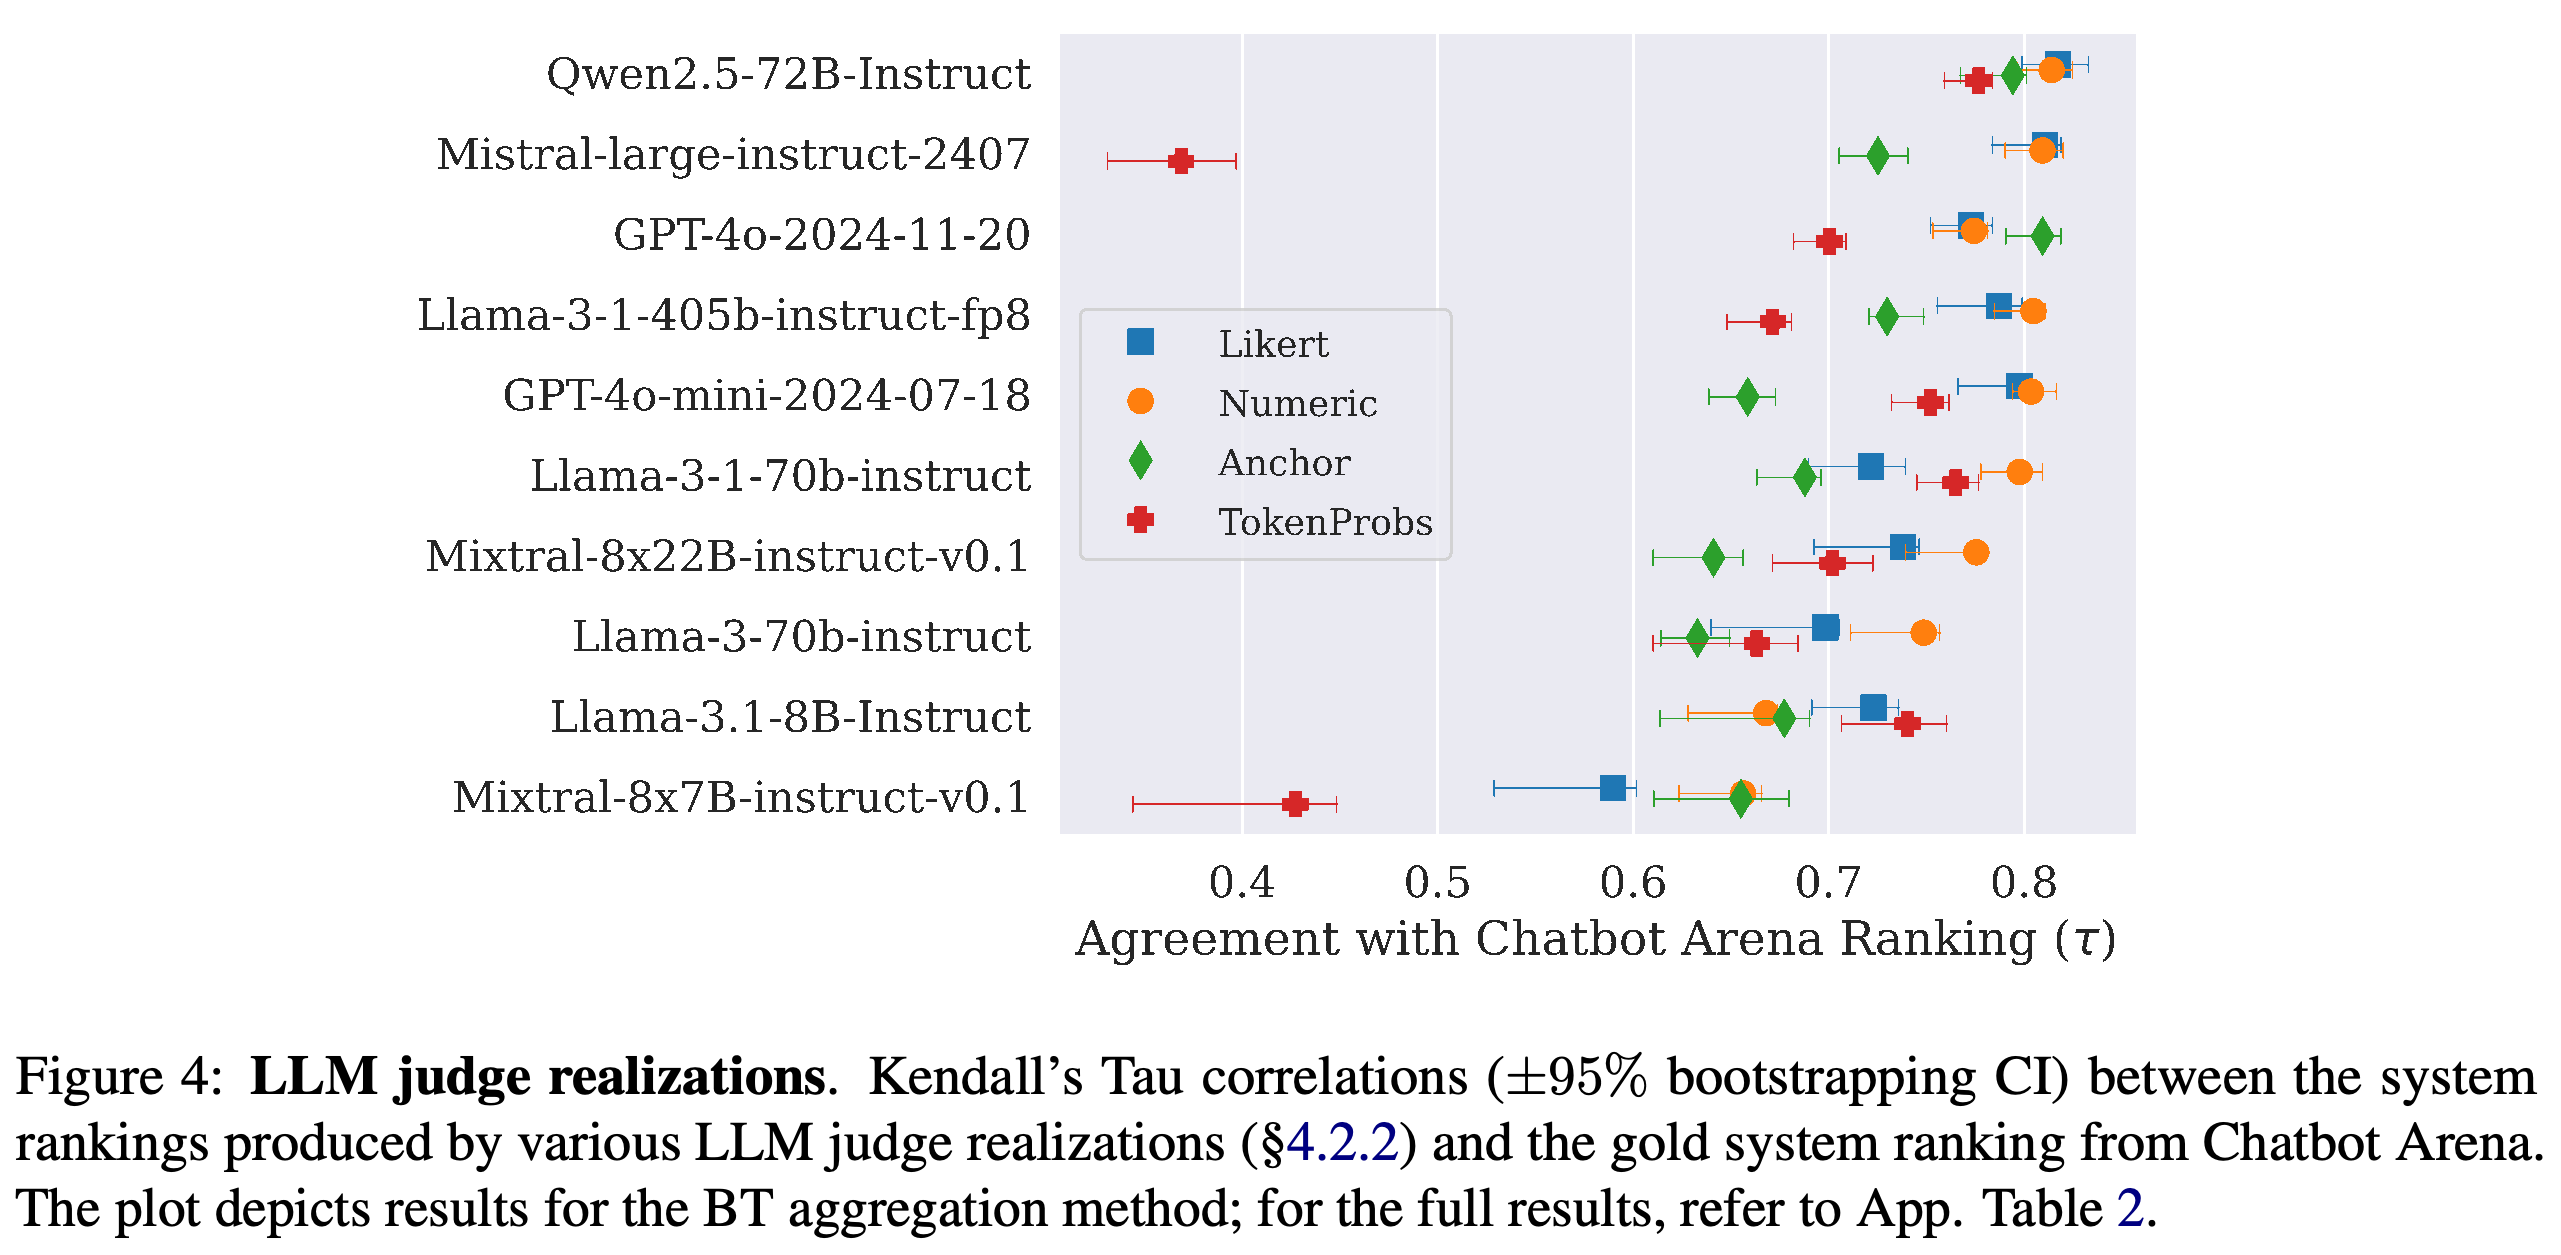
Figure 4 shows substantial changes in ranking agreement when the same LLM uses different scoring realizations. Numeric and Likert perform best overall, while Anchor generally performs worse except for GPT-4o; the paper’s statistical analysis finds both Numeric and Likert significantly better than Anchor and TokenProbs.
- Each realization also produces a characteristic score distribution. Numeric and Likert concentrate on particular scores, while TokenProbs often produces values extremely close to 0 or 1.
- The figure uses BT aggregation and 95% bootstrap confidence intervals, uncertainty intervals estimated by resampling.
Changing the scoring realization produces large differences even with model identity and BT aggregation fixed. Mistral-large-instruct-2407 performs strongly with Numeric and Likert but poorly with TokenProbs, while GPT-4o is a notable case where Anchor performs best.
6 Judge Behavior
The behavioral analysis examines pairwise system win-rates before score aggregation. A judge’s win-rate is the fraction of non-tied instructions on which one system receives a higher response score than the other; comparison with human battles covers 59 shared systems and 968 system pairs.
- These behavioral win-rates exclude tied scores. Win-rate aggregation instead averages strict score wins across all instructions and other systems.
6.1 Some Judges are Particularly Decisive
Some judges produce more extreme pairwise win-rates than humans: in Figure 5, Llama-405B with Likert often predicts a win-rate above 0.9 for pairs whose human win-rate is approximately 0.8. The paper models this relationship with a symmetric beta cumulative distribution function, a curve with equal shape parameters that maps human win-rates to predicted judge win-rates.
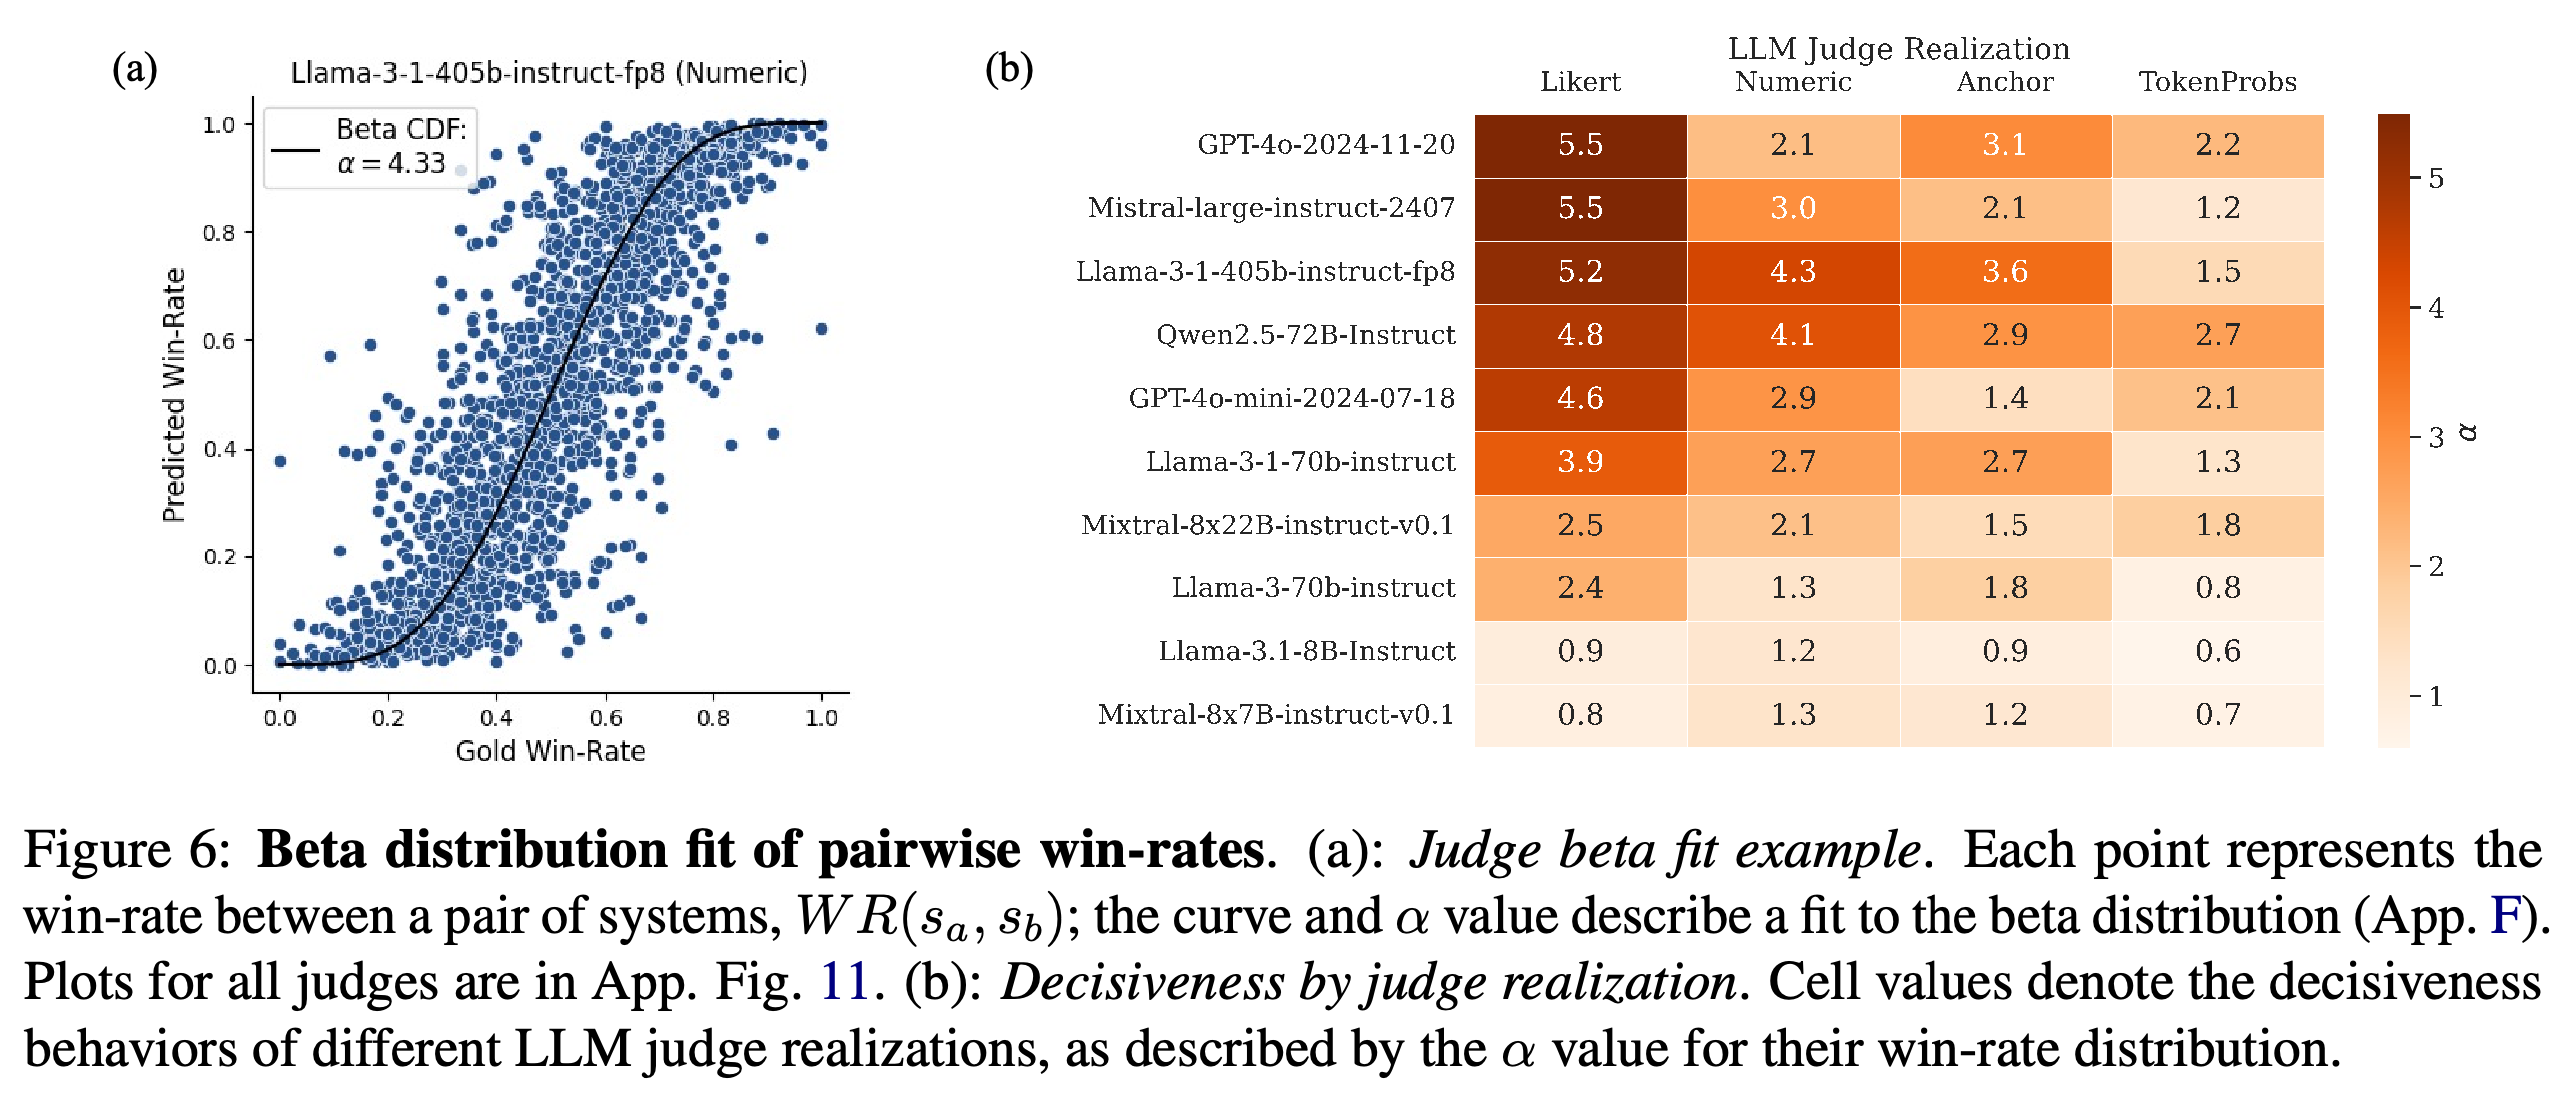
- The fitted shape parameter alpha measures decisiveness: alpha equals 1 for the identity relationship, exceeds 1 for more extreme preferences, and falls below 1 for less decisive preferences.
- Figure 6 shows that Likert generally produces stronger decisiveness than TokenProbs, with substantial variation across models.
The scatter separates agreement about the winning system from agreement about its numerical win-rate. The Llama-405B Likert example bends toward extreme predictions, showing that a judge can preserve many winning decisions while overstating preference margins.
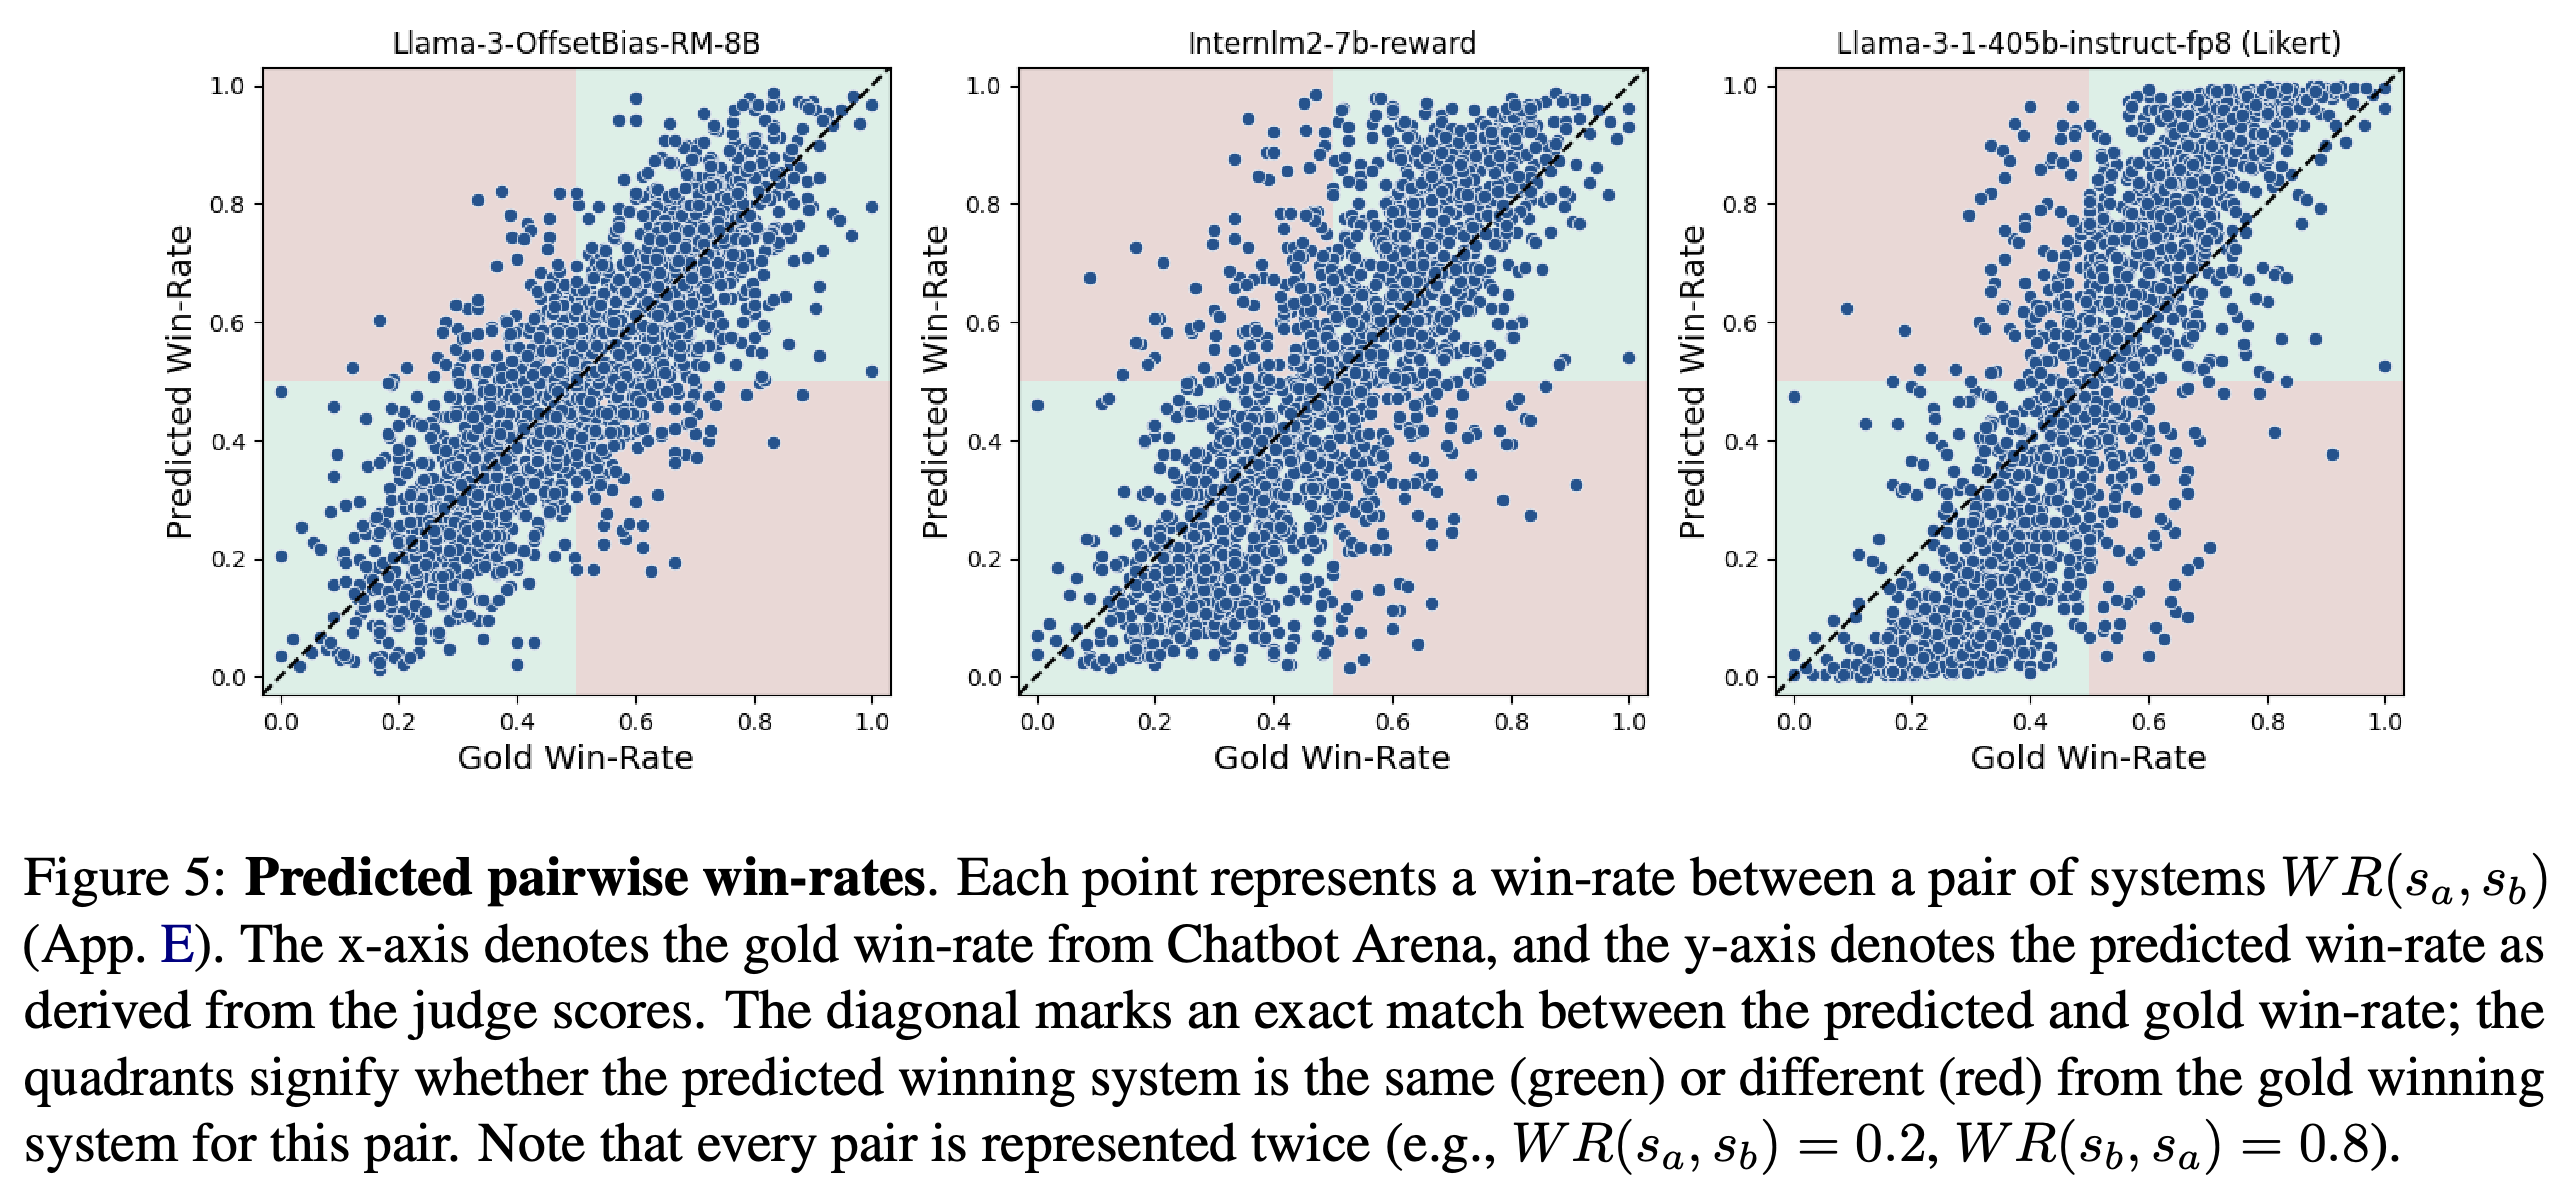
The authors offer two possible sources of this pattern: disagreement among human annotators can soften aggregate human preferences, and judges may use heuristics that favor responses from stronger systems. The experiment does not establish which explanation dominates; the suggested benefit of stronger separation with fewer responses is an interpretation supported by prior work, rather than a sample-efficiency experiment conducted here.
The example curve summarizes Llama-405B Numeric’s amplified preferences with a fitted alpha of 4.33. The heat map shows that decisiveness depends on both the model and scoring realization, with Likert often yielding the highest values and several TokenProbs configurations falling below 1.
6.2 Bias Towards Specific Systems
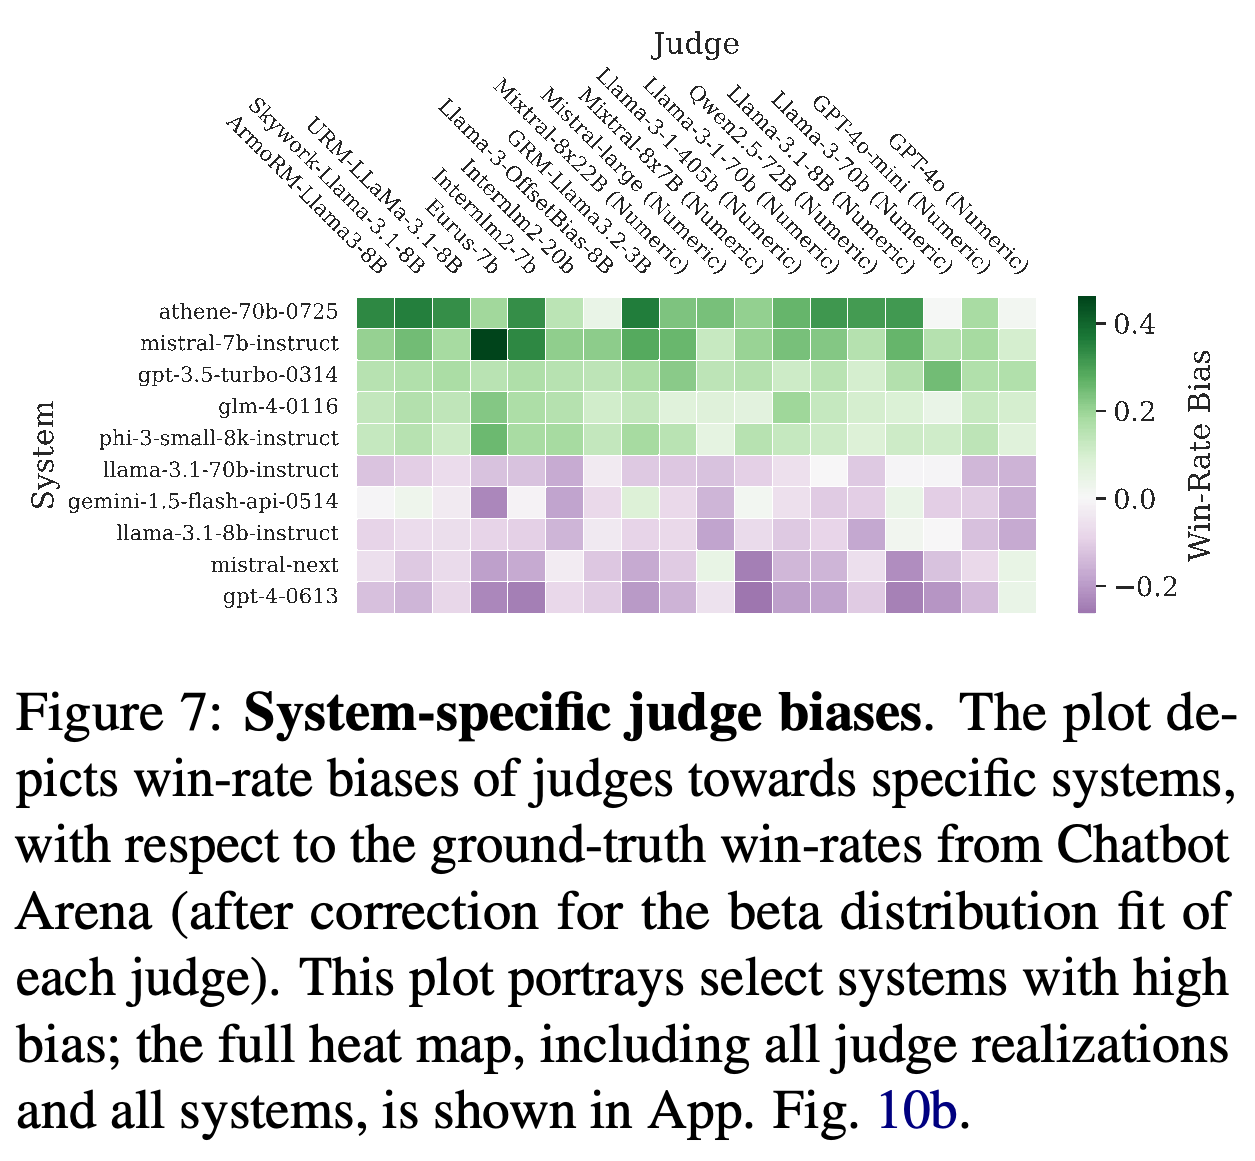
System-specific bias is the average difference between a system’s judge-predicted and human-reference win-rates across its observed opponents. To separate this effect from general decisiveness, the authors replace the raw human reference with the value predicted by each judge’s fitted beta curve before calculating corrected bias.
- Figure 7 shows persistent positive bias toward Athene-70B across many judges, which often rank it first.
- GPT-4-0613 is 27th in the human reference but receives a median rank of 38 across judges.
- Self-bias, preference toward a system sharing the judge’s underlying LLM, appears in some configurations but is not consistent across realizations.
Horizontal bands of similar color reveal systems that many judges consistently overvalue or undervalue after correcting for decisiveness. The positive band for Athene-70B and negative band for GPT-4-0613 show shared system-specific bias that overall ranking agreement alone does not describe.
6.3 Characterizing Judge Behaviors
Overall bias propensity is measured as the standard deviation of corrected bias across systems. Ranking quality has Pearson correlation, a measure of linear association, of 0.55 with decisiveness and −0.56 with bias propensity, while the correlation between decisiveness and corrected bias propensity is −0.07.
- These associations describe complementary judge characteristics; they do not establish that increasing decisiveness causes better rankings.
7 Related Work
The paper connects established system-level evaluation of natural language generation with recent benchmarks of LLM judges. RewardBench and JudgeBench, a benchmark of challenging response pairs with subtle errors, evaluate individual-response comparisons, while Arena Hard and AlpacaEval, an automated system-comparison benchmark, validate particular leaderboard setups against external rankings.
- JuStRank compares multiple judge models and realizations as system rankers and analyzes their decisiveness and system-specific bias.
- Prior task-specific system-level judge evaluation on TriviaQA, a question-answering dataset, provides a narrower precedent; JuStRank studies a larger, general-purpose collection of systems and instructions.
8 Discussion
Judge selection involves the model, scoring prompt, absolute or comparative judgments, and aggregation method, with interactions between these choices. The results support validating the complete evaluation configuration against the intended system-ranking task and considering the distribution of systems whose responses it scores.
- The authors distinguish potentially useful separation of strong and weak systems from residual biases that distort particular systems’ rankings.
- The released scores support further investigation of dedicated system-ranking judges, judge ensembles that combine multiple evaluators, and alternative aggregations; these are proposed research directions.
9 Conclusion
JuStRank benchmarks judges by aggregating their response scores and comparing the induced system ranking with a human-derived ranking. Within the tested setting, judge size alone does not determine ranking quality, some dedicated reward models match leading LLM judges, and decisiveness and system-specific bias characterize behavior beyond overall ranking agreement.
Limitations
The human-reference dataset does not expose the battle instructions or responses, so automated judgments use Arena Hard instead. Consequently, the comparison assumes sufficient similarity between Arena Hard and English Hard Prompts rather than directly measuring human and automated judgments on identical examples.
- Results are limited to the exact prompts and inference implementations used; alternative phrasing or application programming interface (API) behavior may change judge outputs.
- Aggregated human preference combines subjective dimensions such as helpfulness, safety, style, and coherence.
- The reference primarily defines quality through winning frequency rather than the magnitude of per-response quality differences.
- The experiments do not establish performance in specialized domains, individual tasks, or languages other than English.
Appendix
- A Judge Score Distributions shows that scoring realizations produce different ranges, concentrations, and ties. Anchor distributions depend on the reference system as well as judge behavior.
- B Aggregation Methods describes Mean, Median, Win-rate, and Bradley-Terry aggregation. Ties in discrete scores can make Median unsuitable for distinguishing systems.
- C Chatbot Arena Data describes deduplication of the public data, construction of the human reference ranking from English Hard Prompts, and selection of shared-system, non-tied battles for behavioral analysis.
- D Statistical Analysis of Judge Performance finds effects of the judge model, realization, and their interaction, but no significant aggregation effect in the reported analysis. Numeric and Likert outperform Anchor and TokenProbs in the reported post-hoc comparisons.
- E Pairwise Win-Rates distinguishes correctly identifying the winner from accurately estimating the winning margin. Decisive judges can perform well at the former while exaggerating the latter.
- F Beta Distribution Fit describes fitting a symmetric beta cumulative distribution function to the relationship between human and judge win-rates, using weighted absolute error.
- G LLM Judge Prompts provides the exact Numeric, Likert, TokenProbs, and Anchor scoring templates used in the experiments.
Brief Thoughts
The benchmark addresses a common engineering decision: selecting systems from aggregated evaluations. The 0.823 result for URM-LLaMa-3.1-8B and the substantial within-model differences across scoring realizations provide concrete reasons to validate the full judge configuration rather than select it from model size or an individual-response leaderboard alone.
The behavioral decomposition helps explain how a judge can exaggerate preference margins while preserving many winning decisions, whereas system-specific residual bias can distort rankings. Its interpretation remains conditional on the separate human and automated datasets, and the reported correlations do not establish a universal benefit from more decisive judges.