


Orchard: An Open-Source Agentic Modeling Framework | Summary
14 May 2026 | Paper Review Agent Learning Rollout Infrastructure Reinforcement Learning Reward ModelingContents
- Summary
- 1 Introduction
- 2 Orchard Env
- 3 Orchard-SWE
- 3.1 Problem Setting
- 3.2 Trajectory Collection and Curation
- 3.3 Off-policy Learning: Supervised Fine-Tuning with credit assignment
- 3.4.1 Reinforcement Learning with Balanced Adaptive Rollout (BAR)
- 3.4.2 Denser Reward: On Policy Distillation (OPD)
- 3.4.3 Denser Reward: Rubric-based Process Reward (RPR)
- 3.5 Distilling Historical Rollouts into a Value Model
- 3.6 Main Results
- 3.7 Generalization to Unseen Harnesses and Tasks
- 3.8 Ablations and Analysis
- 4 Orchard-GUI
- 5 Orchard-Claw
- 6 Related Work
- 7 Conclusion
- Appendix
- Brief Thoughts
This article explains the key points of Orchard: An Open-Source Agentic Modeling Framework.
- 2026-05-14 (arXiv)
- Peng, Baolin, Yao, Wenlin, Wu, Qianhui, Cheng, Hao, Yu, Xiao, Yang, Rui, Ge, Tao, Sordoni, Alessandro, Yuan, Xingdi, Shen, Yelong, et al.
- Microsoft Research, Columbia University, UIUC
- Paper
- Github
Summary
- Orchard: An Open-Source Agentic Modeling Framework separates sandbox execution from agent harnesses, inference services, and trainers. Its Kubernetes-native Orchard Env supports trajectory collection, supervised fine-tuning (SFT), reinforcement learning (RL), and evaluation through a shared environment interface.
- Orchard-SWE combines supervision from productive segments of failed trajectories, reward-balanced rollout selection, dense teacher or process rewards, and historical-rollout value-model training. On SWE-bench Verified, Qwen3.5-35B-A3B reaches 69.7% with rubric-based process reward and 73.0% with six-candidate value-model reranking.
- Orchard-GUI trains a 4B vision-language agent using 412 distilled trajectories and 2,198 RL tasks, achieving 68.4% average success across three browser benchmarks. Orchard-Claw uses 192 synthetic tasks and reaches 59.6% pass@3 with the Claw-Eval ReAct-style harness, increasing to 73.9% with ZeroClaw; both harnesses are used during training.
- Systems experiments report 0.280 s average execution latency and 100% success in a short 1,000-sandbox lifecycle test with pre-pulled images. The experiments demonstrate reuse of the execution service and substantial agent-training gains, but do not establish harness independence or total training-cost efficiency: evaluation conditions vary, GUI collection requires 62,395 teacher rollouts, and SWE reranking requires additional inference candidates.
1 Introduction
The paper identifies environment management as a bottleneck in reproducible agent training: each rollout may require repository setup, dependency installation, repeated tool execution, and cleanup, multiplied across thousands of isolated environments. Orchard proposes a narrow service boundary reusable across task domains, agent harnesses, and pipeline stages rather than embedding execution management inside a particular training stack.
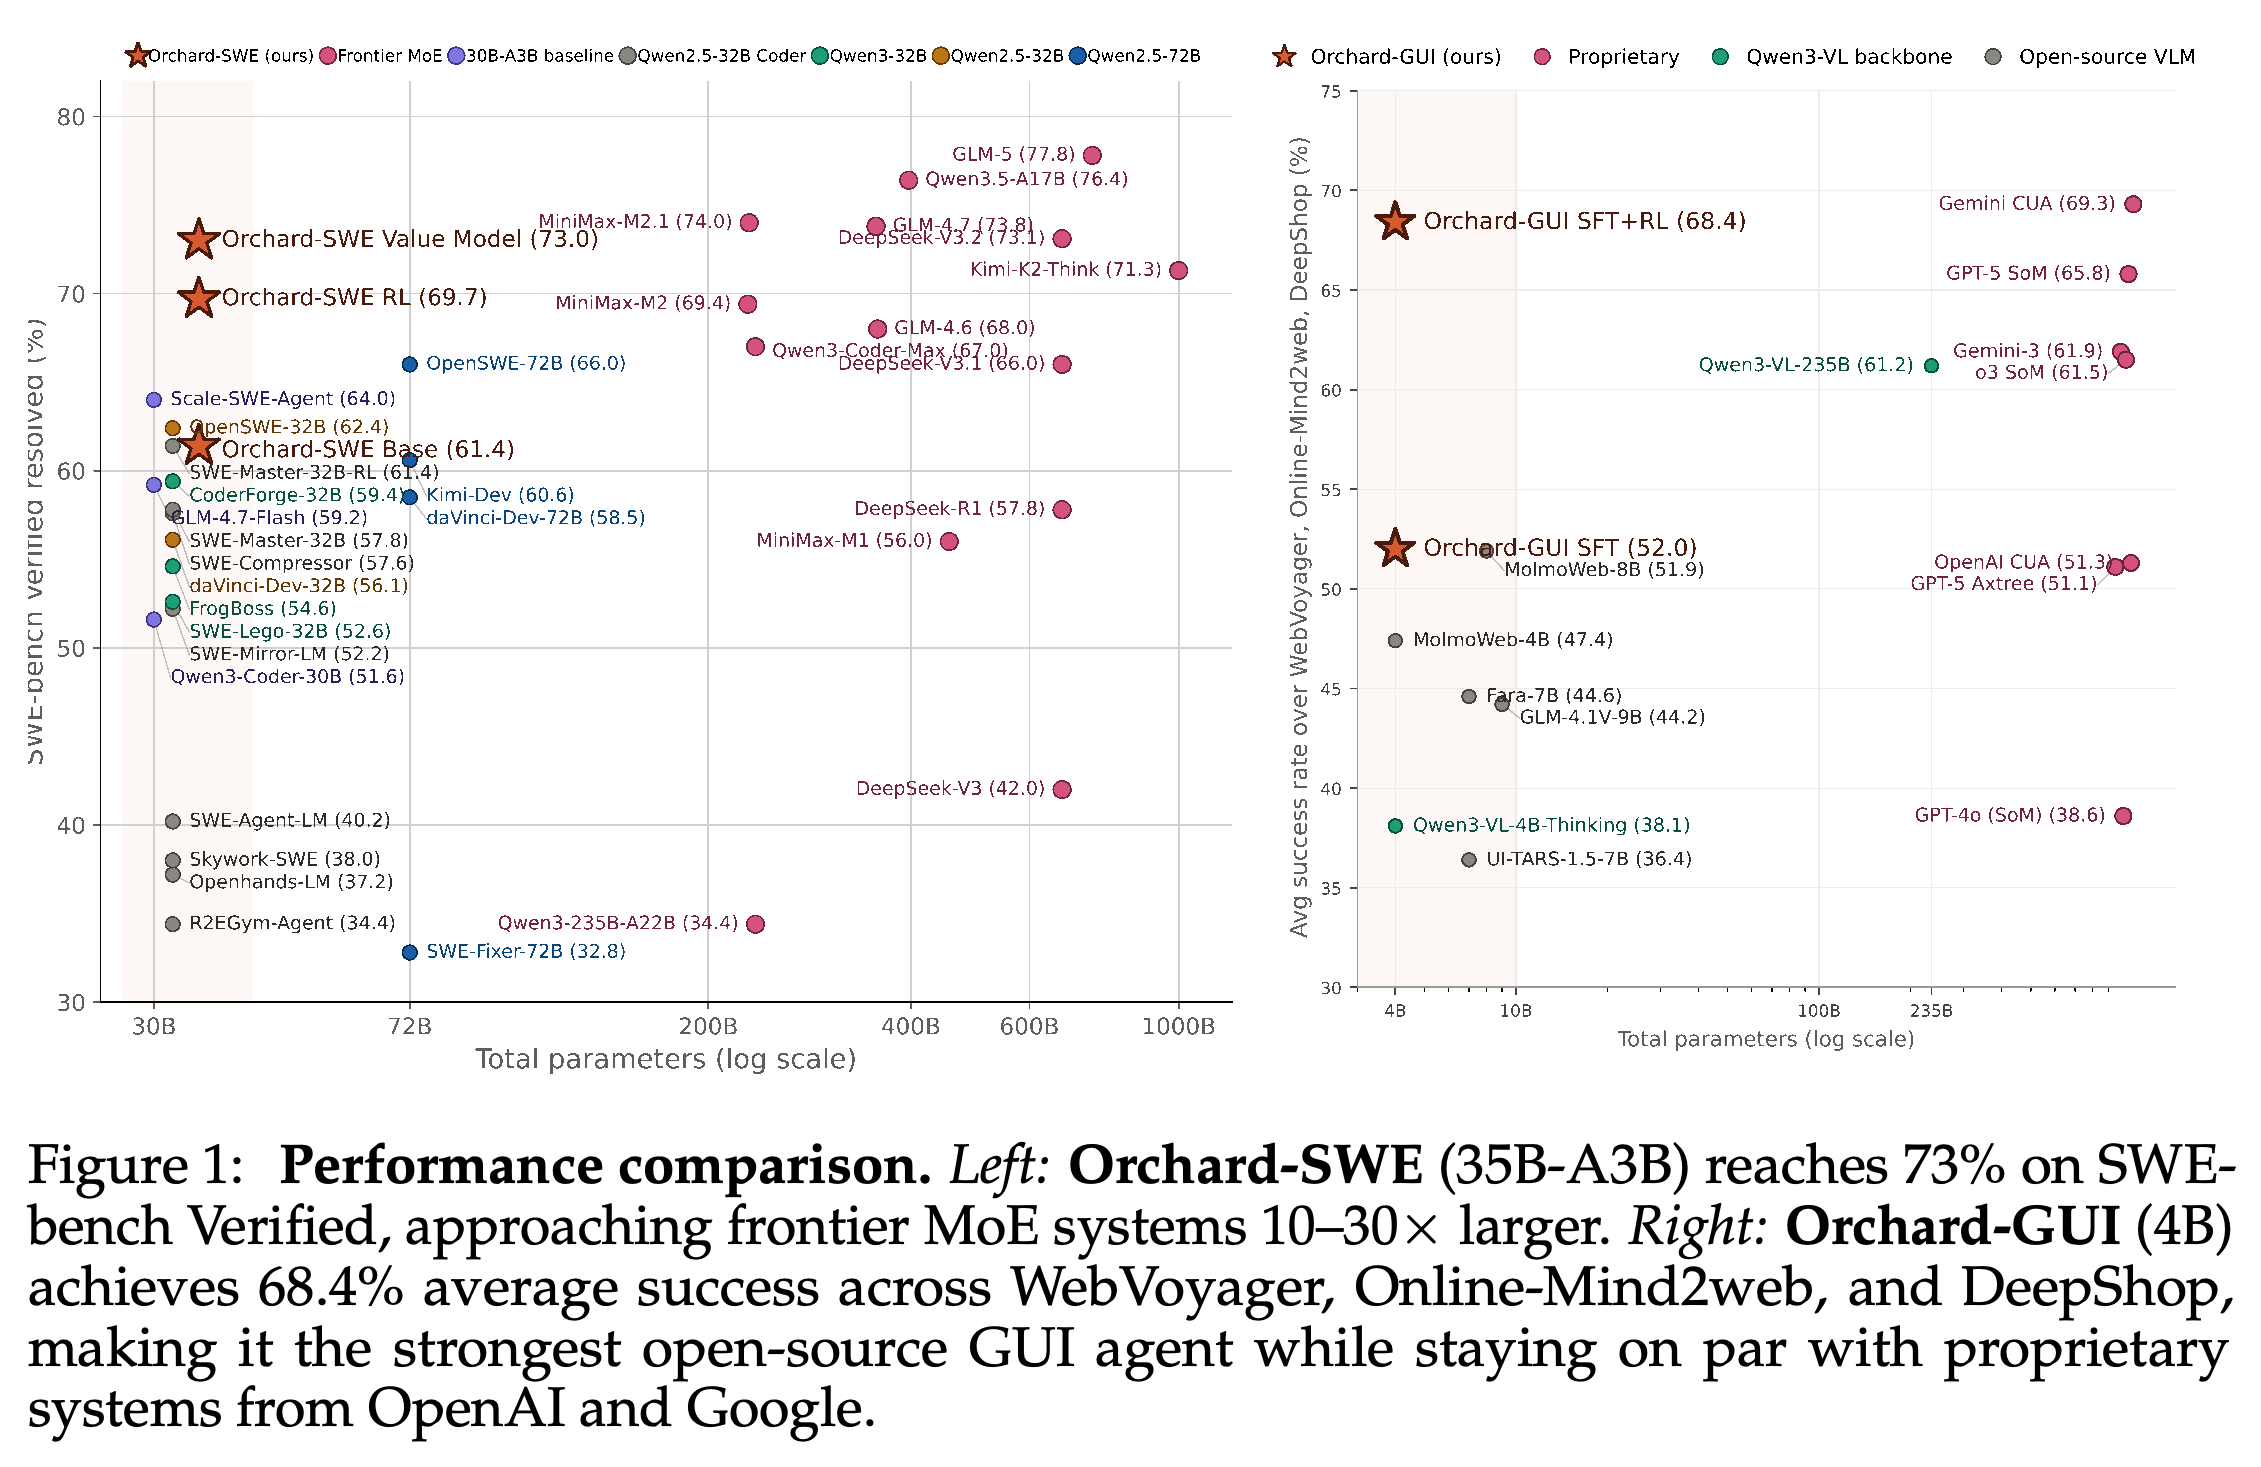
- Figure 1 places SWE and GUI performance against total model parameters. These are system-level comparisons, not controlled parameter-scaling experiments: harnesses, training data, and inference procedures differ.
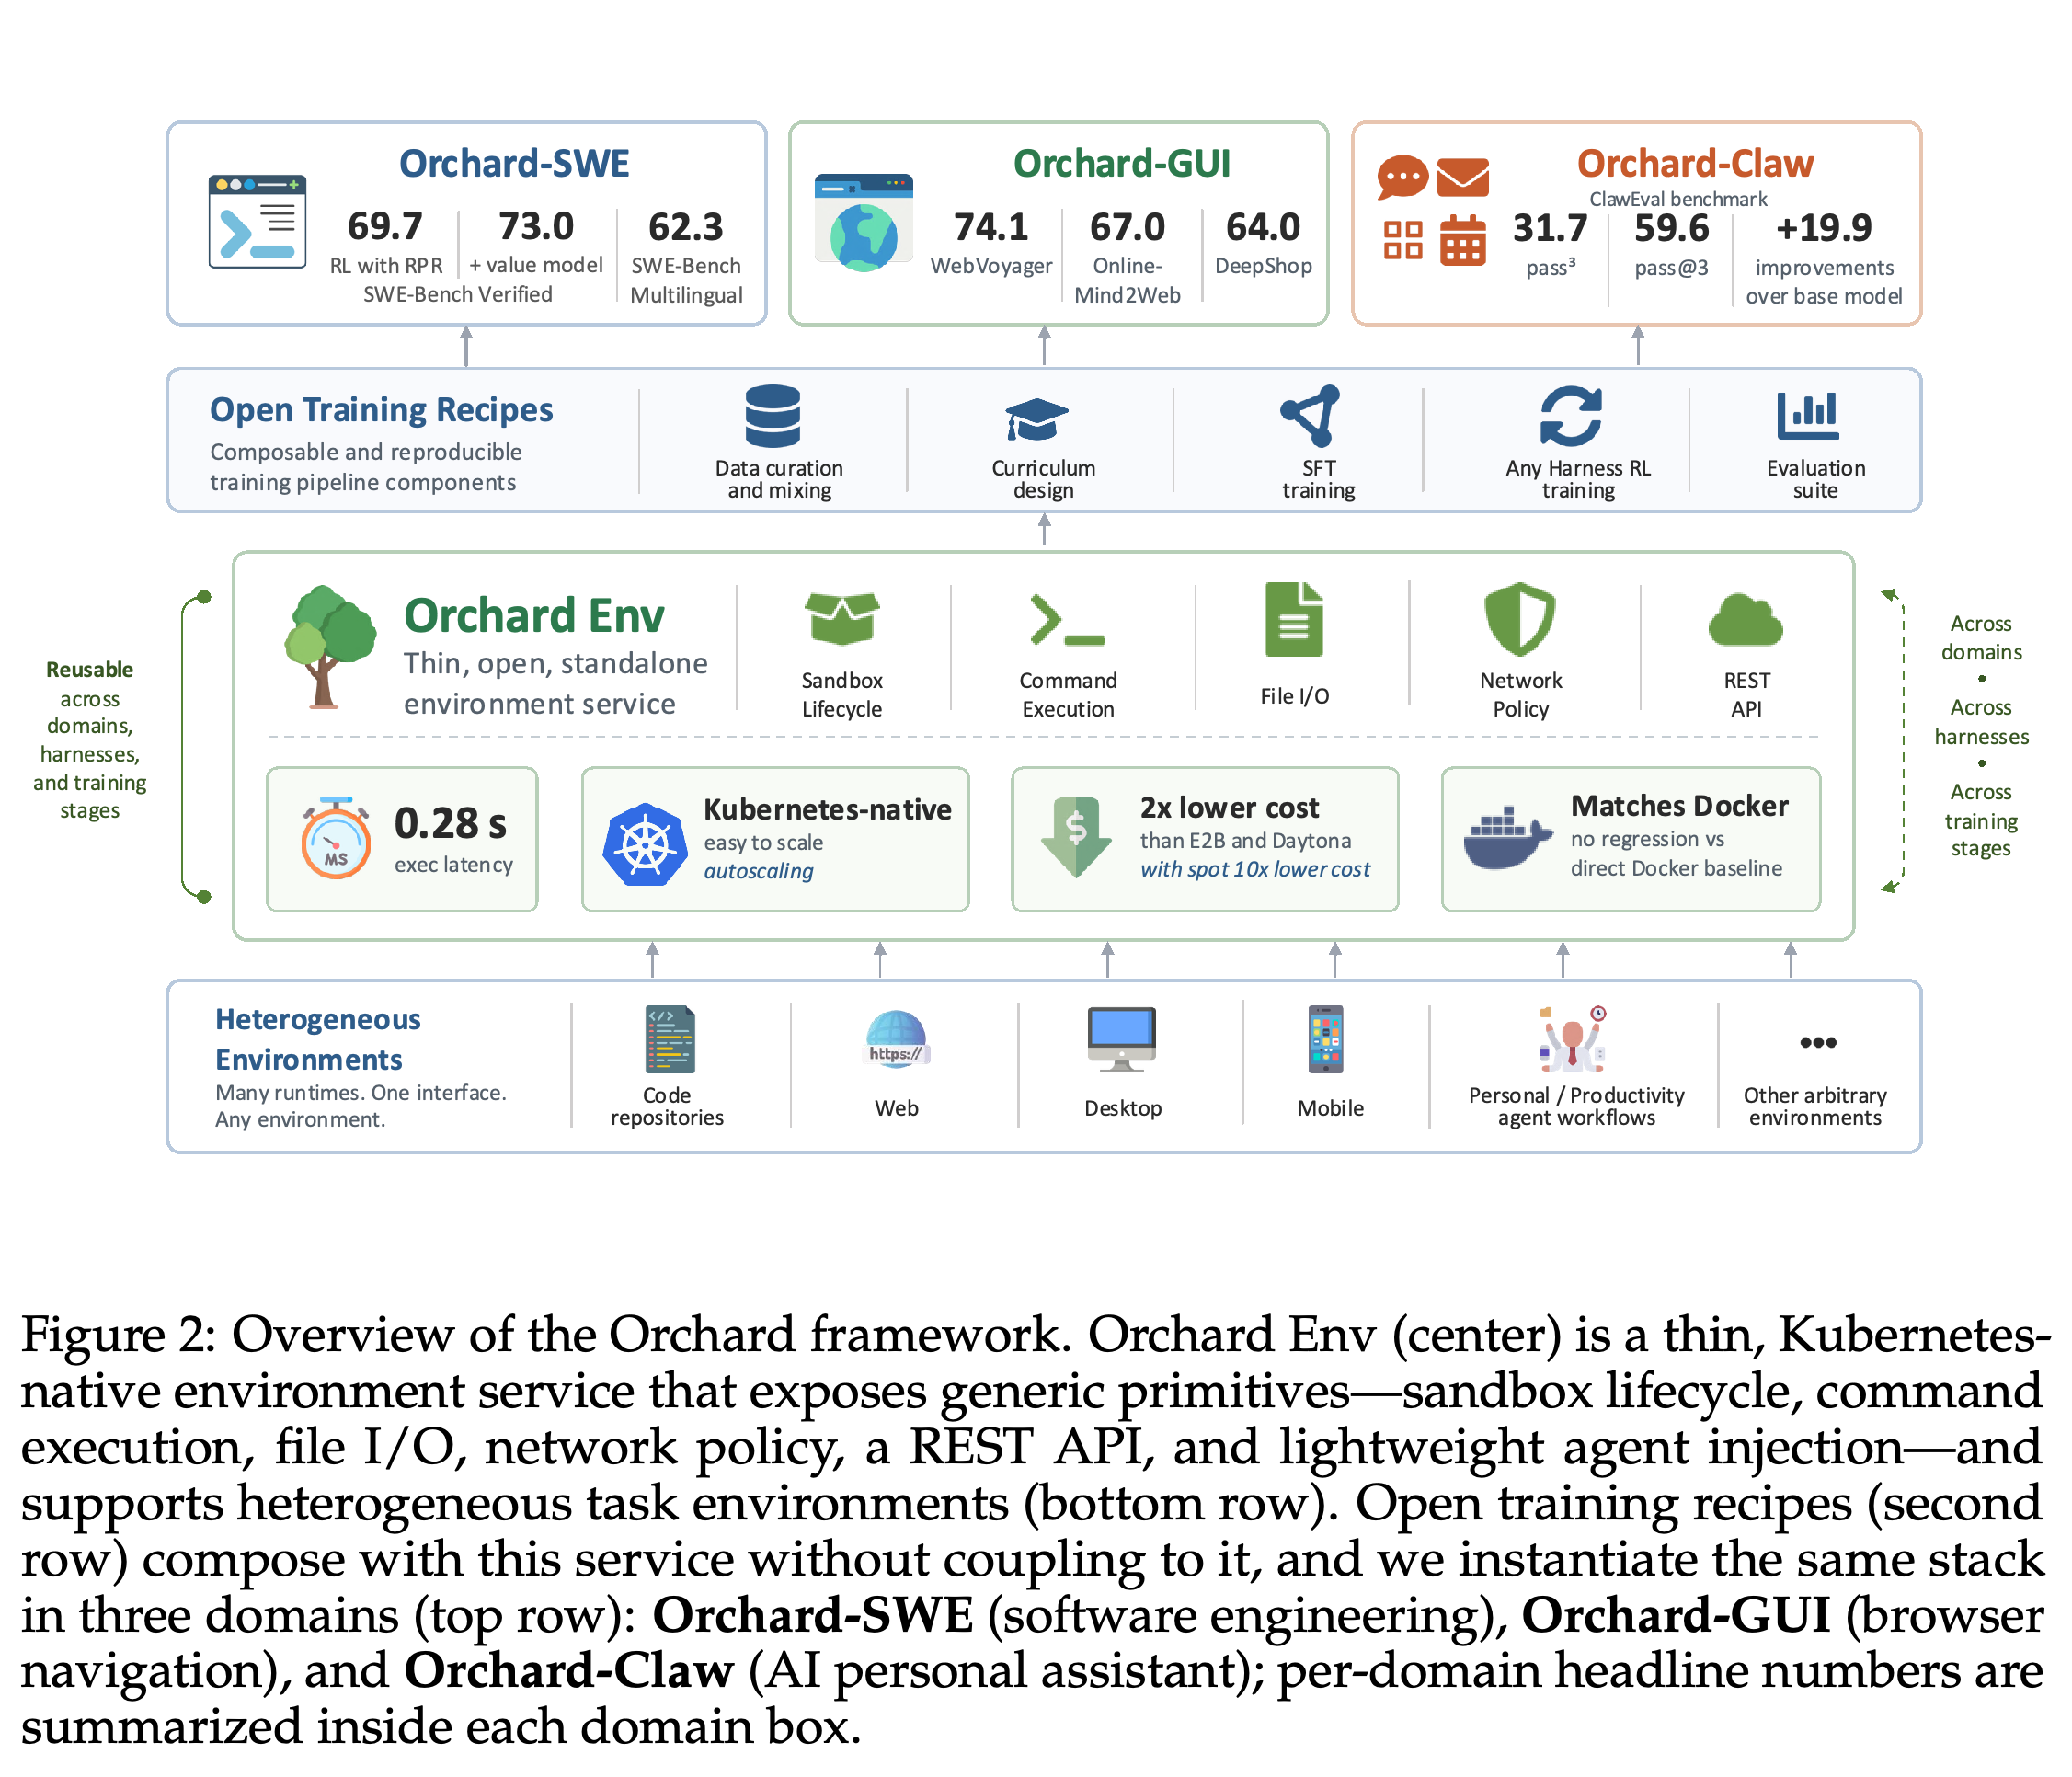
- Figure 2 separates heterogeneous environments, Orchard Env, composable training components, and three domain-specific agents. Desktop and mobile environments indicate architectural scope, not evaluated training domains. Its 62.3% SWE-bench Multilingual headline is not explained by Table 9, which reports 51.0% for Orchard-SWE-Qwen3.
- The authors state that they release the environment service, training recipes, and trajectory datasets for software engineering, browser navigation, and personal-assistant workflows.
The scatter plots place Orchard's SWE and GUI systems near much larger models on their respective benchmarks. They compare performance against total parameter count, but mix training recipes, harnesses, and inference procedures; the SWE value-model point includes multiple candidate rollouts.
The diagram places heterogeneous environments below Orchard Env and training components and domain agents above it, making the intended service boundary explicit. Desktop and mobile icons indicate architectural scope, not evaluated domains. The 62.3% Multilingual headline is not explained by the 51.0% Qwen3 result in Table 9.
2 Orchard Env
Orchard Env addresses three requirements: a thin standalone service boundary, compatibility with heterogeneous Docker images at low adaptation cost, and accessible deployment with practical costs at scale. Its API exposes environment operations without requiring a particular harness, inference backend, or trainer.
2.1 Architecture Overview
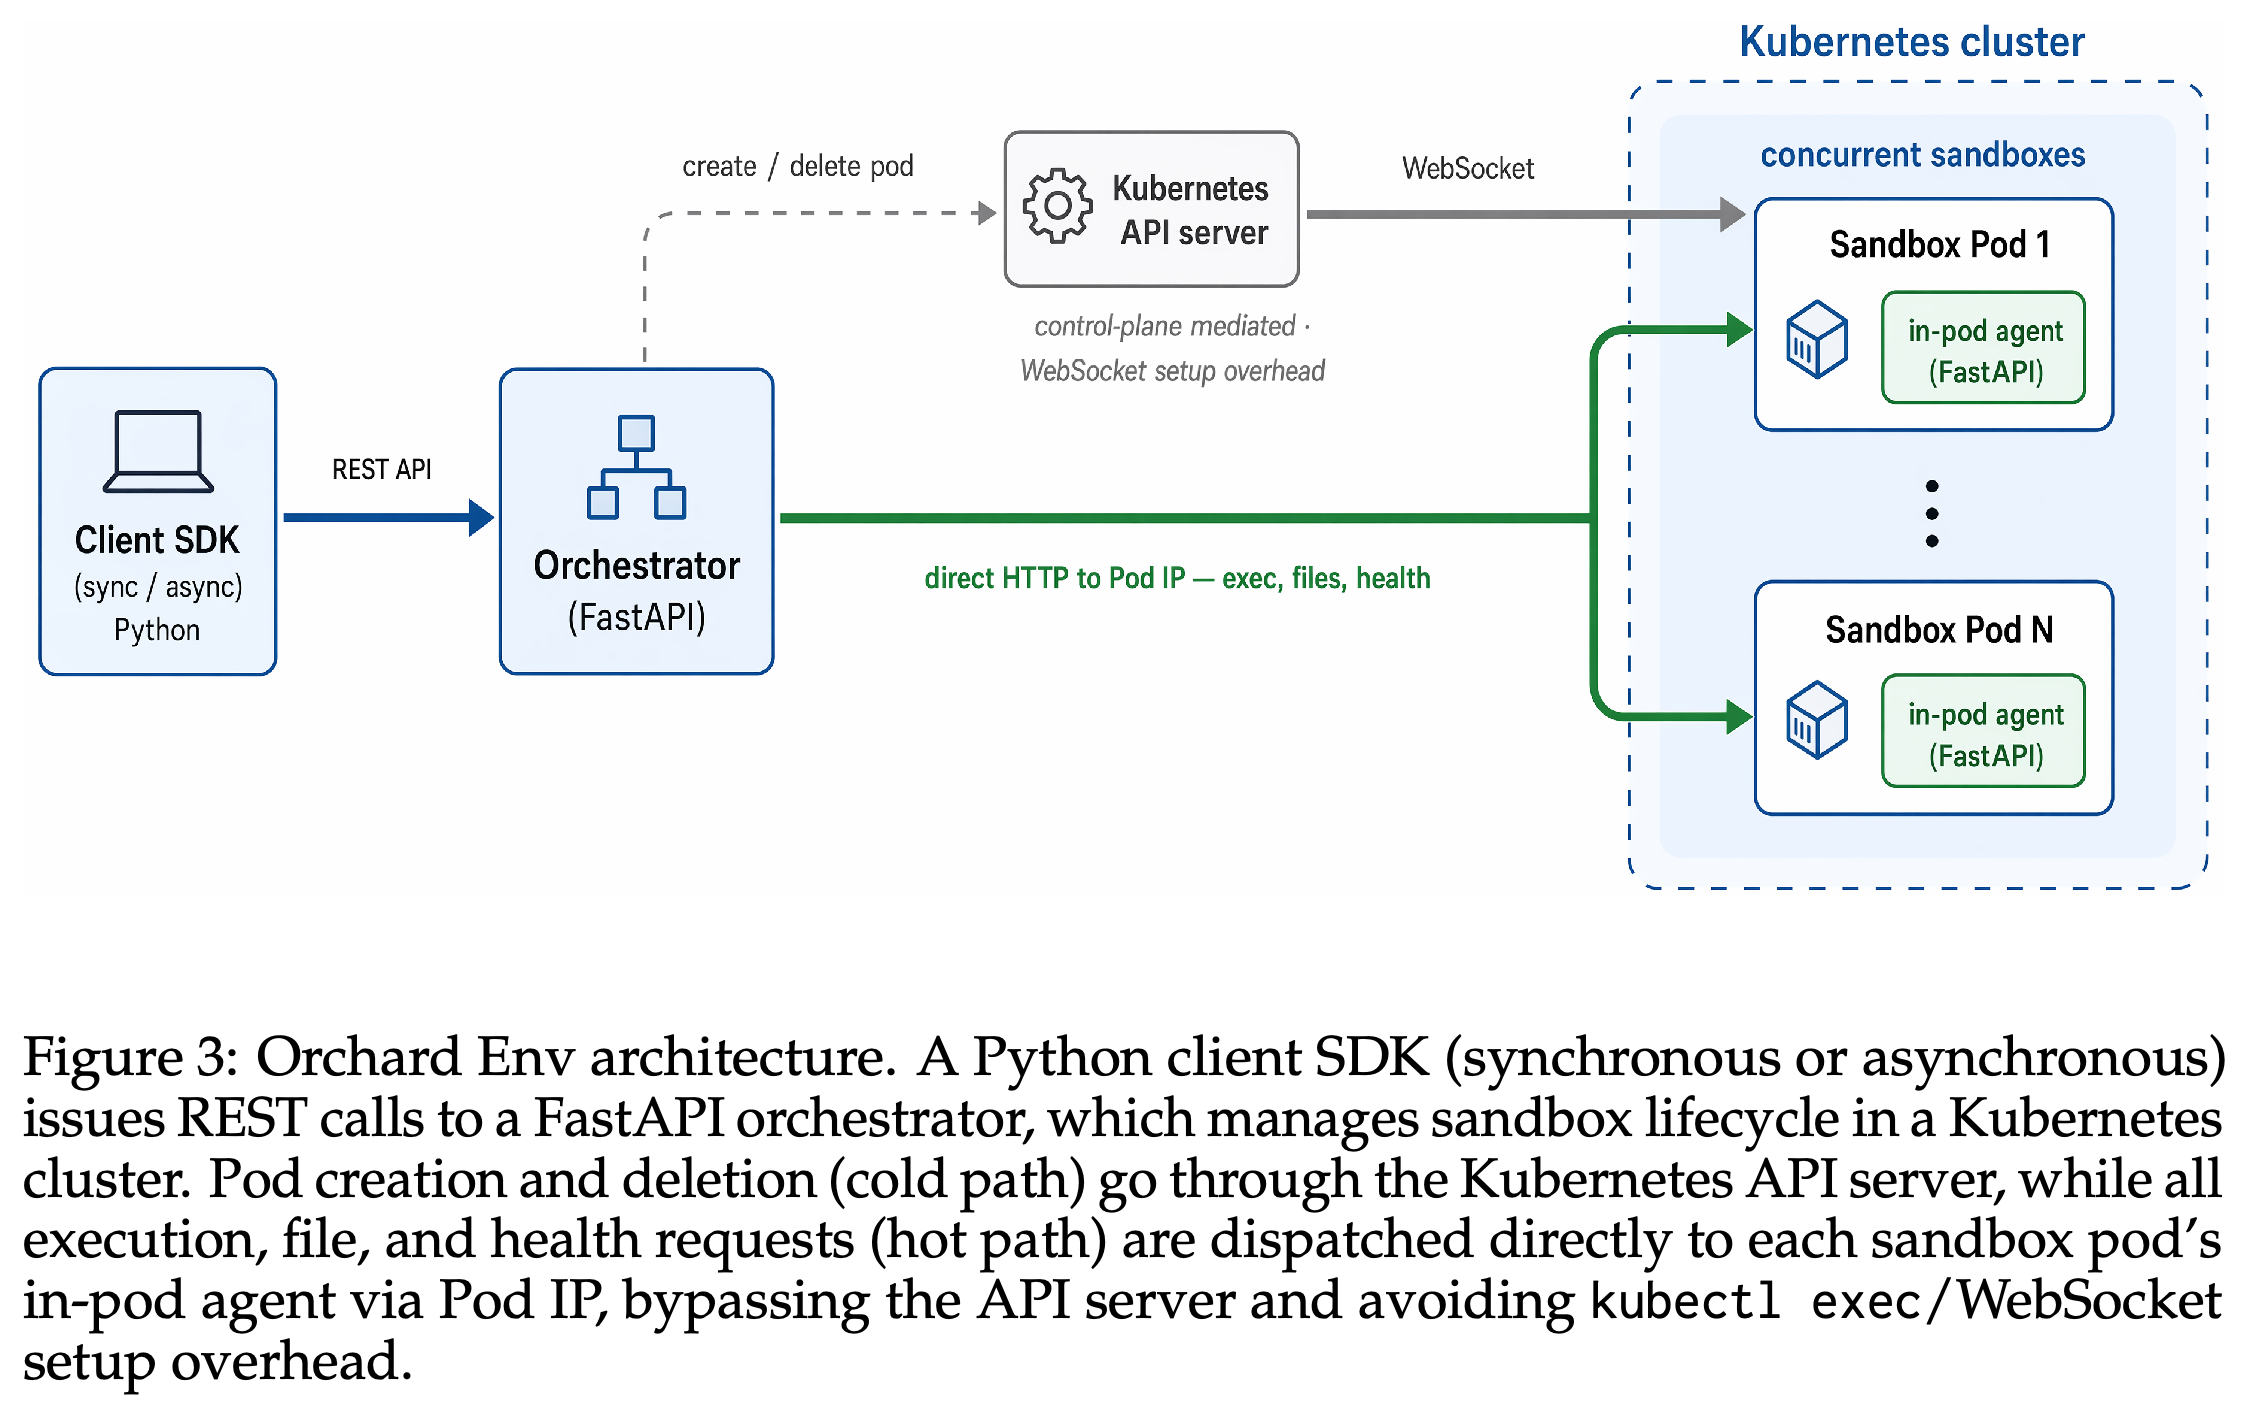
The architecture has three layers: synchronous or asynchronous Python clients, a FastAPI orchestrator, and a lightweight execution agent injected into each sandbox. Figure 3 distinguishes Kubernetes-mediated lifecycle operations from execution, file, and health requests routed directly to sandbox Pod IPs.
- SandboxClient and AsyncSandboxClient support user-specified images, command execution, file transfer, patch application, automatic cleanup, heartbeat utilities, and exponential-backoff retries.
- The orchestrator provisions Pods, tracks readiness through a persistent LIST+WATCH stream, serializes execution requests with per-sandbox locks, and reconciles expired or evicted sandboxes. An optional Redis backend shares metadata across replicas.
- The in-pod FastAPI agent executes subprocesses with configurable timeouts and kills the process tree on timeout. Runtime injection avoids rebuilding task images; execution agent here means the sandbox service, not the LLM policy.
The execution route bypasses the Kubernetes API server after provisioning, separating repeated interaction traffic from Pod lifecycle operations. It explains the latency-oriented design, but does not isolate that design's causal contribution through an ablation.
2.2 Comparison with Existing Systems
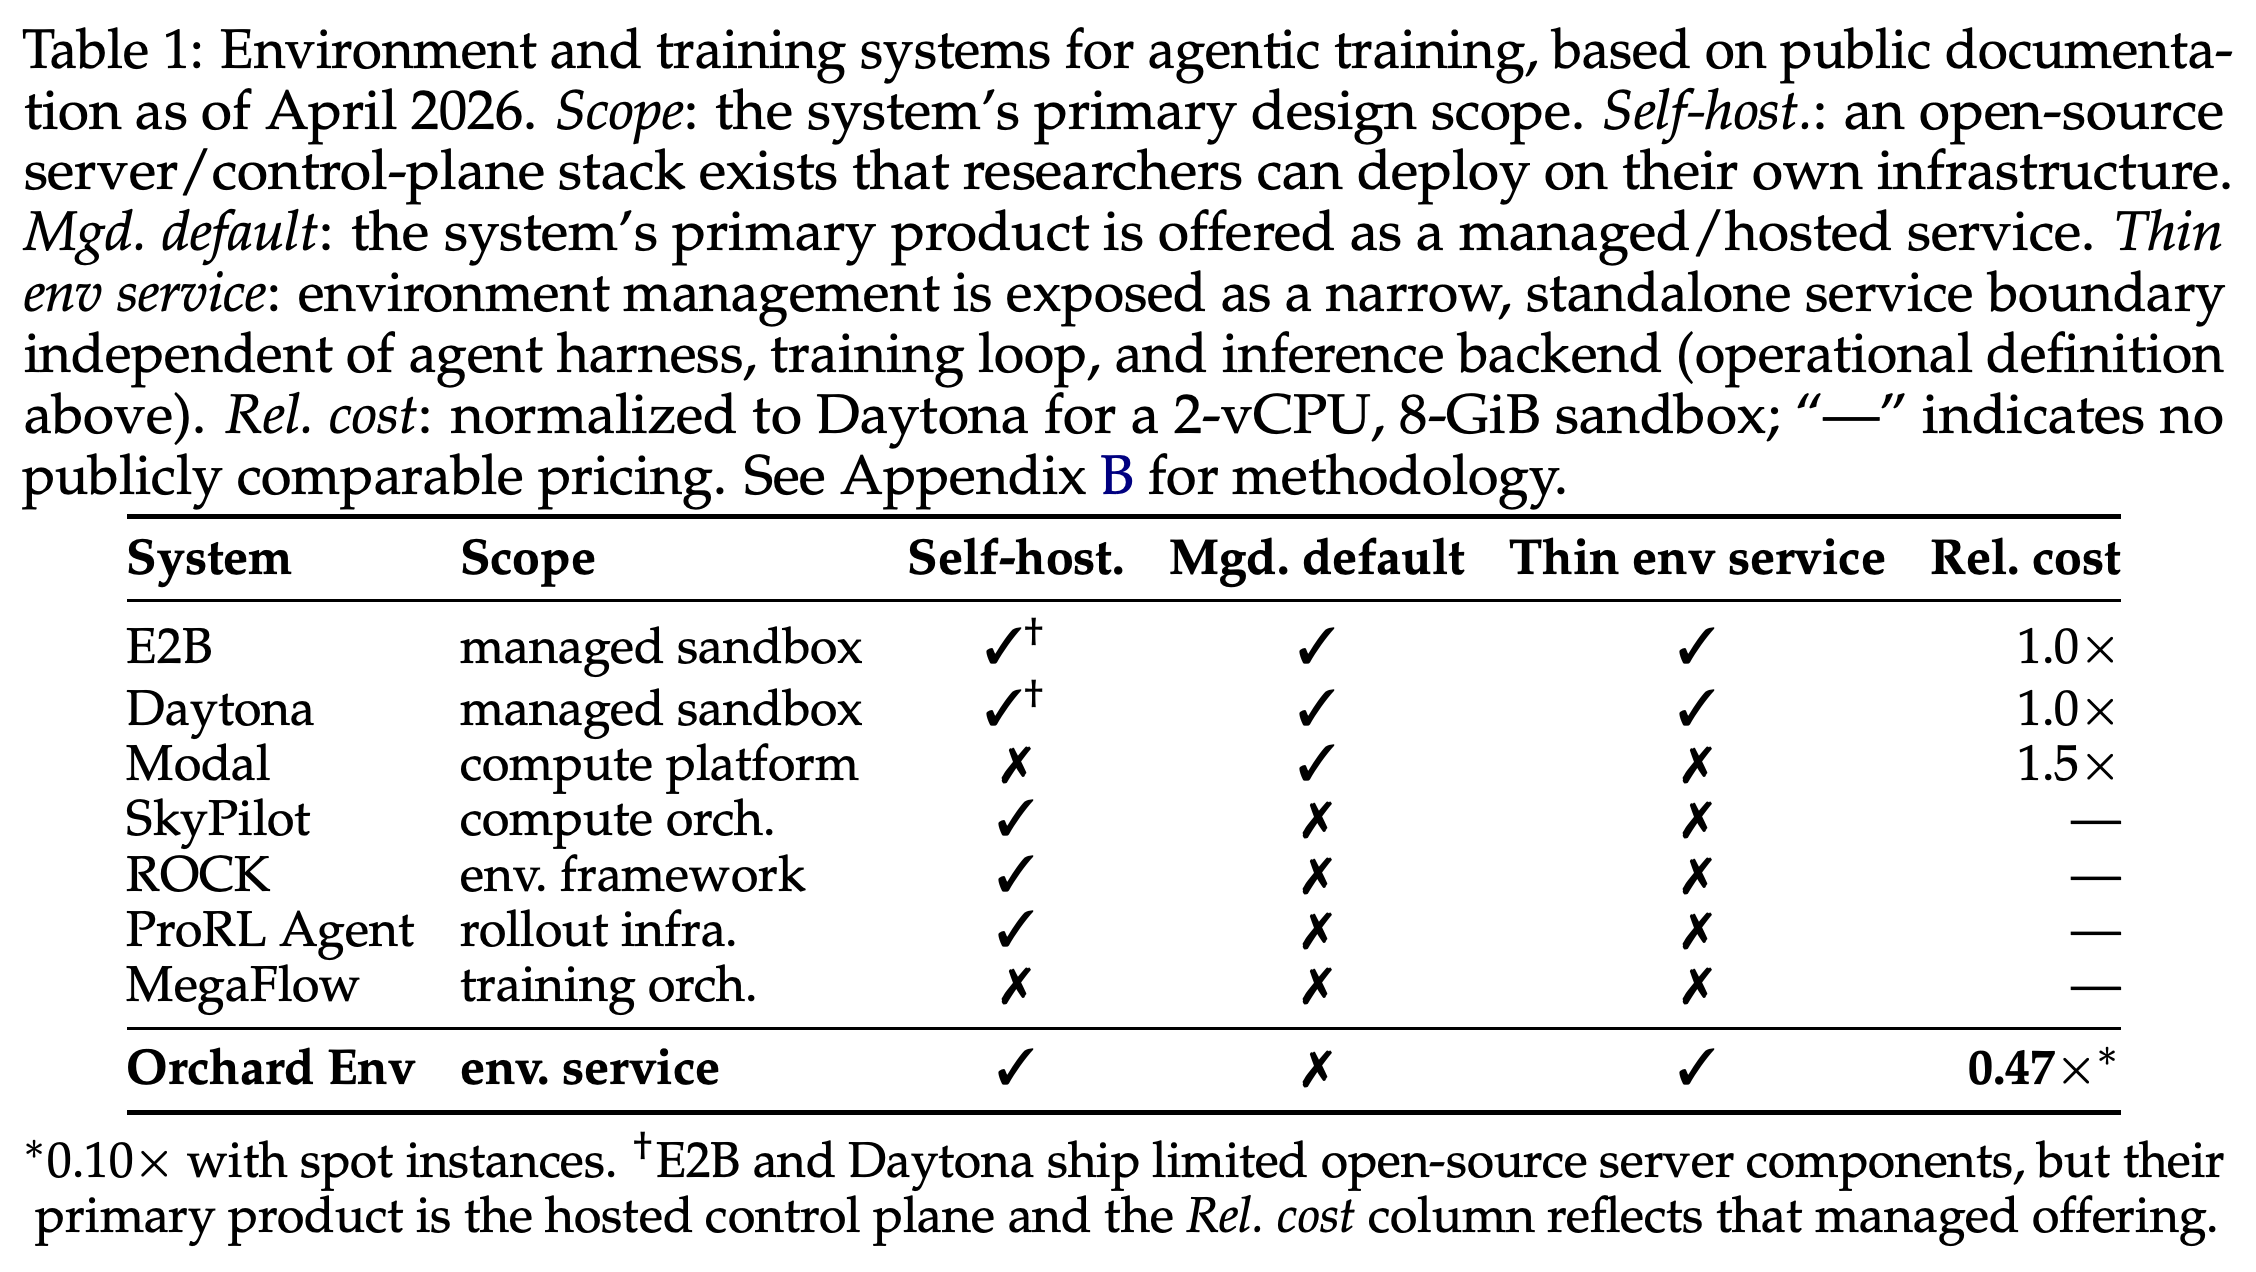
Table 1 positions Orchard Env as self-hostable, Kubernetes-native, and narrowly scoped to environments, contrasting it with managed sandboxes, broad compute platforms, and integrated training systems. The comparison uses public documentation as of April 2026 and defines a thin environment service as a stable environment API independent of harness, trainer, and inference choices.
- E2B and Daytona also expose standalone sandbox services, but the comparison prices their managed offerings. SkyPilot is described as complementary infrastructure rather than a competing environment layer.
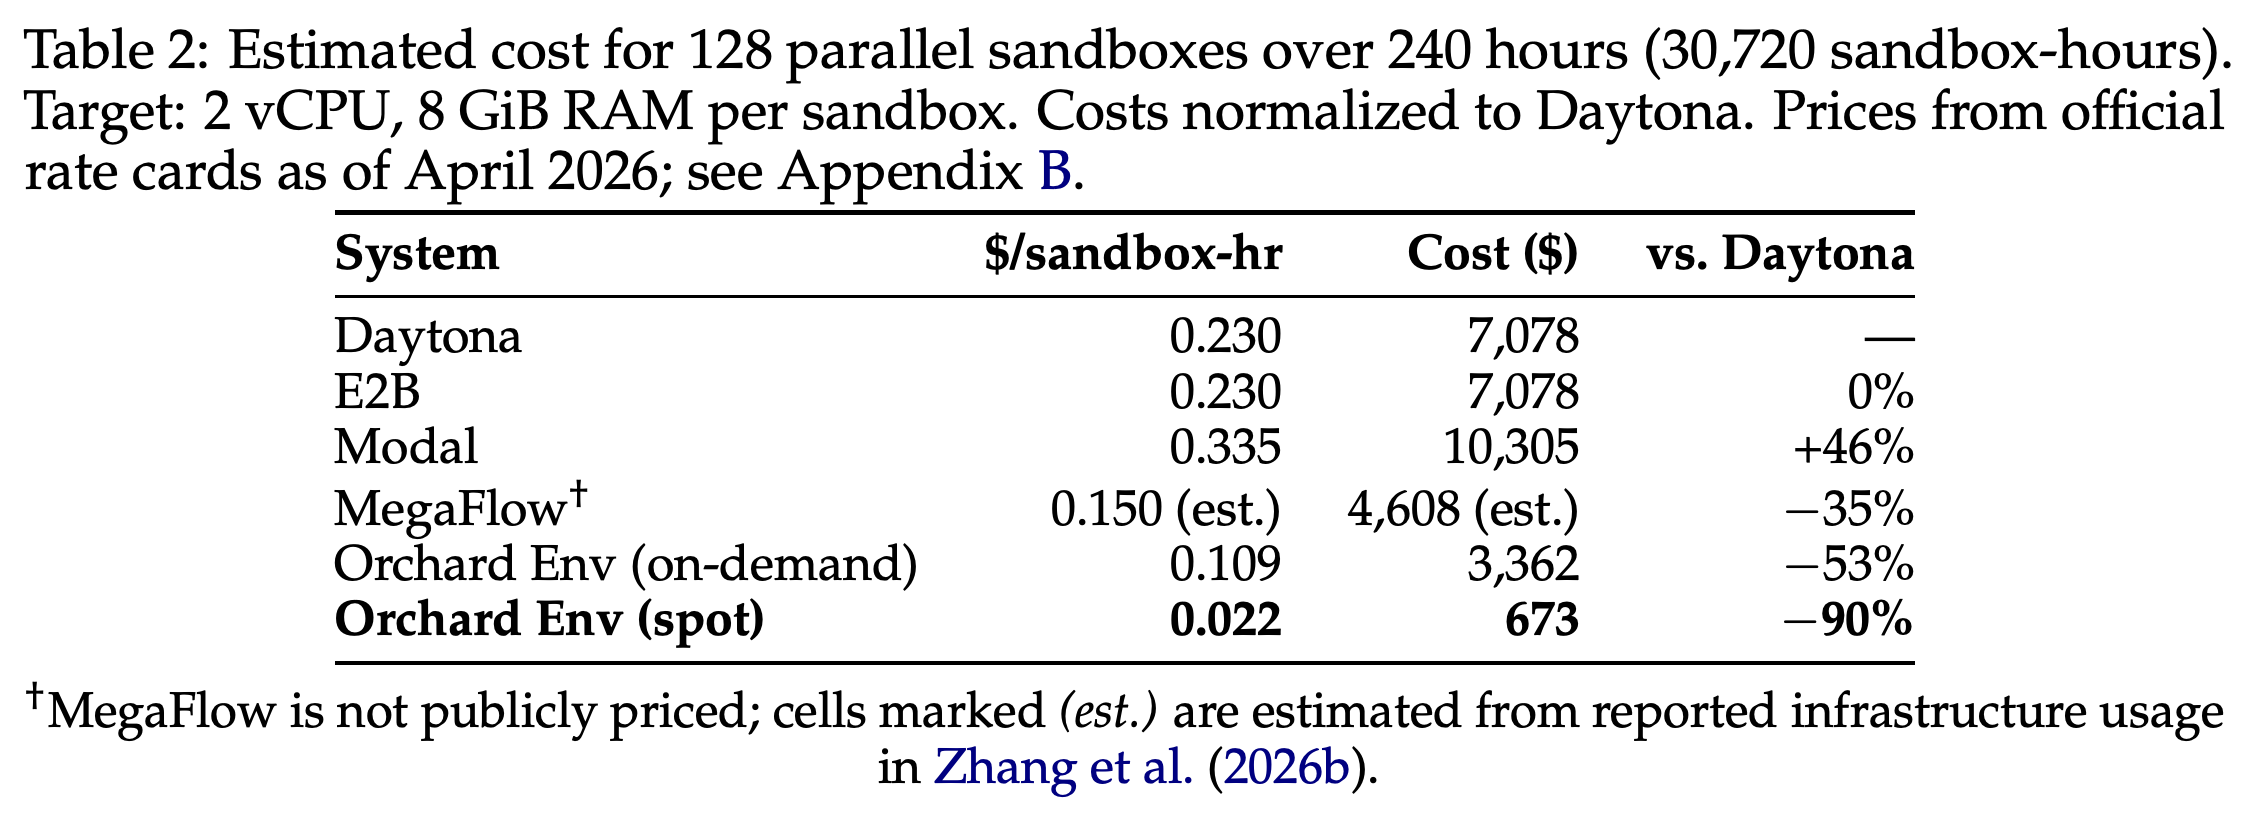
- Table 2 estimates costs for 128 parallel sandboxes, each with 2 vCPU and 8 GiB RAM, over 240 hours: $7,078 for Daytona or E2B, $10,305 for Modal, $3,362 for Orchard on-demand, and $673 for Orchard spot.
- These are sandbox infrastructure estimates, not complete agent-training costs. They depend on VM multiplexing, rate-card assumptions, and spot availability; MegaFlow’s $4,608 entry is estimated from reported infrastructure usage rather than public pricing, with a different per-task resource allocation.
The comparison distinguishes self-hostability, managed deployment, and a narrow environment API. Orchard's relative cost uses self-hosted deployment, while E2B and Daytona entries price their managed products, so deployment and operational responsibilities differ.
For 30,720 sandbox-hours, Orchard's reported $3,362 on-demand and $673 spot estimates are below the $7,078 managed-sandbox alternatives. The figures cover assumed sandbox infrastructure, not teacher generation, judging, model training, or inference; the spot total also differs from Appendix B's mixed-pricing setup.
2.3 System Evaluation
System evaluation measures execution latency, concurrency reliability, and downstream behavior relative to Docker. Unless otherwise noted, experiments use eight nodes with 32 vCPU and 128 GiB RAM each, pre-pulled images, and 2-vCPU, 8-GiB sandboxes.
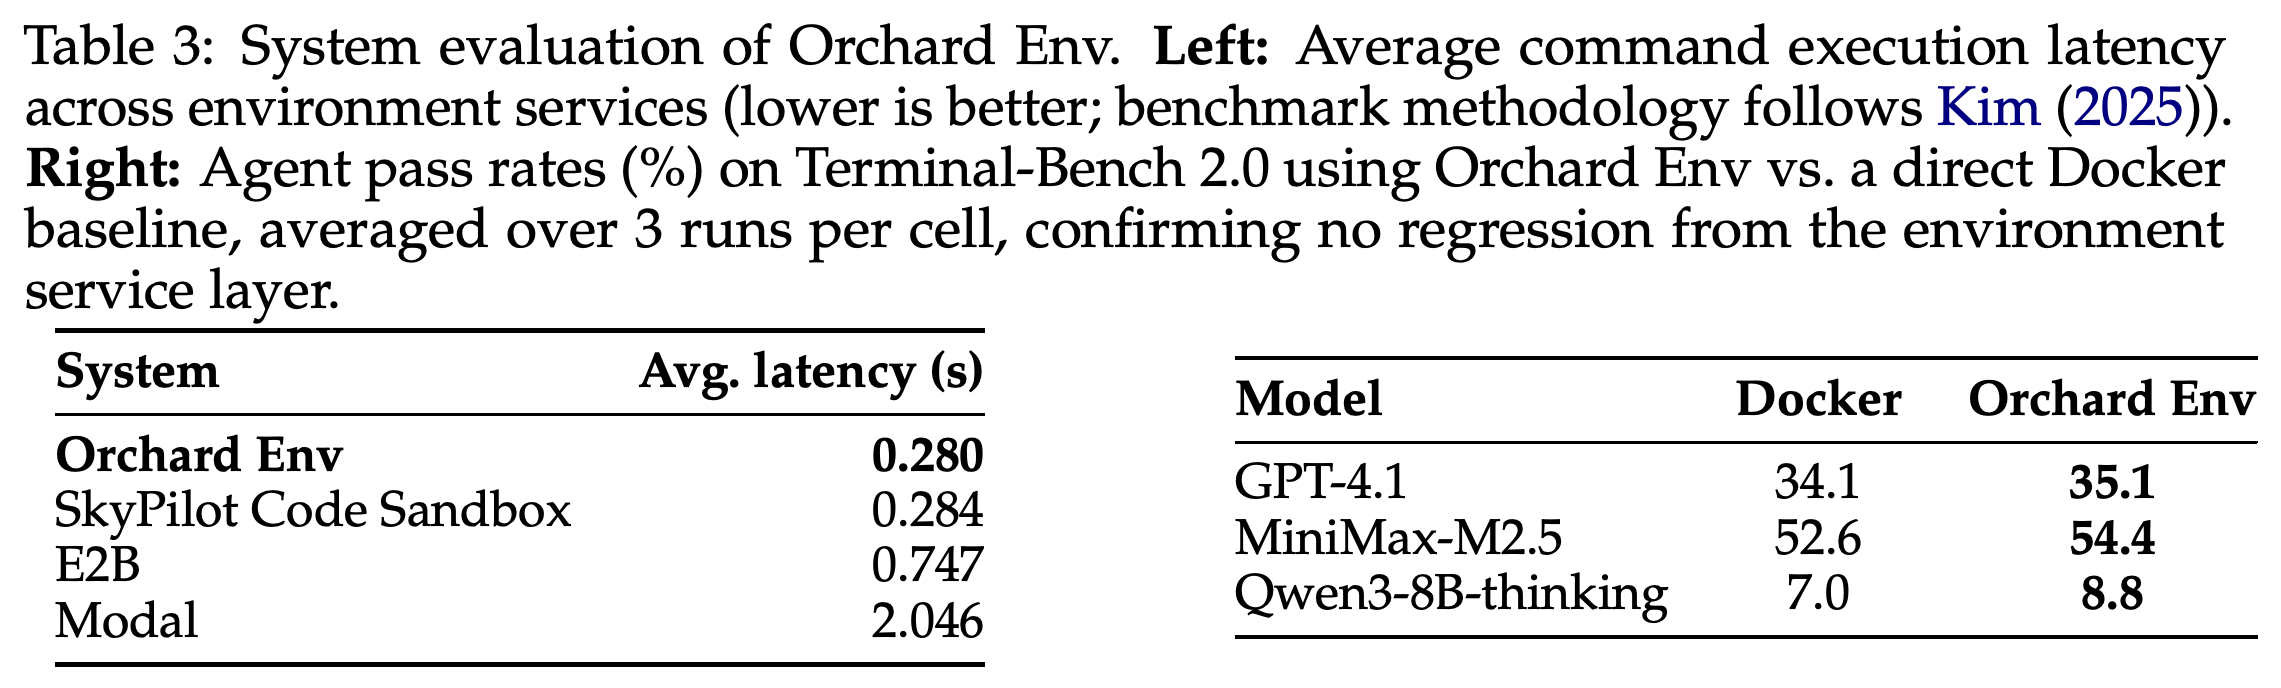
- Table 3 reports average execution latency of 0.280 s for Orchard Env, 0.284 s for SkyPilot Code Sandbox, 0.747 s for E2B, and 2.046 s for Modal. Direct Pod-IP routing avoids Kubernetes exec/WebSocket overhead, but no routing ablation isolates its contribution to the measured latency.
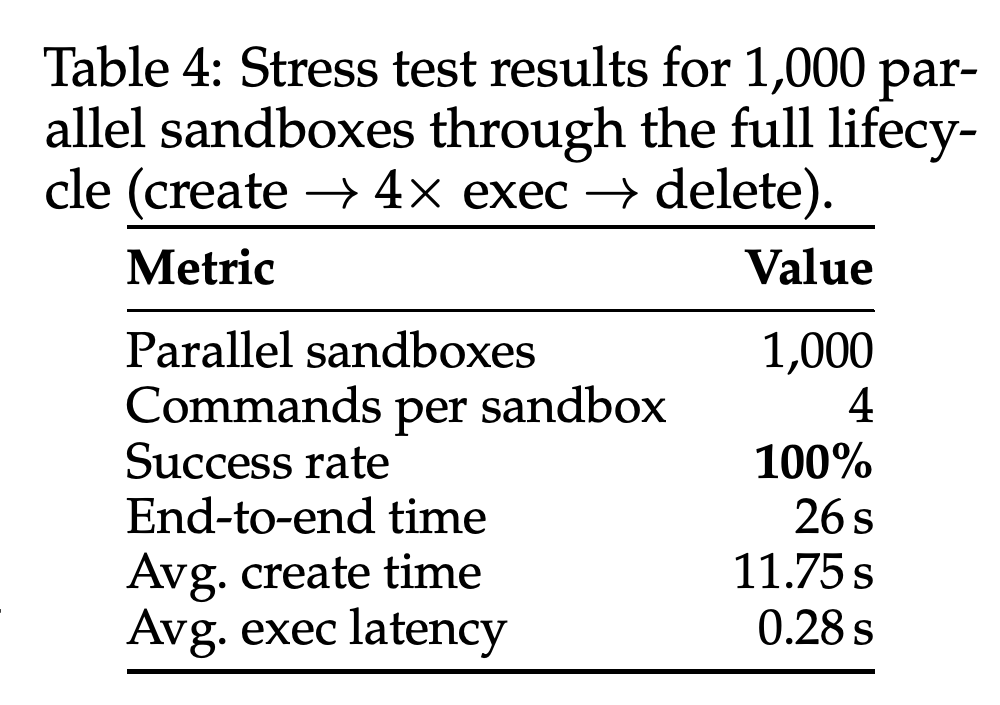
- Table 4 reports 100% success for 1,000 concurrent sandboxes executing create → four commands → delete in 26 s, with 11.75 s average creation time and 0.28 s average execution latency. This tests a short lifecycle workload, not sustained heterogeneous training or spot-preemption recovery.
- On Terminal-Bench 2.0, three-run mean pass rates for Docker versus Orchard Env are 34.1% versus 35.1% for GPT-4.1, 52.6% versus 54.4% for MiniMax-M2.5, and 7.0% versus 8.8% for Qwen3-8B-thinking. No regression is observed in these means; uncertainty intervals establishing statistical equivalence are not reported.
Orchard's 0.280 s mean execution latency nearly matches SkyPilot's 0.284 s. The Docker comparison shows slightly higher three-run mean pass rates for Orchard across three models, with no observed regression but no reported confidence intervals establishing equivalence.
All 1,000 sandbox sessions complete creation, four commands, and deletion in 26 s. This establishes reliability for a short burst workload with pre-pulled images, not long-running robustness across all training conditions.
3 Orchard-SWE
Orchard-SWE instantiates the framework for repository-level issue resolution using teacher-distilled SFT followed by environment-grounded RL. Both stages use Orchard Env, while the learning methods address limited supervision, sparse outcome rewards, and reuse of historical rollouts.
3.1 Problem Setting
A SWE task supplies a GitHub issue and repository snapshot; the agent must submit a patch that passes the associated gold test suite. The primary benchmark is SWE-bench Verified, comprising 500 human-validated instances, with auxiliary evaluations on SWE-bench Multilingual and Terminal-Bench 2.0.
- The ReAct-style agent alternates reasoning, tool invocation, and environment feedback using shell execution, file inspection and editing, and patch submission.
- Each task runs in a task-specific Docker image with 2 vCPU and 8 GiB memory. Collection uses both OpenHands and mini-swe-agent to expose different tool semantics and interaction conventions.
3.2 Trajectory Collection and Curation
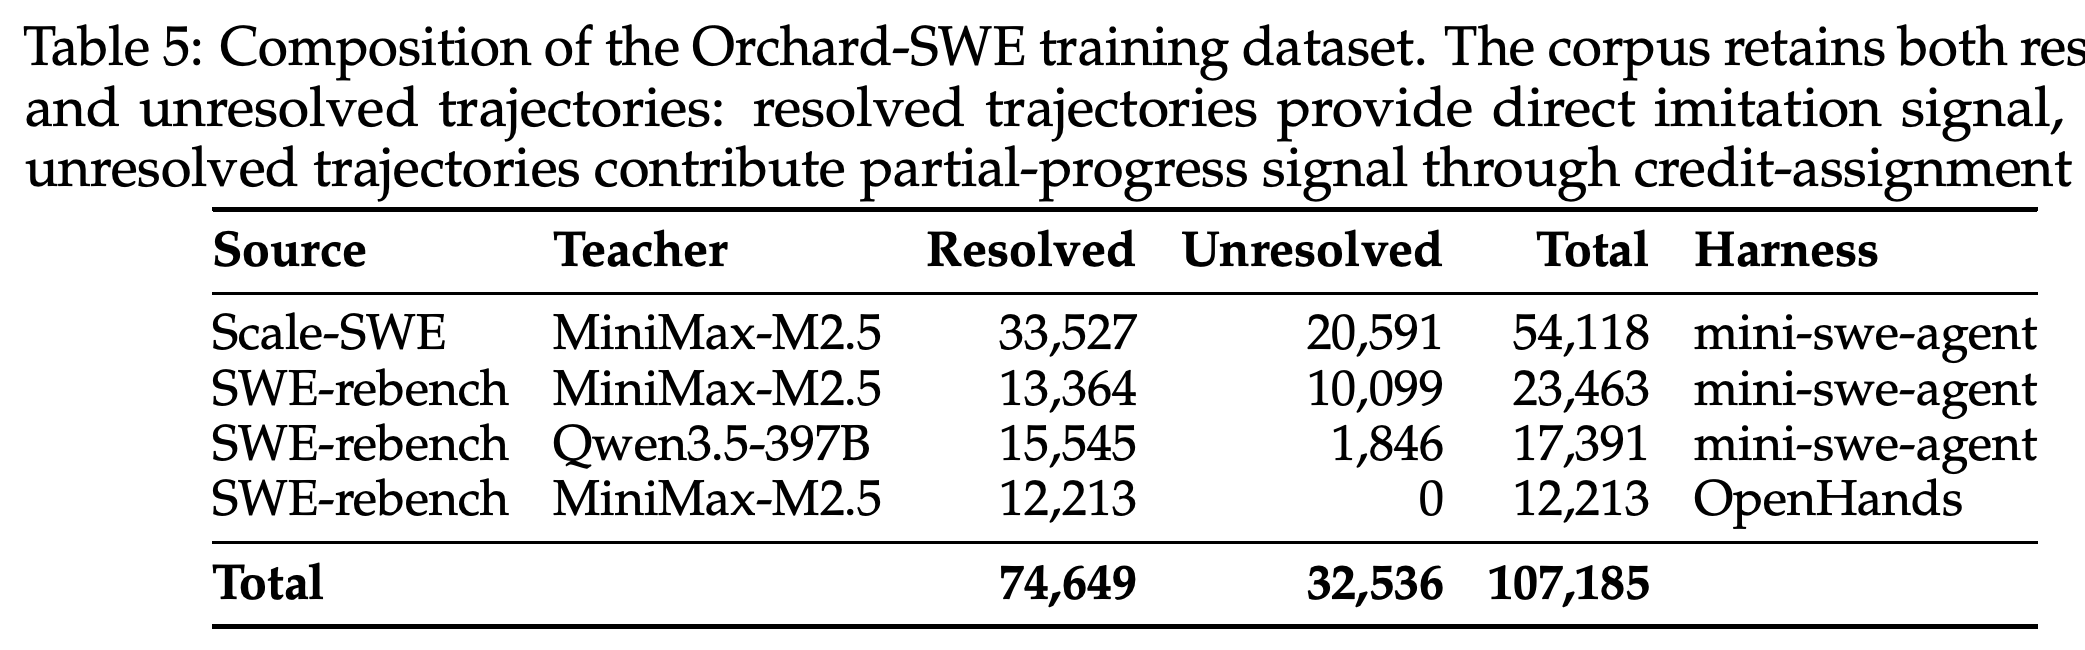
The SWE corpus contains 107,185 trajectories across 19,287 unique task instances: 74,649 resolved and 32,536 unresolved trajectories. Table 5 details contributions from SWE-rebench and Scale-SWE, generated with MiniMax-M2.5 and Qwen3.5-397B under mini-swe-agent or OpenHands.
- Scale-SWE contributes 54,118 MiniMax-M2.5 trajectories; SWE-rebench contributes 23,463 MiniMax-M2.5 and 17,391 Qwen3.5-397B trajectories under mini-swe-agent, plus 12,213 resolved MiniMax-M2.5 trajectories under OpenHands.
- SWE-rebench V2 is reserved for RL; experiments primarily use its Python tasks despite the source covering 20 programming languages. Teacher collection samples five trajectories per task, and the curated corpus retains failed traces for partial-progress supervision.
- Curation prunes trajectories exceeding 64K tokens and removes undefined, invalid, or unparsable tool calls. The final corpus averages 47.5 interaction turns and approximately 21K tokens per trajectory.
The corpus combines teachers, sources, and two harnesses, with failed trajectories accounting for 32,536 of 107,185 examples. OpenHands contributes only resolved examples in the breakdown, while failed-trace supervision comes from mini-swe-agent collections.
3.3 Off-policy Learning: Supervised Fine-Tuning with credit assignment
Credit-assignment SFT retains productive actions from unresolved trajectories instead of discarding the entire trace. A trajectory’s teacher retrospectively estimates V(s_t) = P(resolve | h_t, outcome), assigns temporal-difference credit c_t = V(s_{t+1}) − V(s_t), and extracts maximal contiguous rise segments satisfying c_t ≥ ε, with ε = 0.05.
- The action-token objective is L_SFT = −∑_{t∈S(τ)} log π_θ(a_t | h_t). Resolved trajectories supervise all action tokens; unresolved trajectories supervise only extracted rise segments, retaining earlier history as context and masking environment observations.
- Teachers annotate sparse key steps and interpolate the remainder. The reported 98.9% inverted-U value curves are not independent calibration evidence: the appendix prompt explicitly requests rising values during correct exploration and declining values before the known failure.
- Qwen3-30B-A3B-Thinking is trained with slime for five epochs, global batch size 128, a 64K context window, and cosine-decayed learning rate from 10⁻⁵ to 10⁻⁶. Inference context is extended to 128K.
3.4.1 Reinforcement Learning with Balanced Adaptive Rollout (BAR)
The on-policy stage separates rollout sampling from reward design. Balanced Adaptive Rollout (BAR) assembles a fixed-size training group with a target positive-reward fraction, seeking informative group-relative updates rather than groups dominated by all-success, all-failure, or imbalanced outcomes.
- Algorithm 1 generates trajectories in strides, partitions usable positive and negative outcomes, and attempts to select exactly N trajectories near the midpoint of [ρ_min, ρ_max]. It prefers well-terminated, concise trajectories and uses relaxed or best-effort selection when the budget is exhausted; a subsequent group filter rejects groups without usable learning signal.
- The reported configuration uses N = 8, N_max = 16, stride s = 16, and [ρ_min, ρ_max] = [0.375, 0.625]. Because stride equals the maximum budget, this experiment does not test multi-stride early stopping; balancing and filtering still apply.
- Group-relative advantage is A_{i,t} = (r_i − mean({r_1,…,r_N}))/std({r_1,…,r_N}). RL runs for at most 150 steps with global batch size 128, 64K context, and cosine-decayed learning rate from 10⁻⁶ to 10⁻⁷.
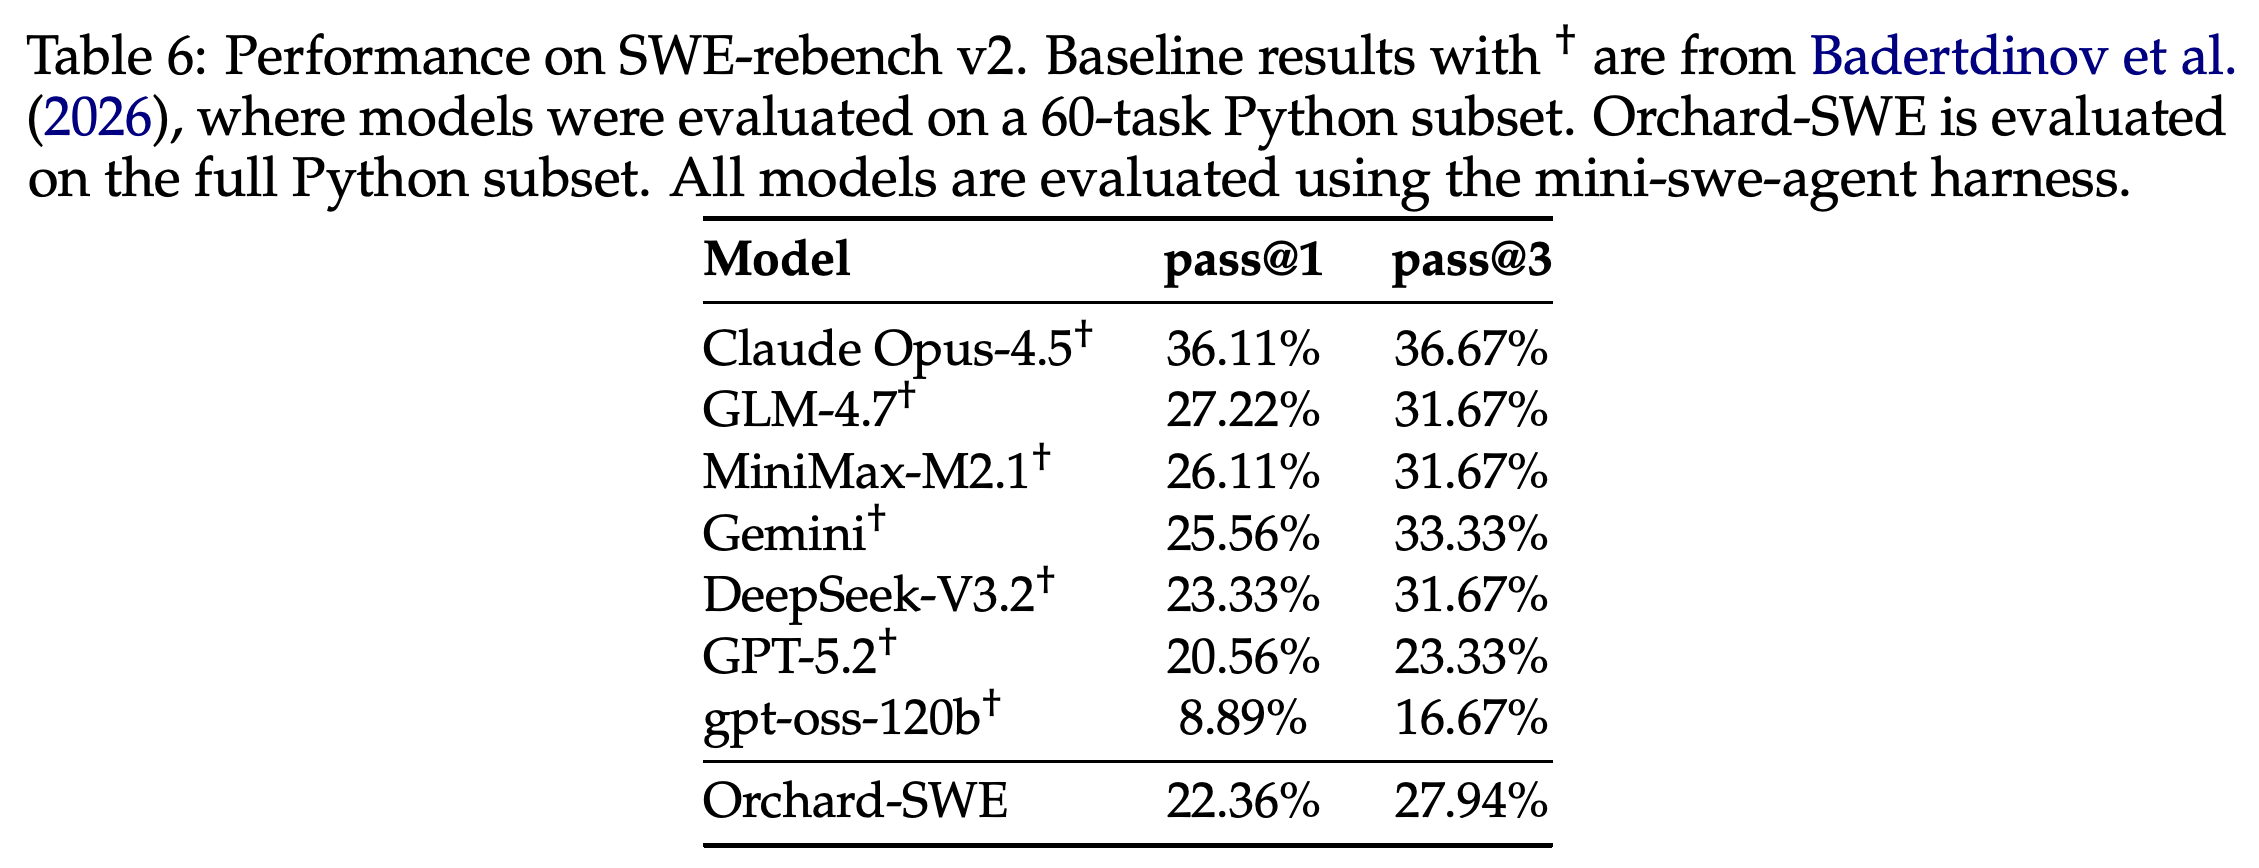
- Candidate RL tasks are evaluated with eight initial rollouts and retained when 0 < p̂ ≤ 0.5, yielding approximately 2K instances from SWE-rebench V2 and unused Scale-SWE tasks. Table 6 reports 22.36% pass@1 and 27.94% pass@3 on the full Python subset, whereas cited frontier baselines use a 60-task subset and are not directly matched comparisons.
The initial Orchard checkpoint scores 22.36% pass@1 and 27.94% pass@3 on the full Python subset. Cited frontier results use a 60-task subset, so the entries do not establish a matched model ranking.
3.4.2 Denser Reward: On Policy Distillation (OPD)
On Policy Distillation (OPD) supplies token-level guidance on student-generated trajectories using Qwen3.5-397B-A17B as teacher and Qwen3.5-35B-A3B as student. The paper compares reverse-KL sample estimators with a Jensen–Shannon (JS) surrogate and combines the latter with outcome-reward GRPO without BAR.
- The reverse-KL objective is D(π_θ || π_teacher) = E_{π_θ}[log π_θ − log π_teacher]. K2 is one-half the squared log-probability difference, while the stabilized K3 variant multiplies K3 by π_θ/sg(π_θ), where sg denotes stop-gradient.
- The JS surrogate is sg(log(π_θ/(λπ_θ + (1 − λ)π_teacher))) log π_θ, with λ = 0.5. The mixture distribution moderates extreme student–teacher probability mismatches.
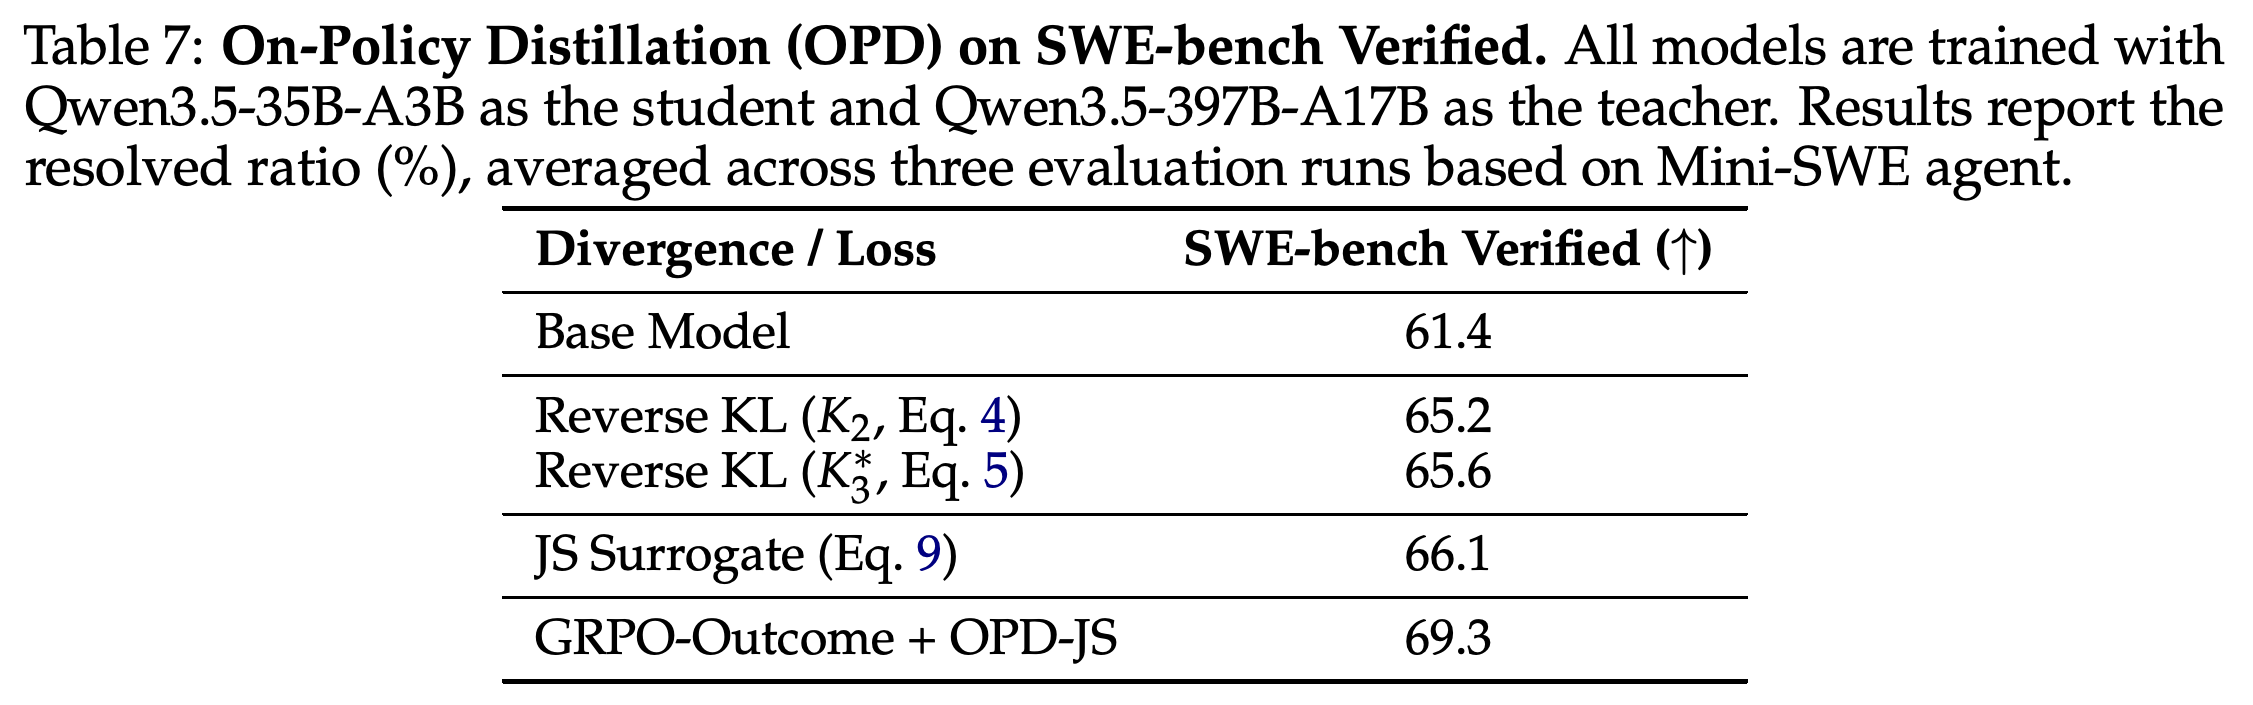
- Table 7 reports three-run SWE-bench Verified means of 61.4% for the base, 65.2% for K2, 65.6% for stabilized K3, 66.1% for JS alone, and 69.3% for GRPO-Outcome + OPD-JS.
- The authors report fewer gradient spikes and lower rollout cost, but provide no numerical cost comparison. The combined 69.3% condition includes outcome supervision, despite a later passage describing OPD as dispensing with outcome-verification rollouts.
All three distillation losses improve the 61.4% base score, with JS alone reaching 66.1%. The highest result, 69.3%, combines JS distillation with outcome-reward GRPO and is not teacher-only training.
3.4.3 Denser Reward: Rubric-based Process Reward (RPR)
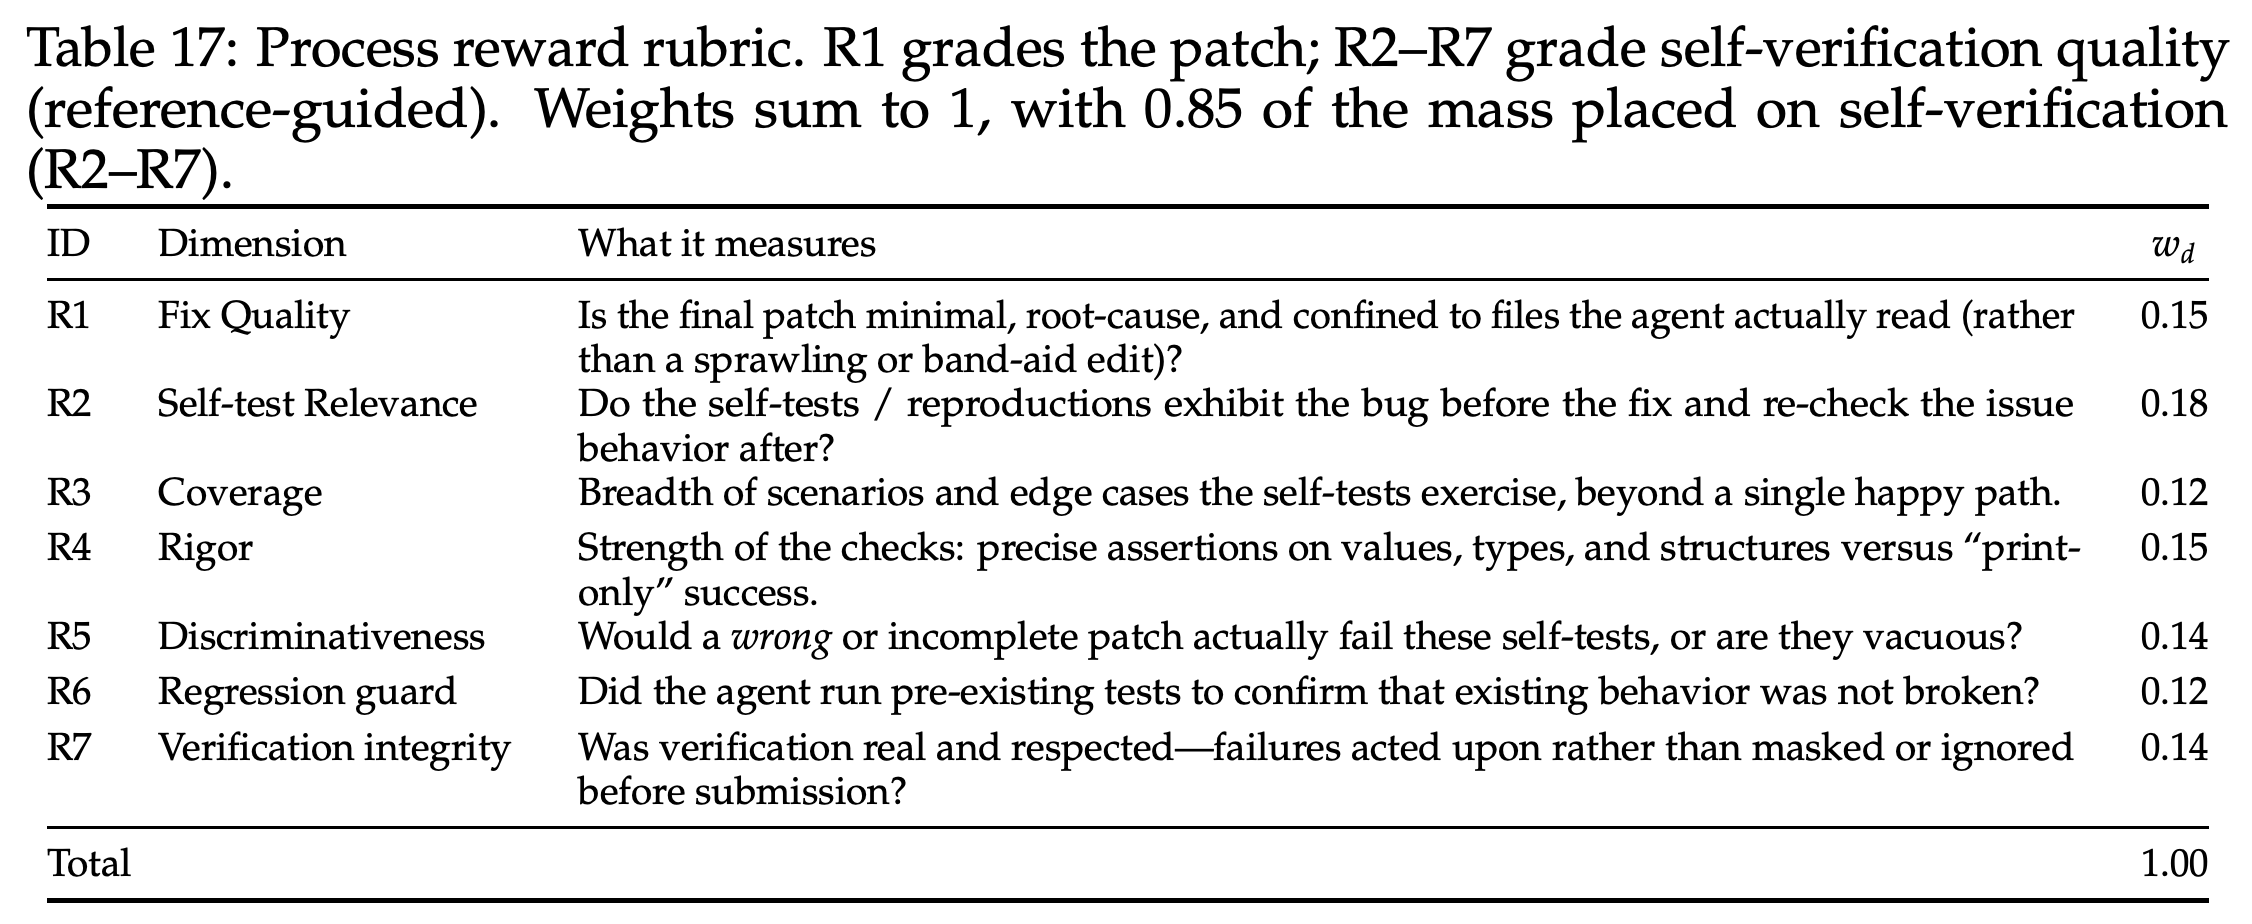
Rubric-based Process Reward (RPR) scores verification behavior across the complete trajectory, addressing process quality left unspecified by binary patch correctness. Its LLM judge evaluates seven dimensions independently and combines them into a scalar reward in [0, 1], with 0.85 of the weight assigned to self-verification rather than patch quality.
- Table 17 assigns weights of 0.15 to Fix Quality, 0.18 to Self-test Relevance, 0.12 to Coverage, 0.15 to Rigor, 0.14 to Discriminativeness, 0.12 to Regression guard, and 0.14 to Verification integrity.
- An optional reference block supplies official FAIL_TO_PASS identifiers and the gold patch only to ground self-test relevance, coverage, and discriminativeness. The grading instructions prohibit exact-edit matching and penalizing an agent merely for not running hidden tests.
- Penalties target responses to evidence—such as ignoring a failure or submitting without verification—not the presence of tracebacks during exploration. Long observations are compressed head-and-tail, while large file or directory dumps may be replaced by size markers.
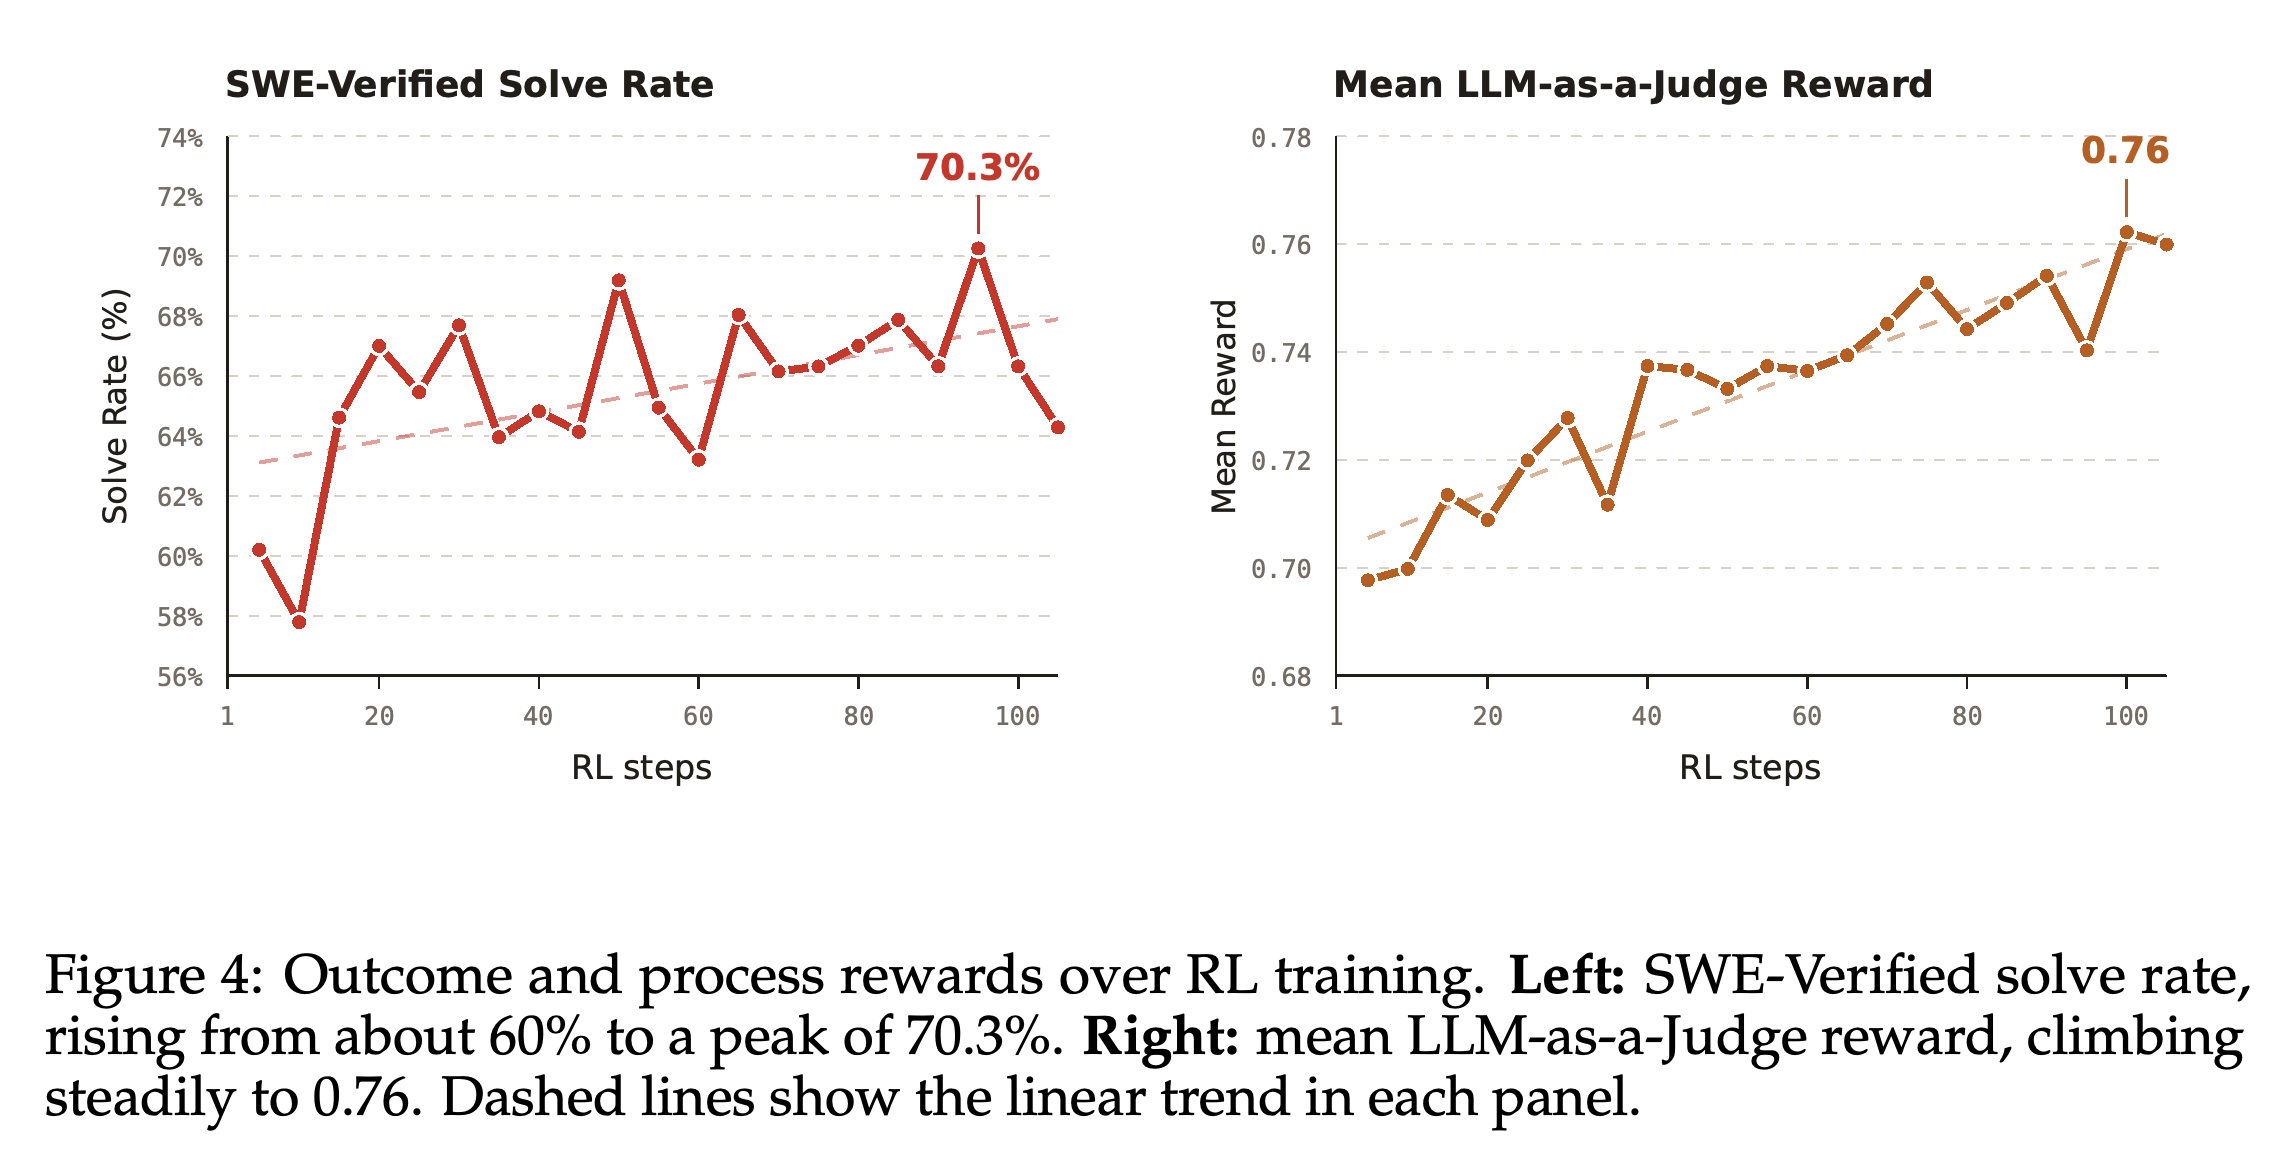
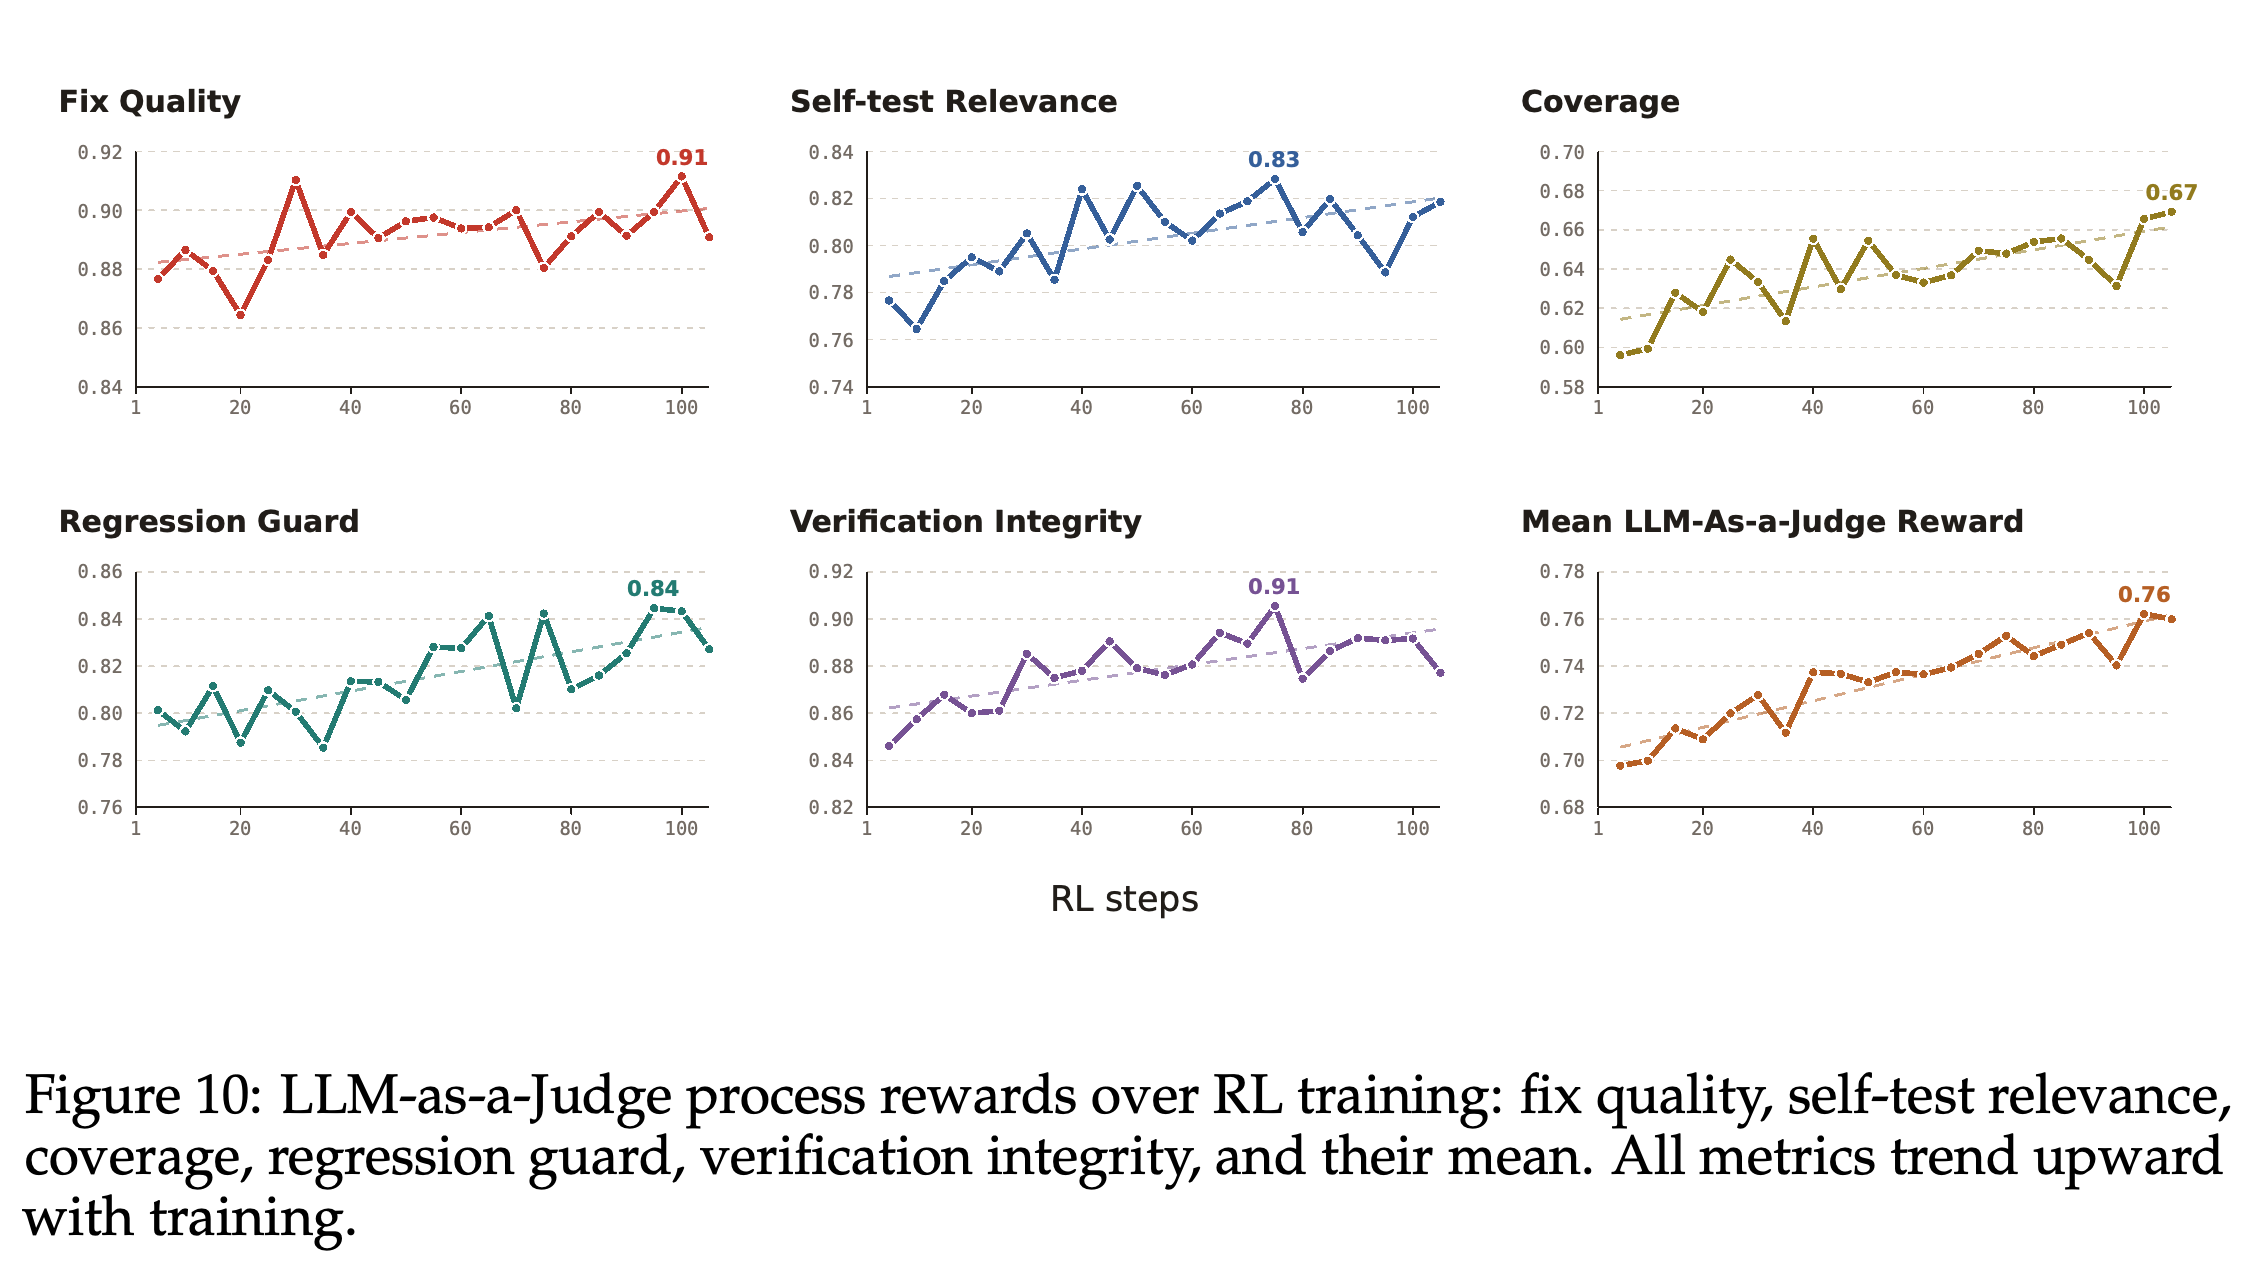
- Figure 4 shows a fluctuating solve-rate curve peaking at 70.3% alongside mean judge reward reaching 0.76; this peak differs from the three-run 69.7% result. Figure 10 shows upward trends in selected rubric scores, which measure judge-assessed process quality rather than independently verified behavioral reliability.
Judge reward improves more smoothly than solve rate, which fluctuates and peaks at 70.3%. Both fitted trends rise, but the solve-rate peak is not the three-run 69.7% result, and the curves do not establish independent verification of process quality.
Self-verification receives 0.85 of the aggregate weight, prioritizing testing relevance, rigor, and responses to failures. These fixed weights encode the authors' process preferences rather than an empirically learned weighting.
Selected process dimensions trend upward alongside aggregate judge reward, though individual curves fluctuate. Rigor and Discriminativeness are not separately plotted. Because the rubric also supplies training feedback, these curves do not independently validate behavioral reliability.
3.5 Distilling Historical Rollouts into a Value Model
Historical experience distillation trains a standalone value model from outcome-verified trajectories accumulated across 20 previous Orchard-SWE RL experiments. It is evaluated on a new policy whose rollouts were excluded from value-model training, testing transfer across policy distributions rather than joint actor–critic fitting.
- The historical pool retains successful and failed trajectories with valid verifier outcomes, caps trajectories per task, and balances outcome classes. A Qwen3-4B backbone replaces its language-modeling head with a scalar value head.
- Each contiguous assistant response is a decision step; environment tokens are excluded from the loss. Terminal verifier rewards are propagated backward with generalized advantage estimation using γ = 0.98 and λ = 0.95.
- Inference selects τ* = argmax_i V_ϕ(τ_i) from N trajectories generated by the new policy. Training the value model requires no fresh environment interaction, but generating multiple inference candidates still incurs rollout costs.
- The experiment demonstrates inference-time reranking, not the broader suggestion that the offline value model can stabilize training of arbitrary future policies.
3.6 Main Results
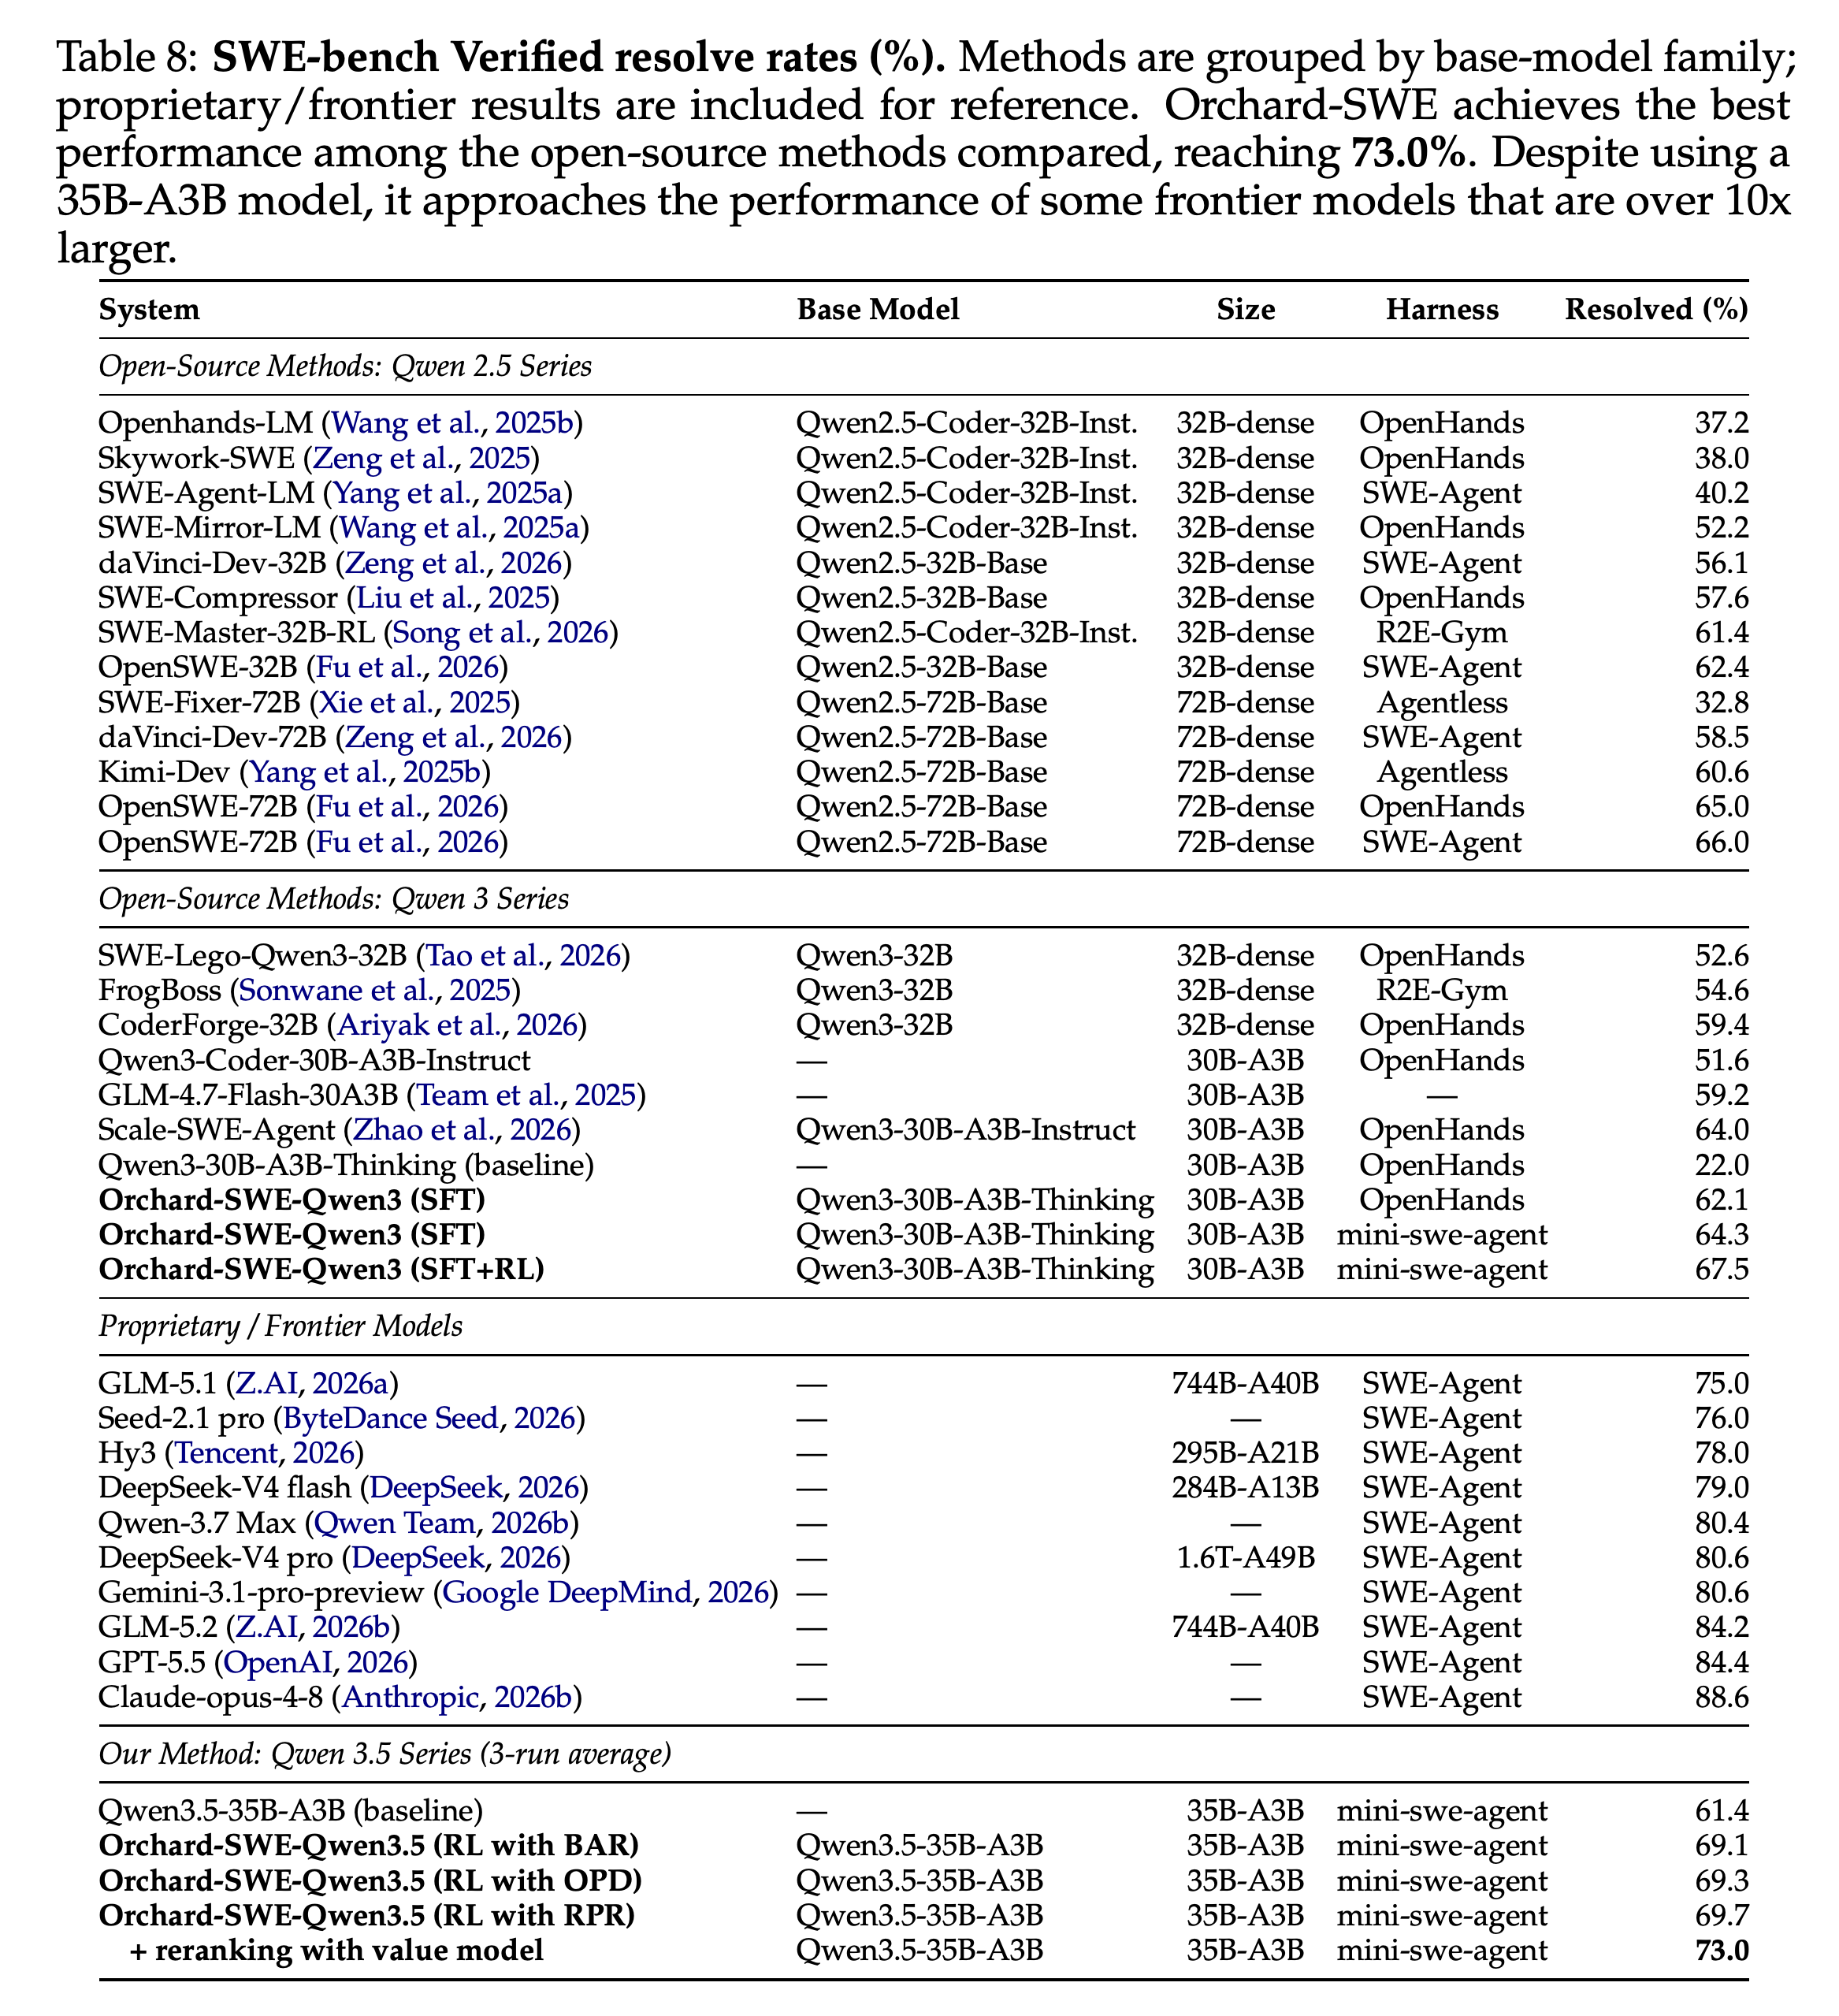
Table 8 reports results for two backbone families and multiple harnesses. Qwen3-30B-A3B-Thinking improves from a 22.0% OpenHands baseline to 62.1% with OpenHands SFT, 64.3% with mini-swe-agent SFT, and 67.5% with mini-swe-agent SFT+RL.
- For Qwen3.5-35B-A3B under mini-swe-agent, three-run means are 61.4% for the base, 69.1% with BAR, 69.3% with OPD, and 69.7% with RPR. The RL gains are substantial; the smaller differences among variants lack reported uncertainty intervals.
- Best-of-N reranking with N = 6 raises the RPR policy to 73.0%, a 3.3-point gain. Oracle selection reaches 82.4%, leaving 9.4 points above actual reranking; the paper’s stated 12.7-point headroom is the gap above the 69.7% single-policy result.
- The 73.0% result leads the open-source methods compared in Table 8 and is near GLM-5.1 at 75.0% and Seed-2.1 pro at 76.0%, but remains below several listed frontier systems. Total or active parameter counts do not establish equal inference cost, especially with six-candidate selection.
- The headline 45.5-point Qwen3 lift changes harness relative to the baseline. The matched OpenHands SFT comparison supports a 40.1-point improvement without that harness change.
The table distinguishes the Qwen3 SFT+RL recipe from Qwen3.5 reward variants and six-candidate value-model selection. The 73.0% result leads the open-source methods listed, while several frontier entries remain higher and use different harnesses.
3.7 Generalization to Unseen Harnesses and Tasks
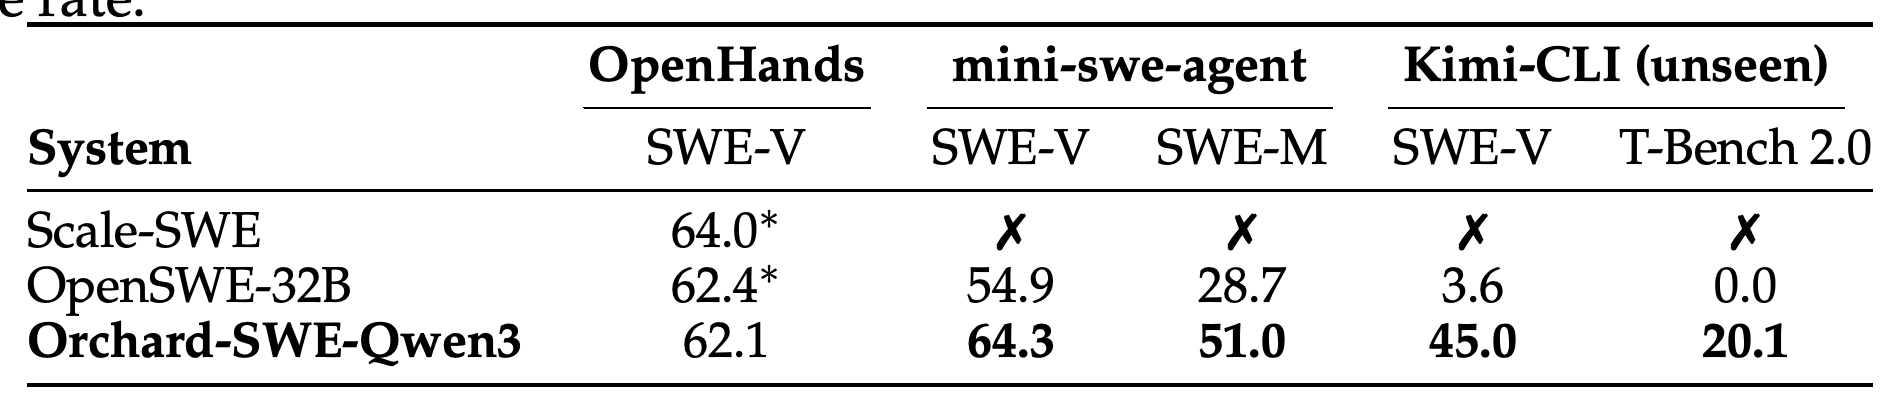
Table 9 evaluates harness and task transfer using OpenHands, mini-swe-agent, and previously unseen Kimi-CLI. Orchard-SWE-Qwen3 remains usable across all three, whereas Scale-SWE produces malformed calls outside its native harness and OpenSWE-32B degrades sharply under Kimi-CLI.
- Orchard-SWE-Qwen3 scores 62.1%, 64.3%, and 45.0% on SWE-bench Verified under OpenHands, mini-swe-agent, and Kimi-CLI respectively. OpenSWE-32B scores 62.4%, 54.9%, and 3.6%; native benchmark entries for comparison systems are taken from their papers.
- Under mini-swe-agent, Orchard reaches 51.0% on SWE-bench Multilingual versus OpenSWE-32B’s 28.7%. Under Kimi-CLI, Terminal-Bench 2.0 results are 20.1% versus 0.0%.
- These results support improved transfer, not harness independence: Orchard loses 19.3 points from its best Verified condition to Kimi-CLI. The separate contributions of teachers, task sources, failed-trace supervision, and infrastructure are only partly isolated by the ablations.
Orchard maintains valid behavior across three harnesses and retains nonzero Terminal-Bench capability. Its 45.0% Kimi-CLI Verified score nevertheless remains 19.3 points below its mini-swe-agent result; native results for comparison systems are cited rather than rerun.
3.8 Ablations and Analysis
The Qwen3 ablations examine data scale, selection strategy, harness coupling, failed-trajectory supervision, and RL initialization. They show dependence on interaction format and different RL effects on in-distribution performance and task transfer.
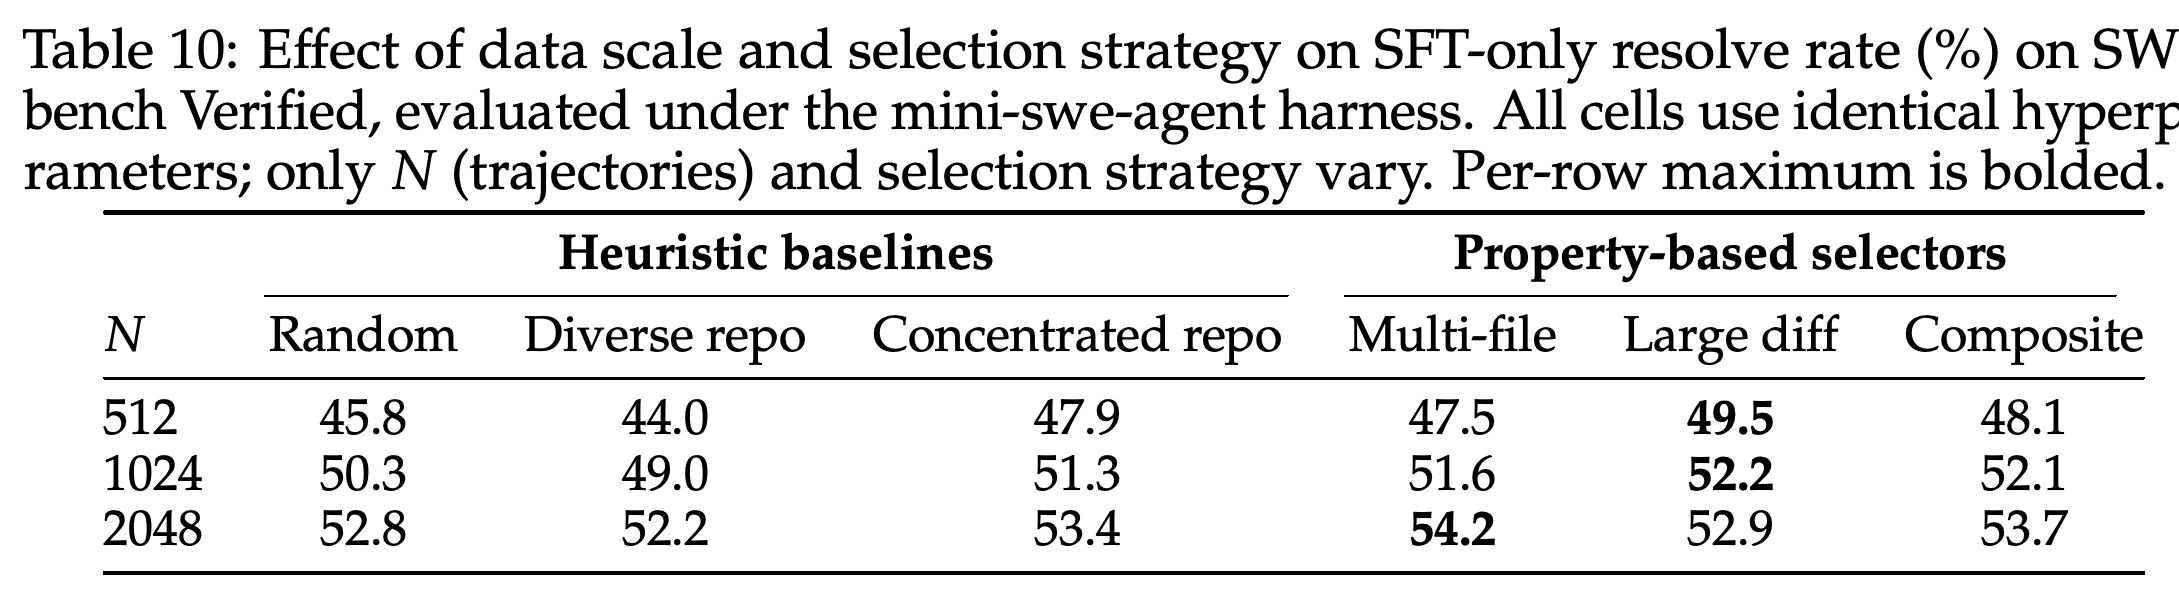
- Table 10 holds SFT hyperparameters fixed while varying 512, 1,024, or 2,048 resolved trajectories and six selectors. Across selectors, the spread shrinks from 5.5 to 3.2 to 2.0 points; larger data volumes improve every selector, with the best 2,048-trajectory cell reaching 54.2%.
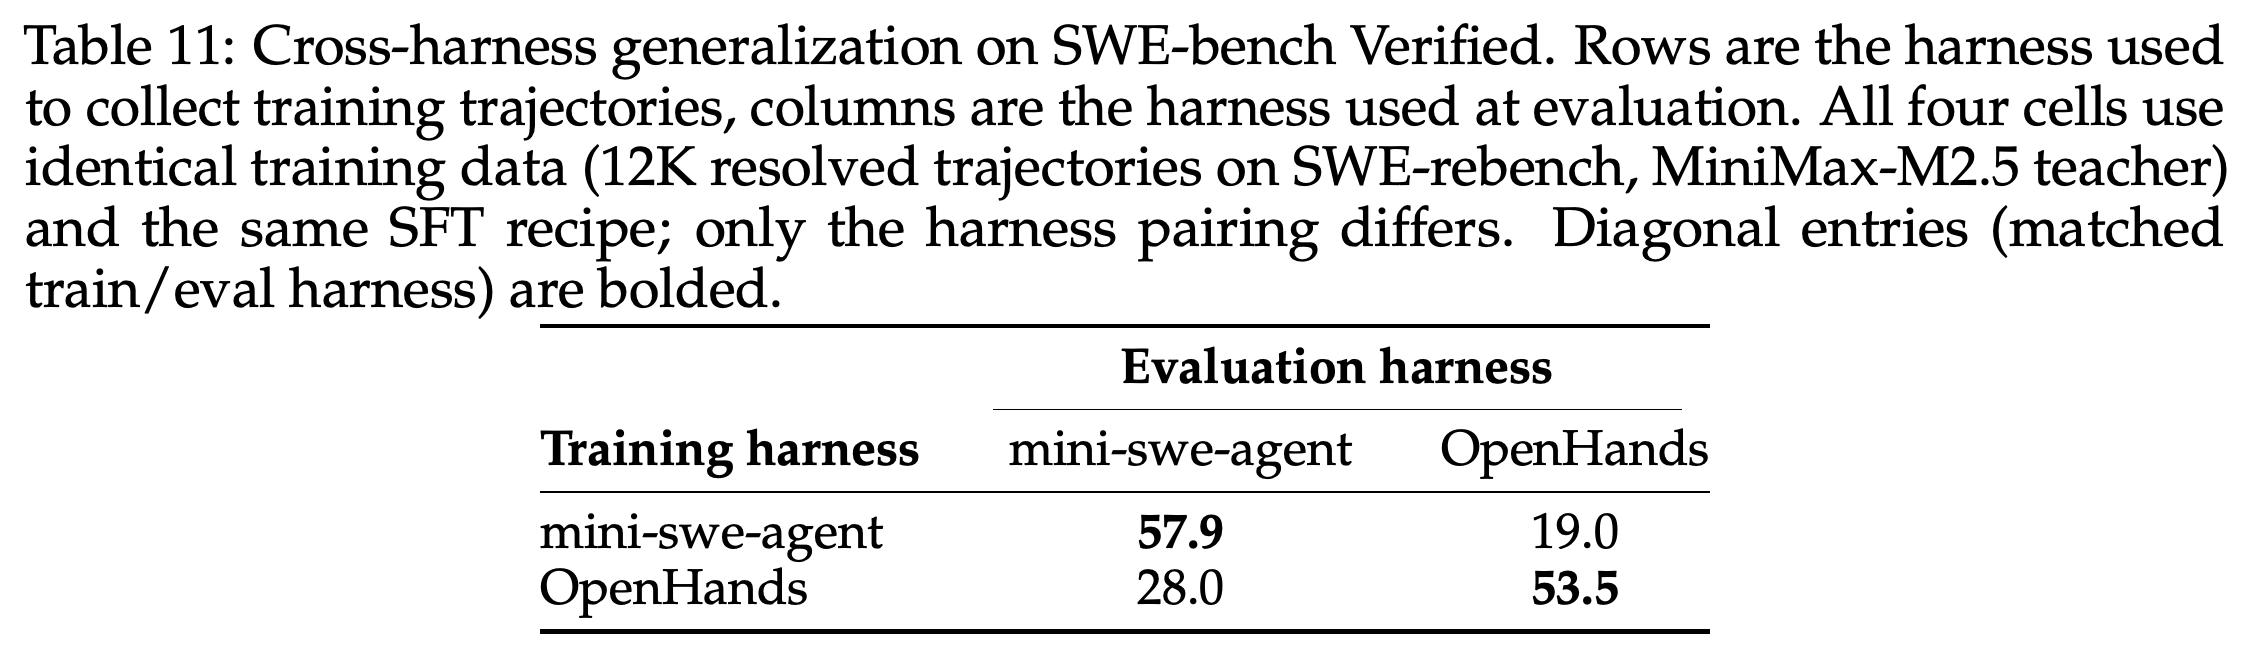
- Table 11 holds the task source, teacher, approximate collection size, and SFT recipe fixed while varying the collection and evaluation harnesses. Matched mini-swe-agent and OpenHands conditions reach 57.9% and 53.5%, but mismatched evaluations fall to 19.0% and 28.0%. The trajectories differ by collection harness; this is not an identical-trace comparison or proof that every single-harness corpus must fail to generalize.
- Adding approximately 32K failed-trace rise-segment examples to a 32K resolved baseline raises Verified performance from 59.3% to 61.2%. This establishes useful additional supervision, but not superiority over adding an equal number of resolved examples.
- RL from a 512-trajectory SFT checkpoint improves Verified from 48.1% to 50.1% and Multilingual from 22.0% to 28.7%. RL from the full SFT checkpoint improves Verified from 64.3% to 67.5% while slightly reducing Multilingual performance; the final Multilingual score is not supplied.
Increasing resolved-trajectory count improves every selector, while differences among selection strategies narrow. Gold-patch heuristics are most useful at the smallest data volume; the grid covers at most 2,048 trajectories, not the full corpus.
With task source, teacher, approximate collection size, and SFT recipe fixed, matched harnesses reach 53.5–57.9%, whereas mismatches fall to 19.0–28.0%. Collection harness changes the interaction traces, so the experiment controls the recipe and source conditions rather than training on identical trajectories.
4 Orchard-GUI
Orchard-GUI extends the shared execution service to screenshot-based browser agents. It uses a generic tool-calling harness and a two-stage SFT+RL recipe rather than a browser-specific orchestration framework.
4.1 Problem Setting
Each browser task provides a starting URL and natural-language intent; success requires navigating live pages and returning an answer or completing the requested action. Evaluation uses an LLM judge over the final response and screenshot sequence on WebVoyager, Online-Mind2Web, and DeepShop, following the protocols used by FARA and Molmo-Web.
- This evaluates open-web browser use, not full desktop or mobile control. Live-site changes, anti-bot restrictions, and judge reliability affect the measurement conditions.
4.2 Generic Tool-Calling Agent Harness
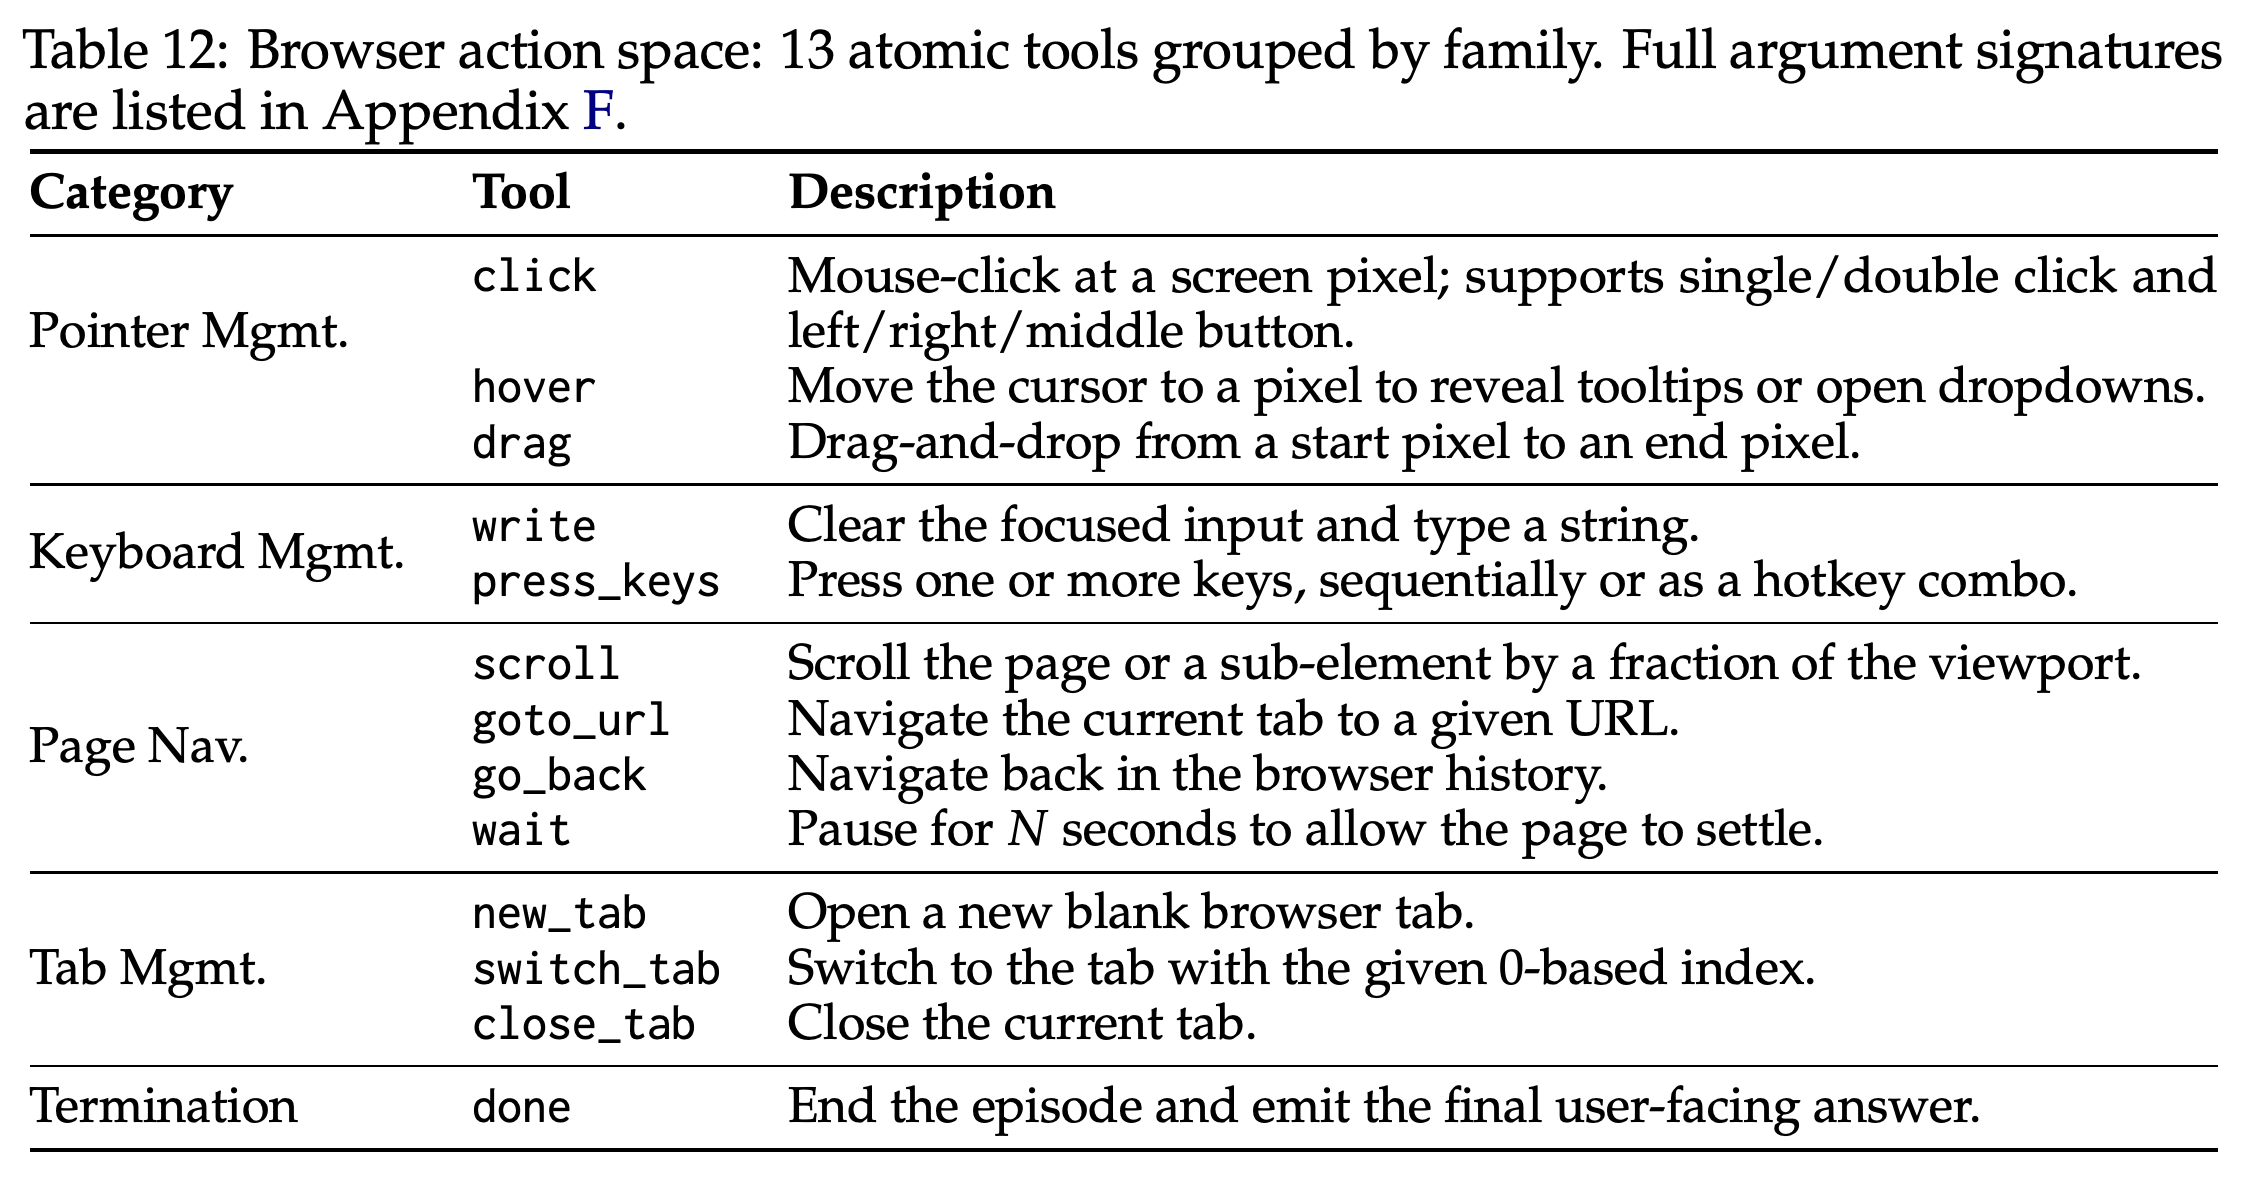
The generic ReAct-style harness exposes 13 atomic tools through the OpenAI tool-calling interface. Table 12 groups them into pointer, keyboard, page-navigation, tab-management, and termination actions; done(response) is the only explicit termination action and carries the final answer, while rollouts can also end when their budget is exhausted.
- The action set is click, hover, drag, write, press_keys, scroll, goto_url, go_back, wait, new_tab, switch_tab, close_tab, and done. Responses contain a <think> block and one or more <tool_call> blocks.
- Observations include the latest screenshot, viewport dimensions, and tab URLs and titles. Only the last k screenshots are retained verbatim, while earlier text reasoning and tool feedback remain in context.
- Execution uses isolated Playwright-controlled Chromium instances with 1 vCPU and 8 GiB memory. Appendix G illustrates k = 1, not necessarily the configuration of every experiment.
The action set supports browser interaction through atomic pointer, keyboard, navigation, and tab operations. A dedicated done action separates explicit completion and final output from ordinary interaction calls.
4.3 Trajectory Collection and Curation
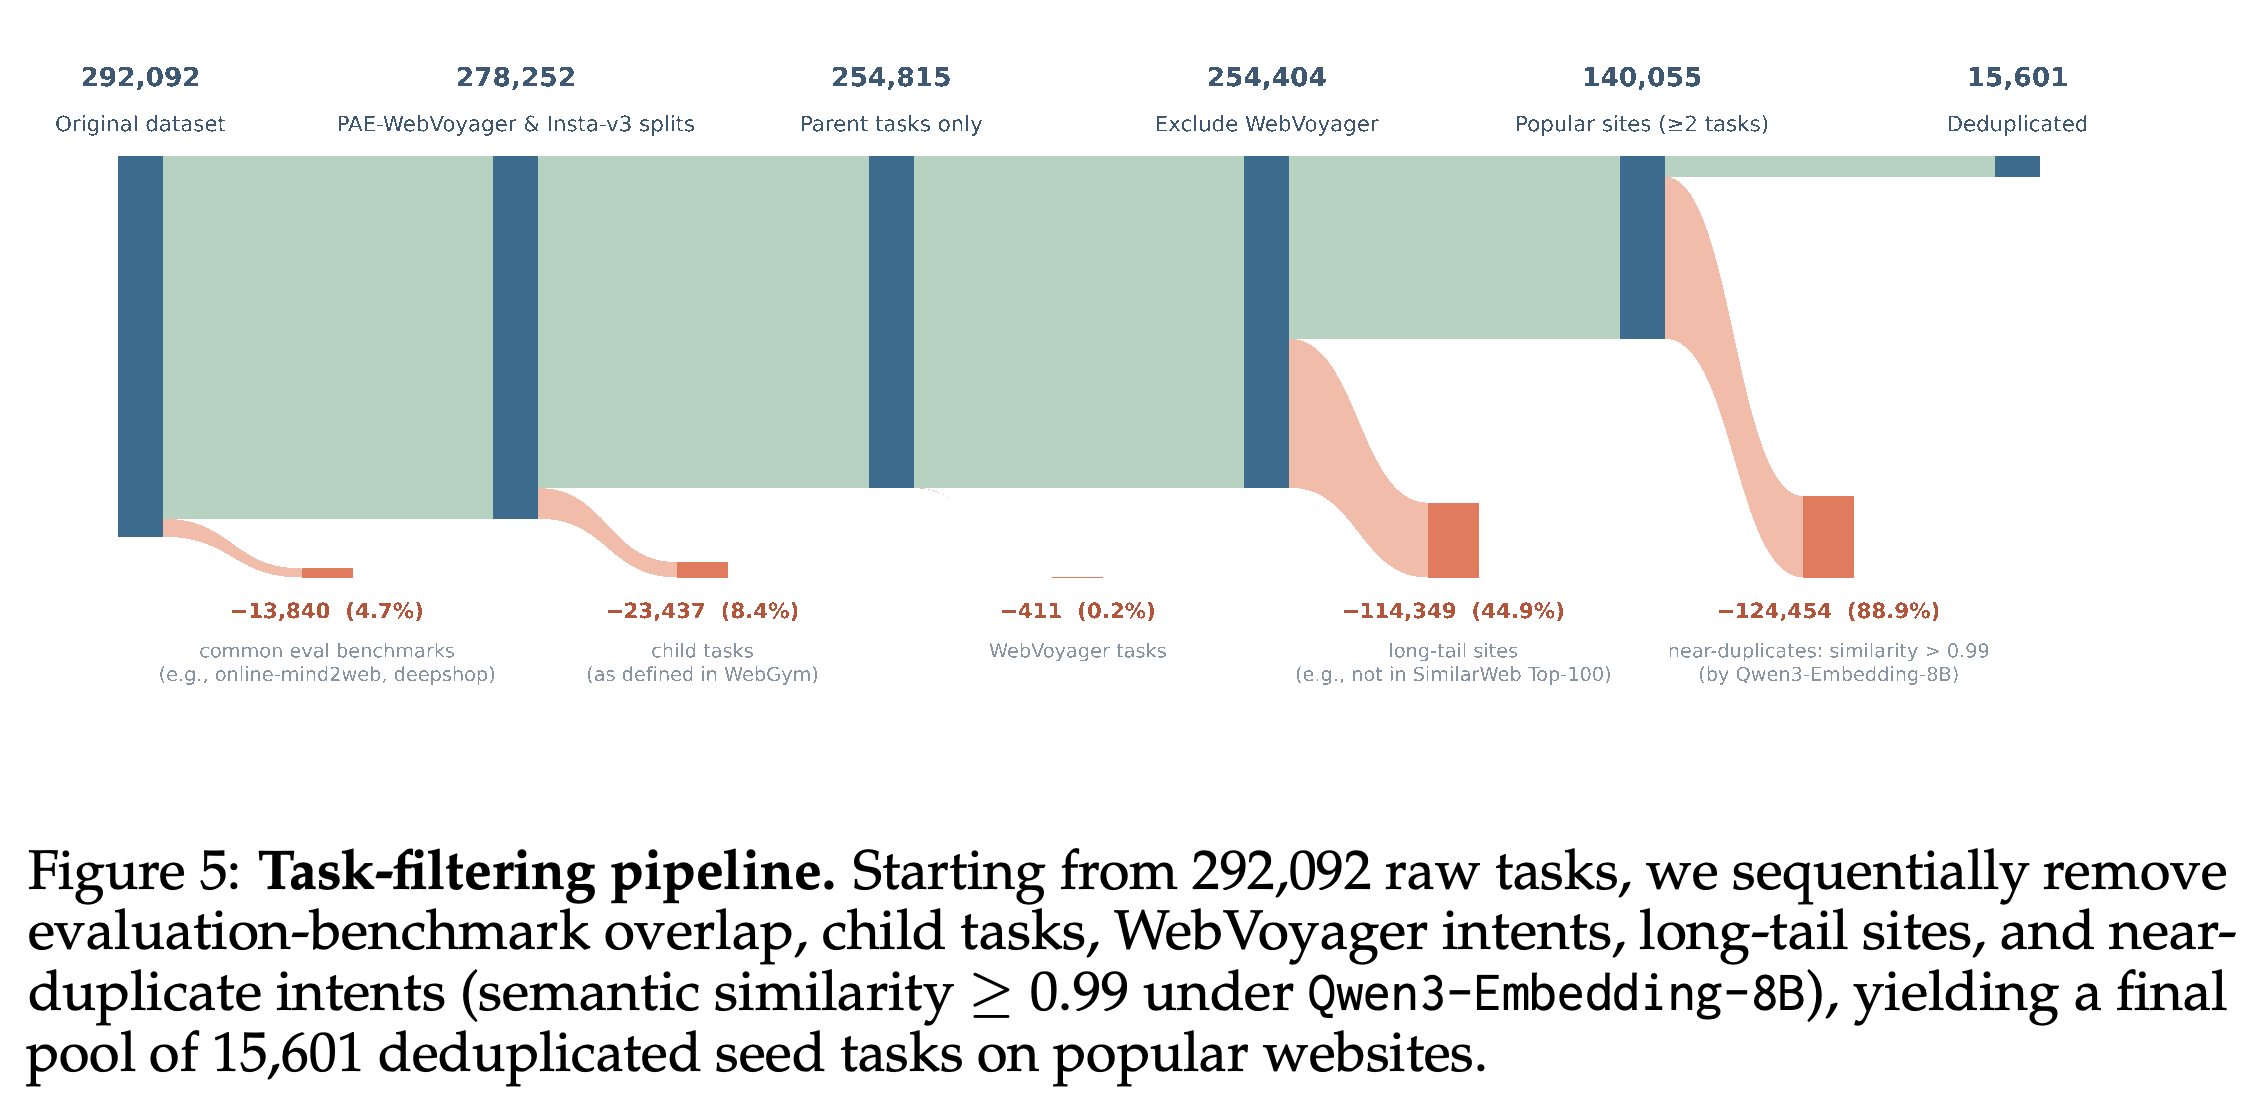
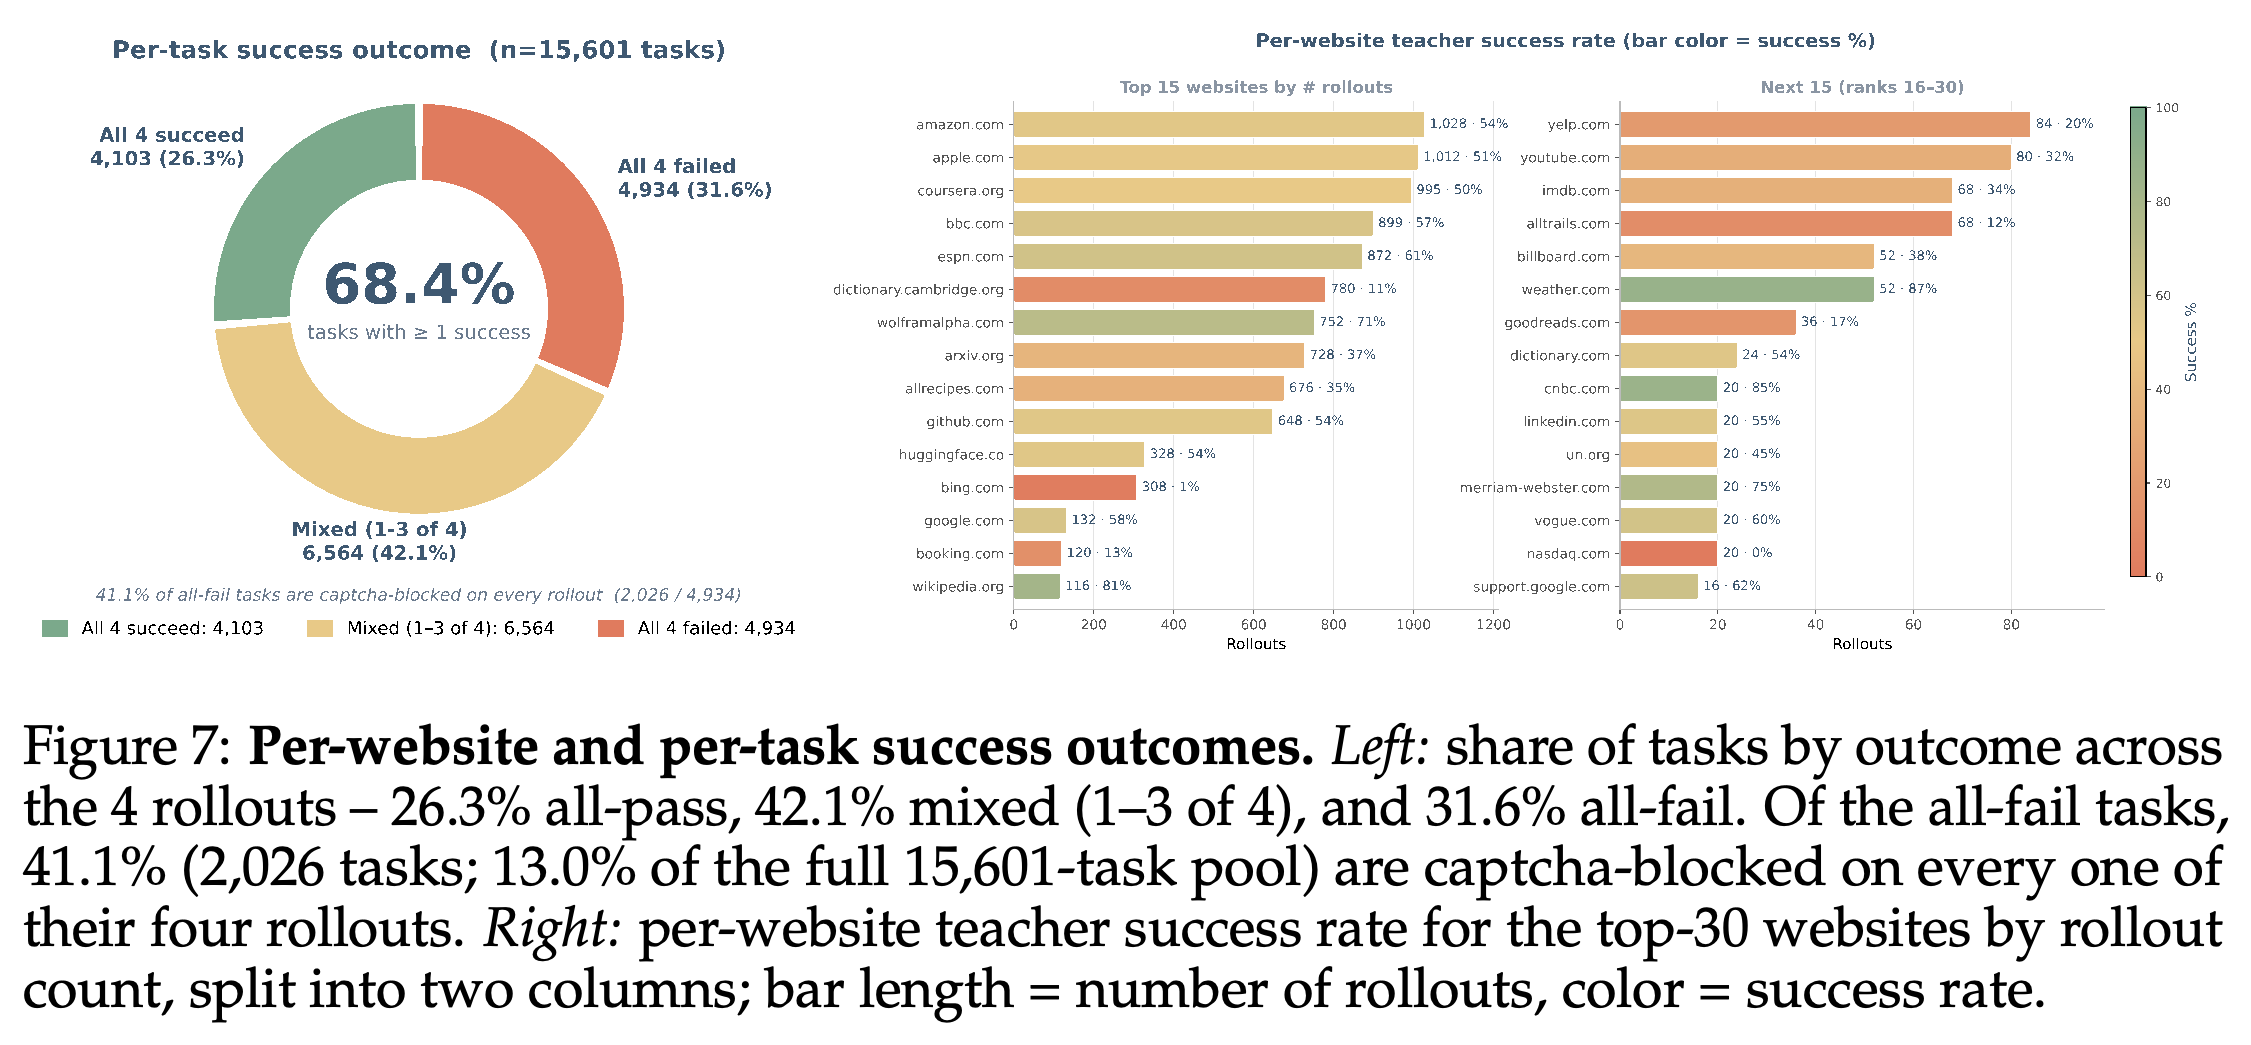
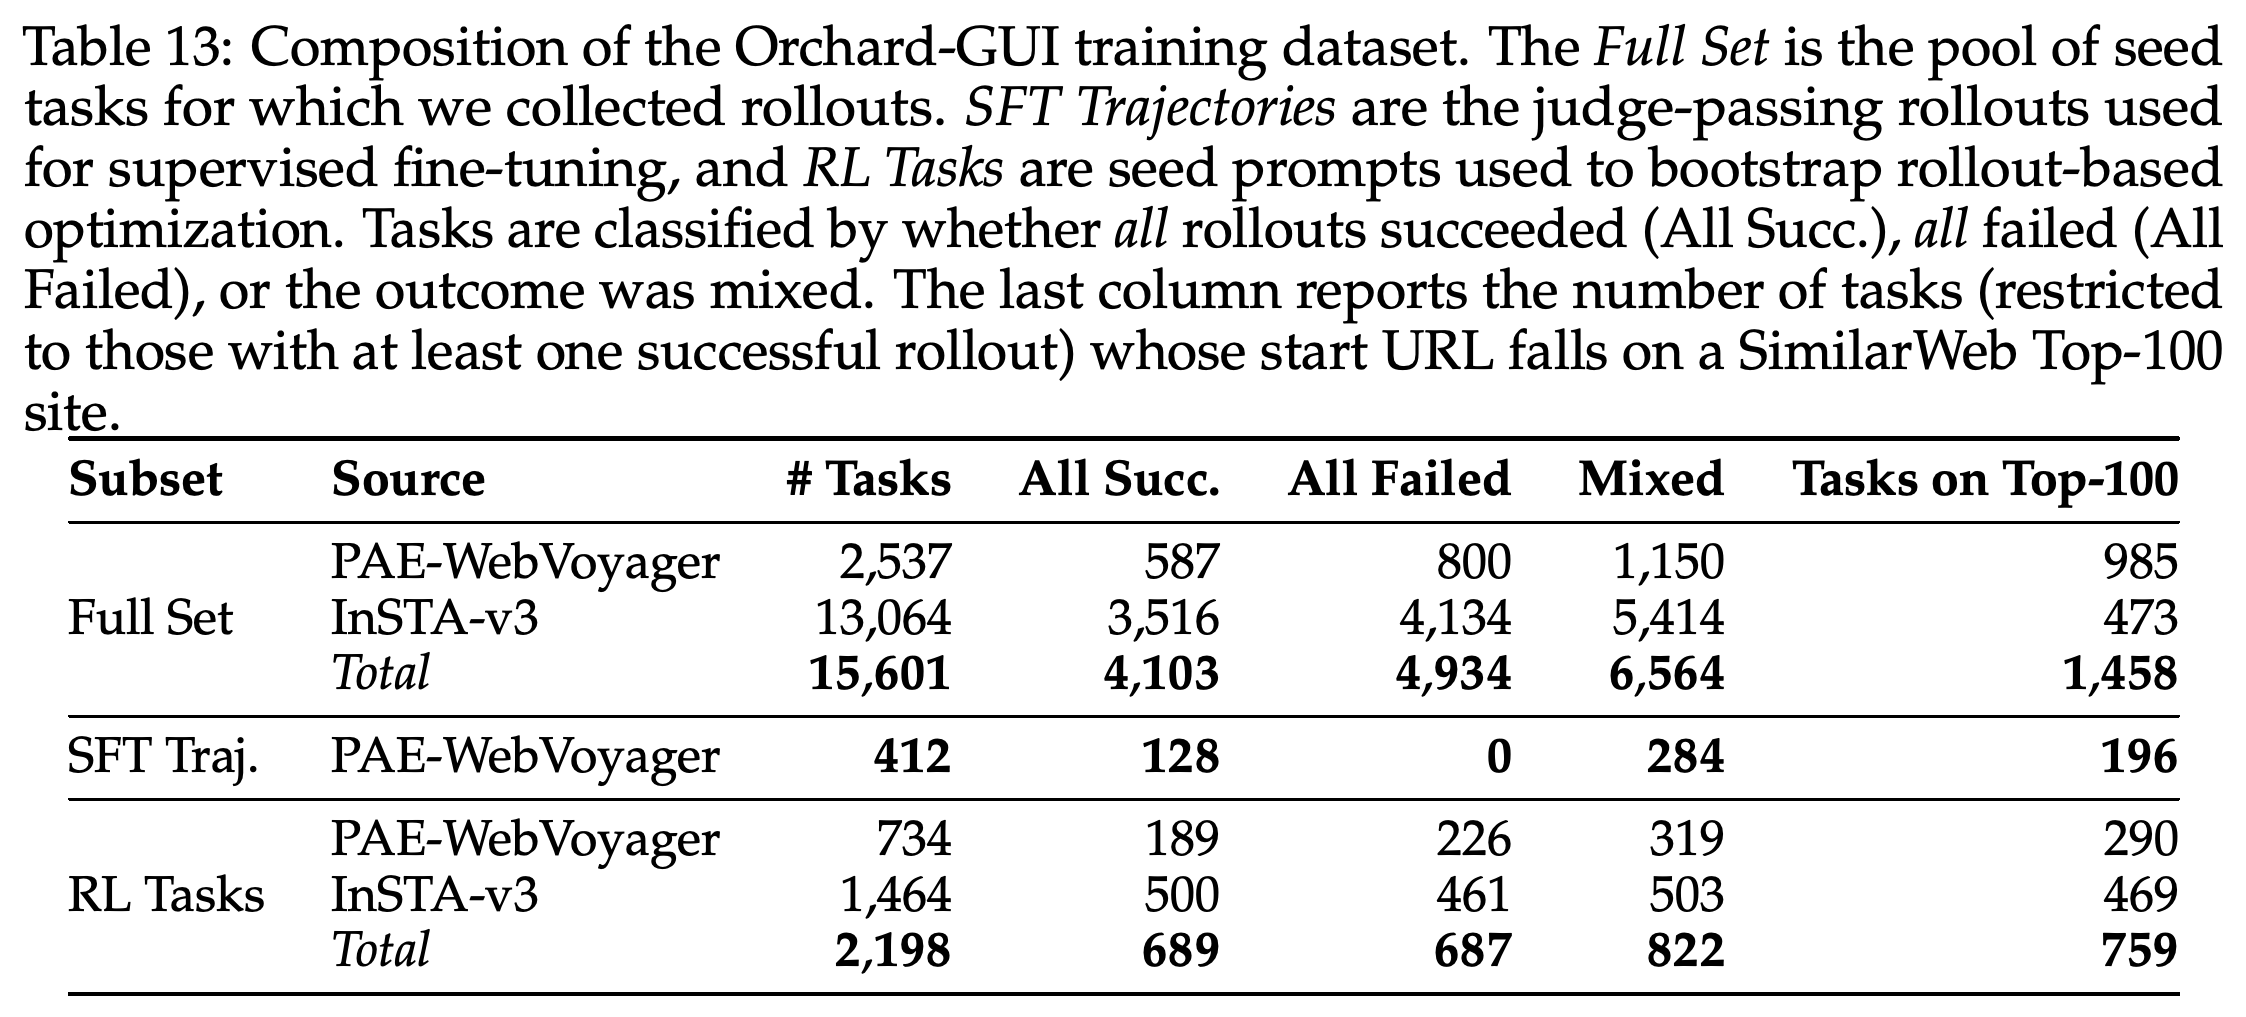
GUI collection begins with 292,092 WebGym tasks and filters them to 15,601 seed intents, comprising 2,537 PAE-WebVoyager and 13,064 InSTA-v3 tasks. Figures 5–7 describe filtering, website coverage, and teacher outcomes; Table 13 distinguishes the collection pool from the smaller training subsets.
- Filtering removes benchmark overlap, child tasks, original WebVoyager intents, long-tail sites, and semantic near-duplicates using Qwen3-Embedding-8B. The RL pool uses a stricter 0.95 similarity threshold and contains 2,198 tasks.
- Qwen3-VL-235B-A22B-Thinking generates four rollouts per seed, producing 62,395 rollouts after occasional aborts. GPT-4.1 judges success: 26.3% of tasks pass all four attempts, 42.1% have mixed outcomes, and 31.6% fail all four.
- Of 4,934 all-fail tasks, 2,026 are captcha-blocked on every attempt. Thus 41.1% of all-fail cases reflect a documented environmental obstruction; the remaining failures cannot all be attributed to reasoning limitations without further analysis.
- From 4,826 successful PAE-WebVoyager rollouts, SFT keeps the shortest successful trajectory per task and caps each website at K = 20 tasks, yielding 412 trajectories across 70 websites. The 2.6K training-task headline does not represent the full teacher-rollout collection effort.
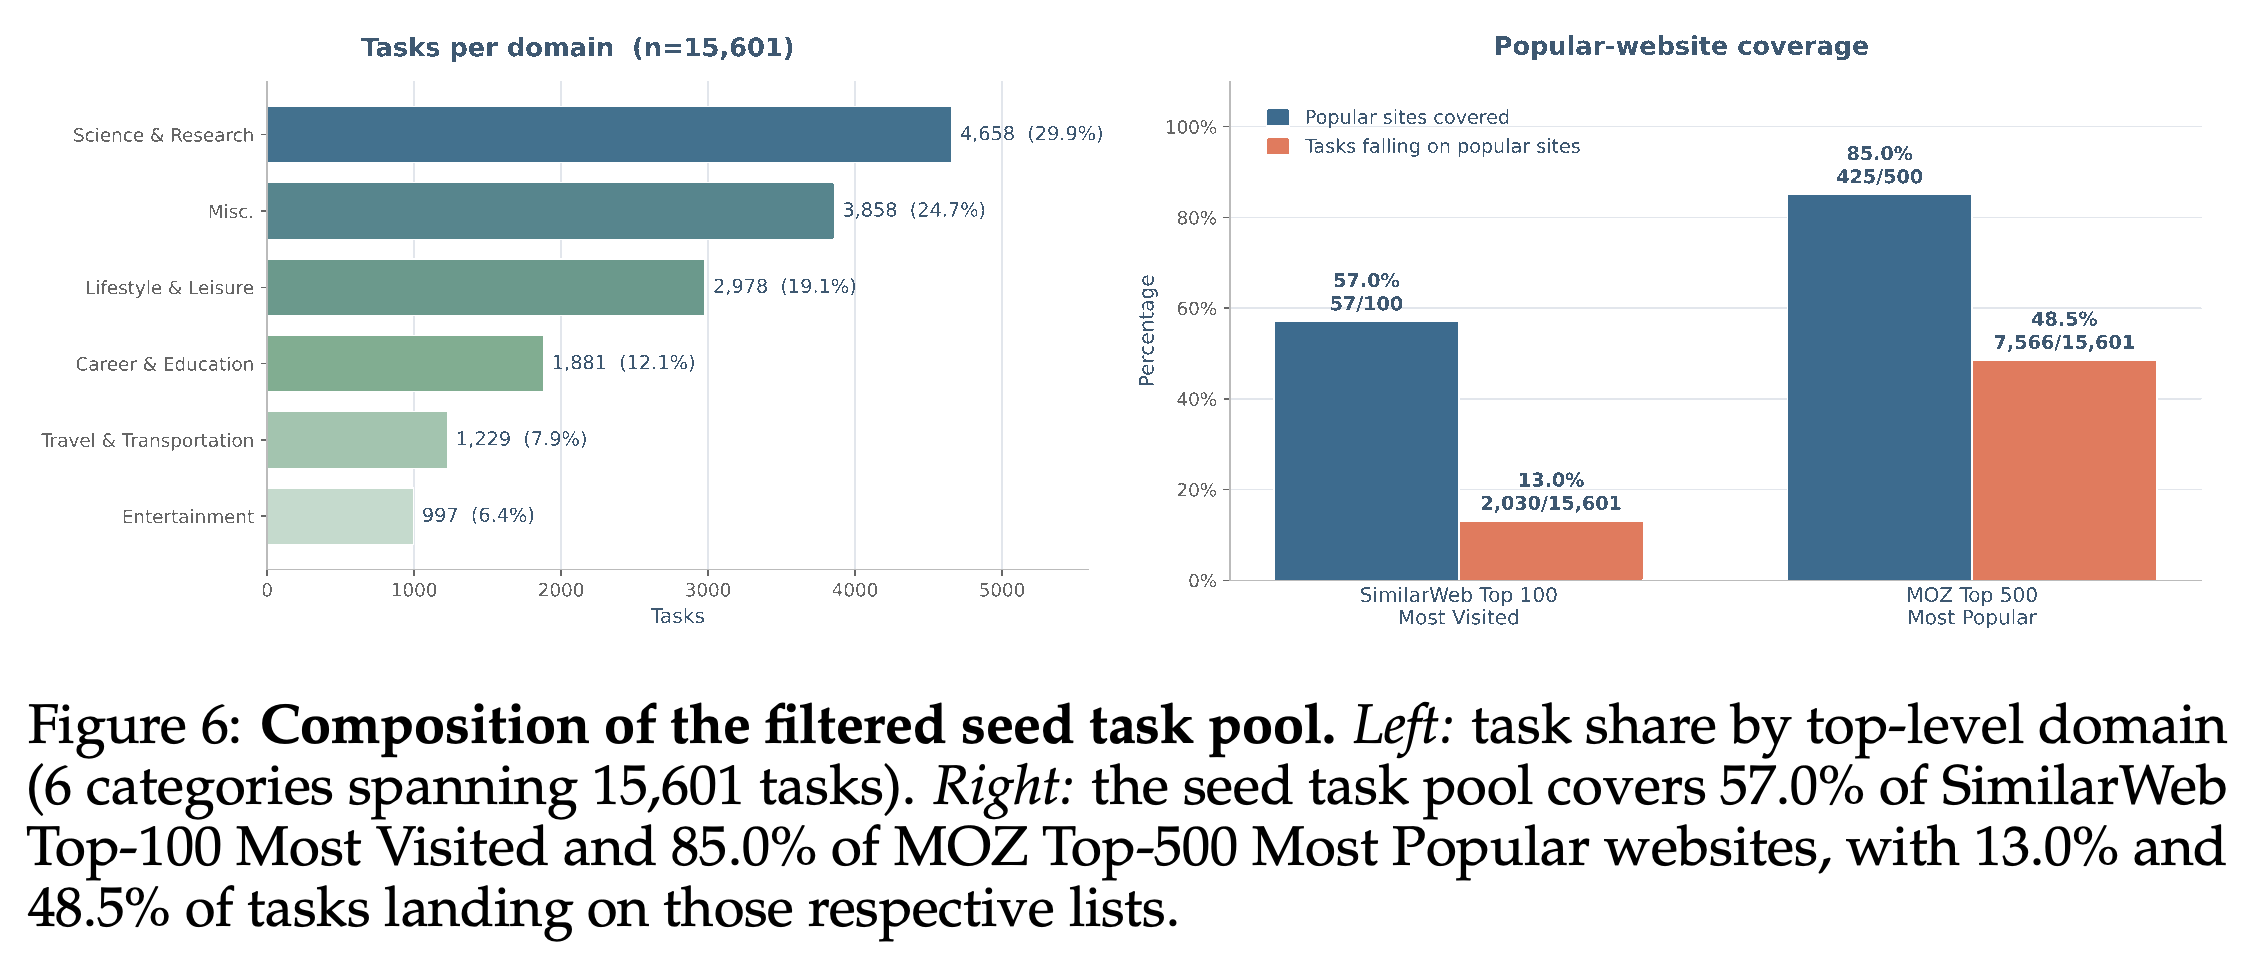
- Figure 6 reports coverage of 57/100 SimilarWeb sites and 425/500 MOZ sites, with 2,030 and 7,566 tasks on those lists respectively. The reported 13,063 unique hosts is difficult to reconcile with Appendix H’s popular-site restriction and requirement of at least two tasks per site.
The largest reduction occurs during semantic deduplication, removing 124,454 of 140,055 remaining tasks. The seed pool is heavily curated rather than randomly sampled; the diagram and appendix use > 0.99, while the caption uses ≥ 0.99.
The pool spans six domain categories, with Science & Research accounting for 29.9%. Website coverage differs from task concentration: 85.0% coverage of MOZ Top-500 sites corresponds to 48.5% of tasks falling on that list.
Mixed outcomes across four rollouts are common, informing task-difficulty estimates and trajectory selection. The captcha annotation documents environmental blocking in 41.1% of all-fail tasks, while website-level bars show substantial variation in both collection volume and success.
The table distinguishes 15,601 collected seed tasks from 412 SFT trajectories and 2,198 RL tasks. Its Top-100 column is restricted to tasks with at least one successful rollout, so it is not the same count as overall Top-100 task coverage in Figure 6.
4.4 Training Recipe
GUI SFT initializes Qwen3-VL-4B-Thinking, freezes its vision encoder and multimodal projector, and updates language-model weights on one target assistant turn per serialized trajectory prefix. Training uses three epochs, peak learning rate 10⁻⁵, cosine decay, 10% warmup, and global batch size 128 across eight workers.
- Multi-turn GRPO broadcasts trajectory-level advantages to assistant-response tokens, masking observations. Rewards are +1 when all assistant turns have valid formatting and the judge confirms completion, −1 for termination after repeated format failures, and 0 otherwise.
- RL uses asymmetric PPO clipping with ε_low = 0.2 and ε_high = 0.28, no KL or entropy regularization, and no per-trajectory 1/T_i normalization. Dynamic sampling drops all-zero or all-positive groups.
- Judge API failures and captcha-aborted runs have their loss masks zeroed through remove_sample. A step-budget curriculum first trains with 15 steps and then extends to 30.
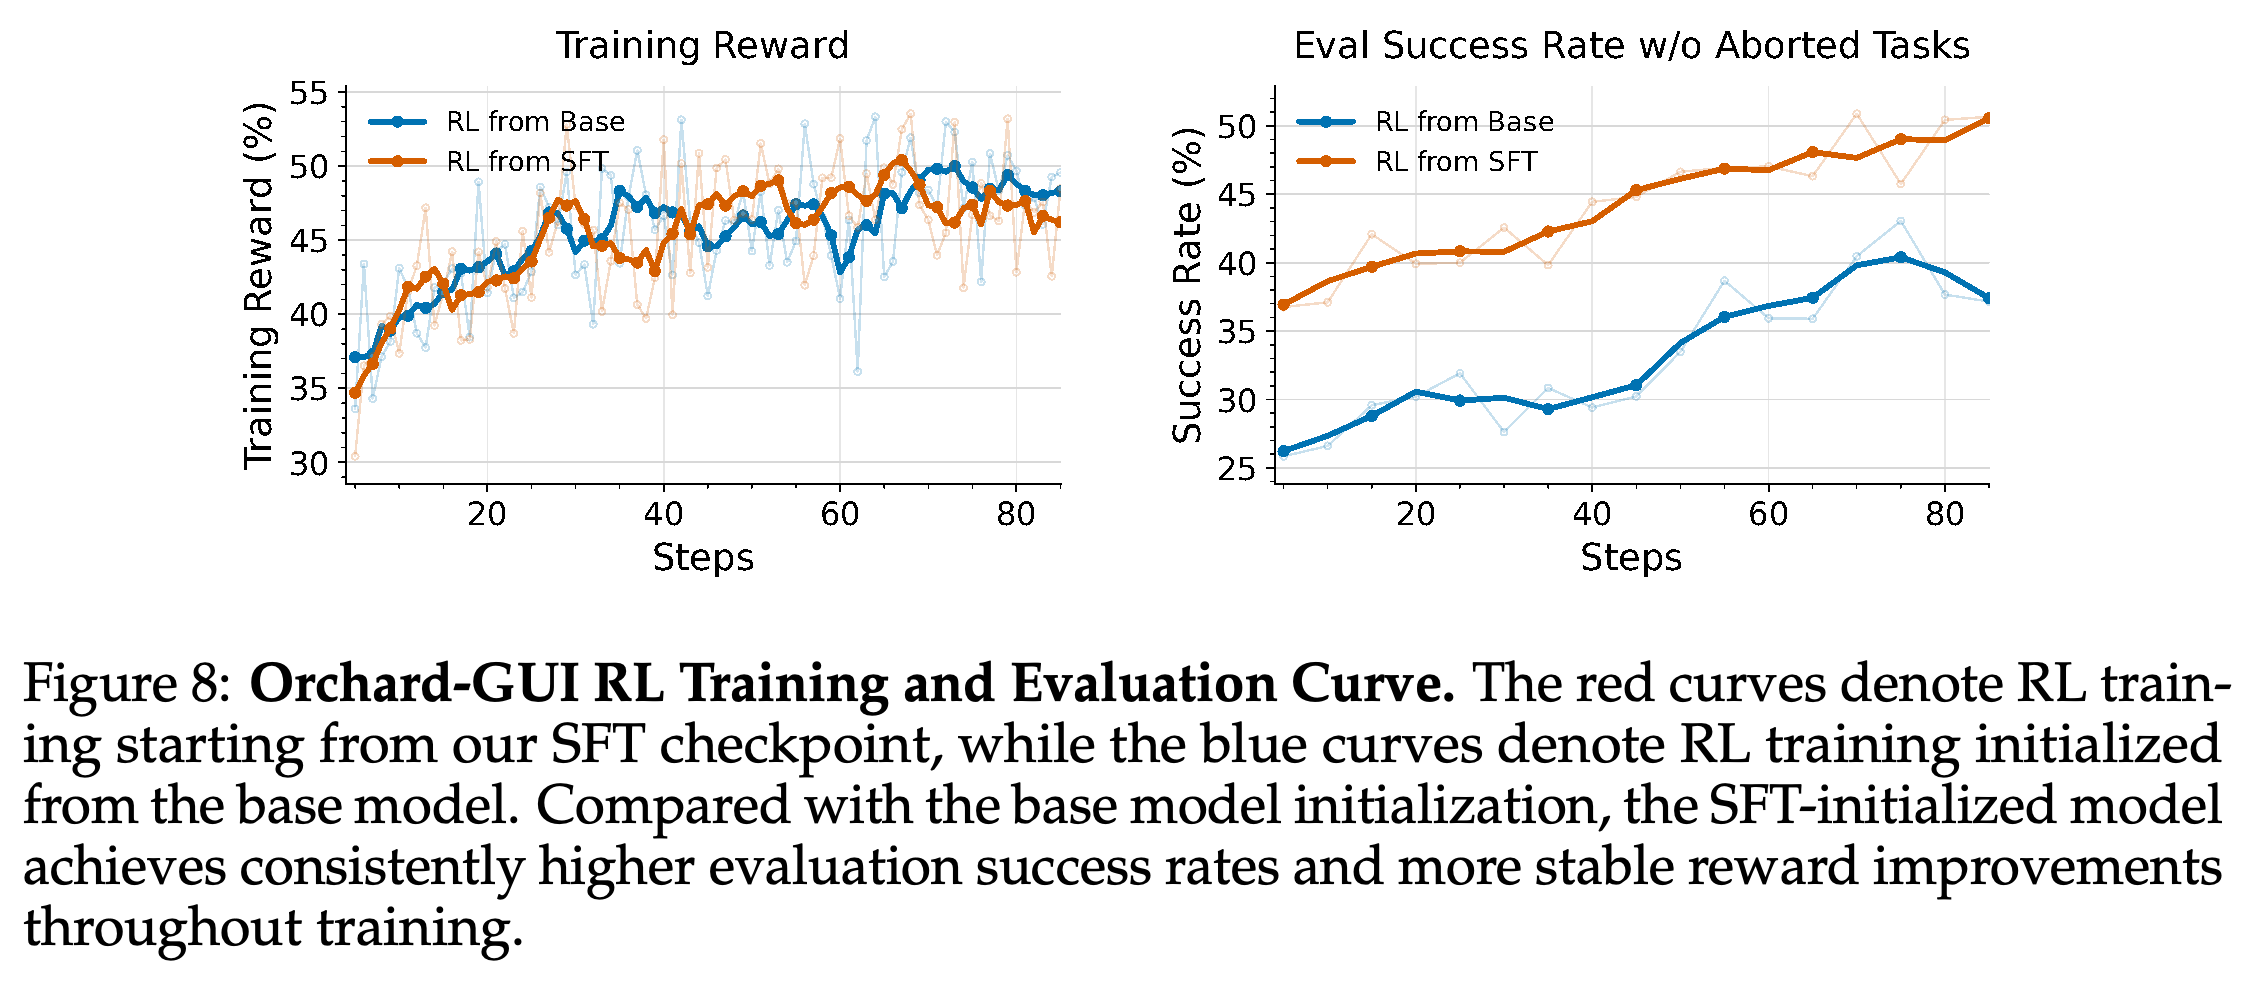
- Figure 8 compares RL from base and SFT initialization: training rewards are similar, but SFT initialization produces consistently higher evaluation success on the plotted set, which excludes aborted tasks.
Base- and SFT-initialized RL achieve similar training rewards, but SFT initialization yields stronger evaluation success. The evaluation panel excludes aborted tasks, so its rates are not all-attempt end-to-end success measurements.
4.5 Main Results
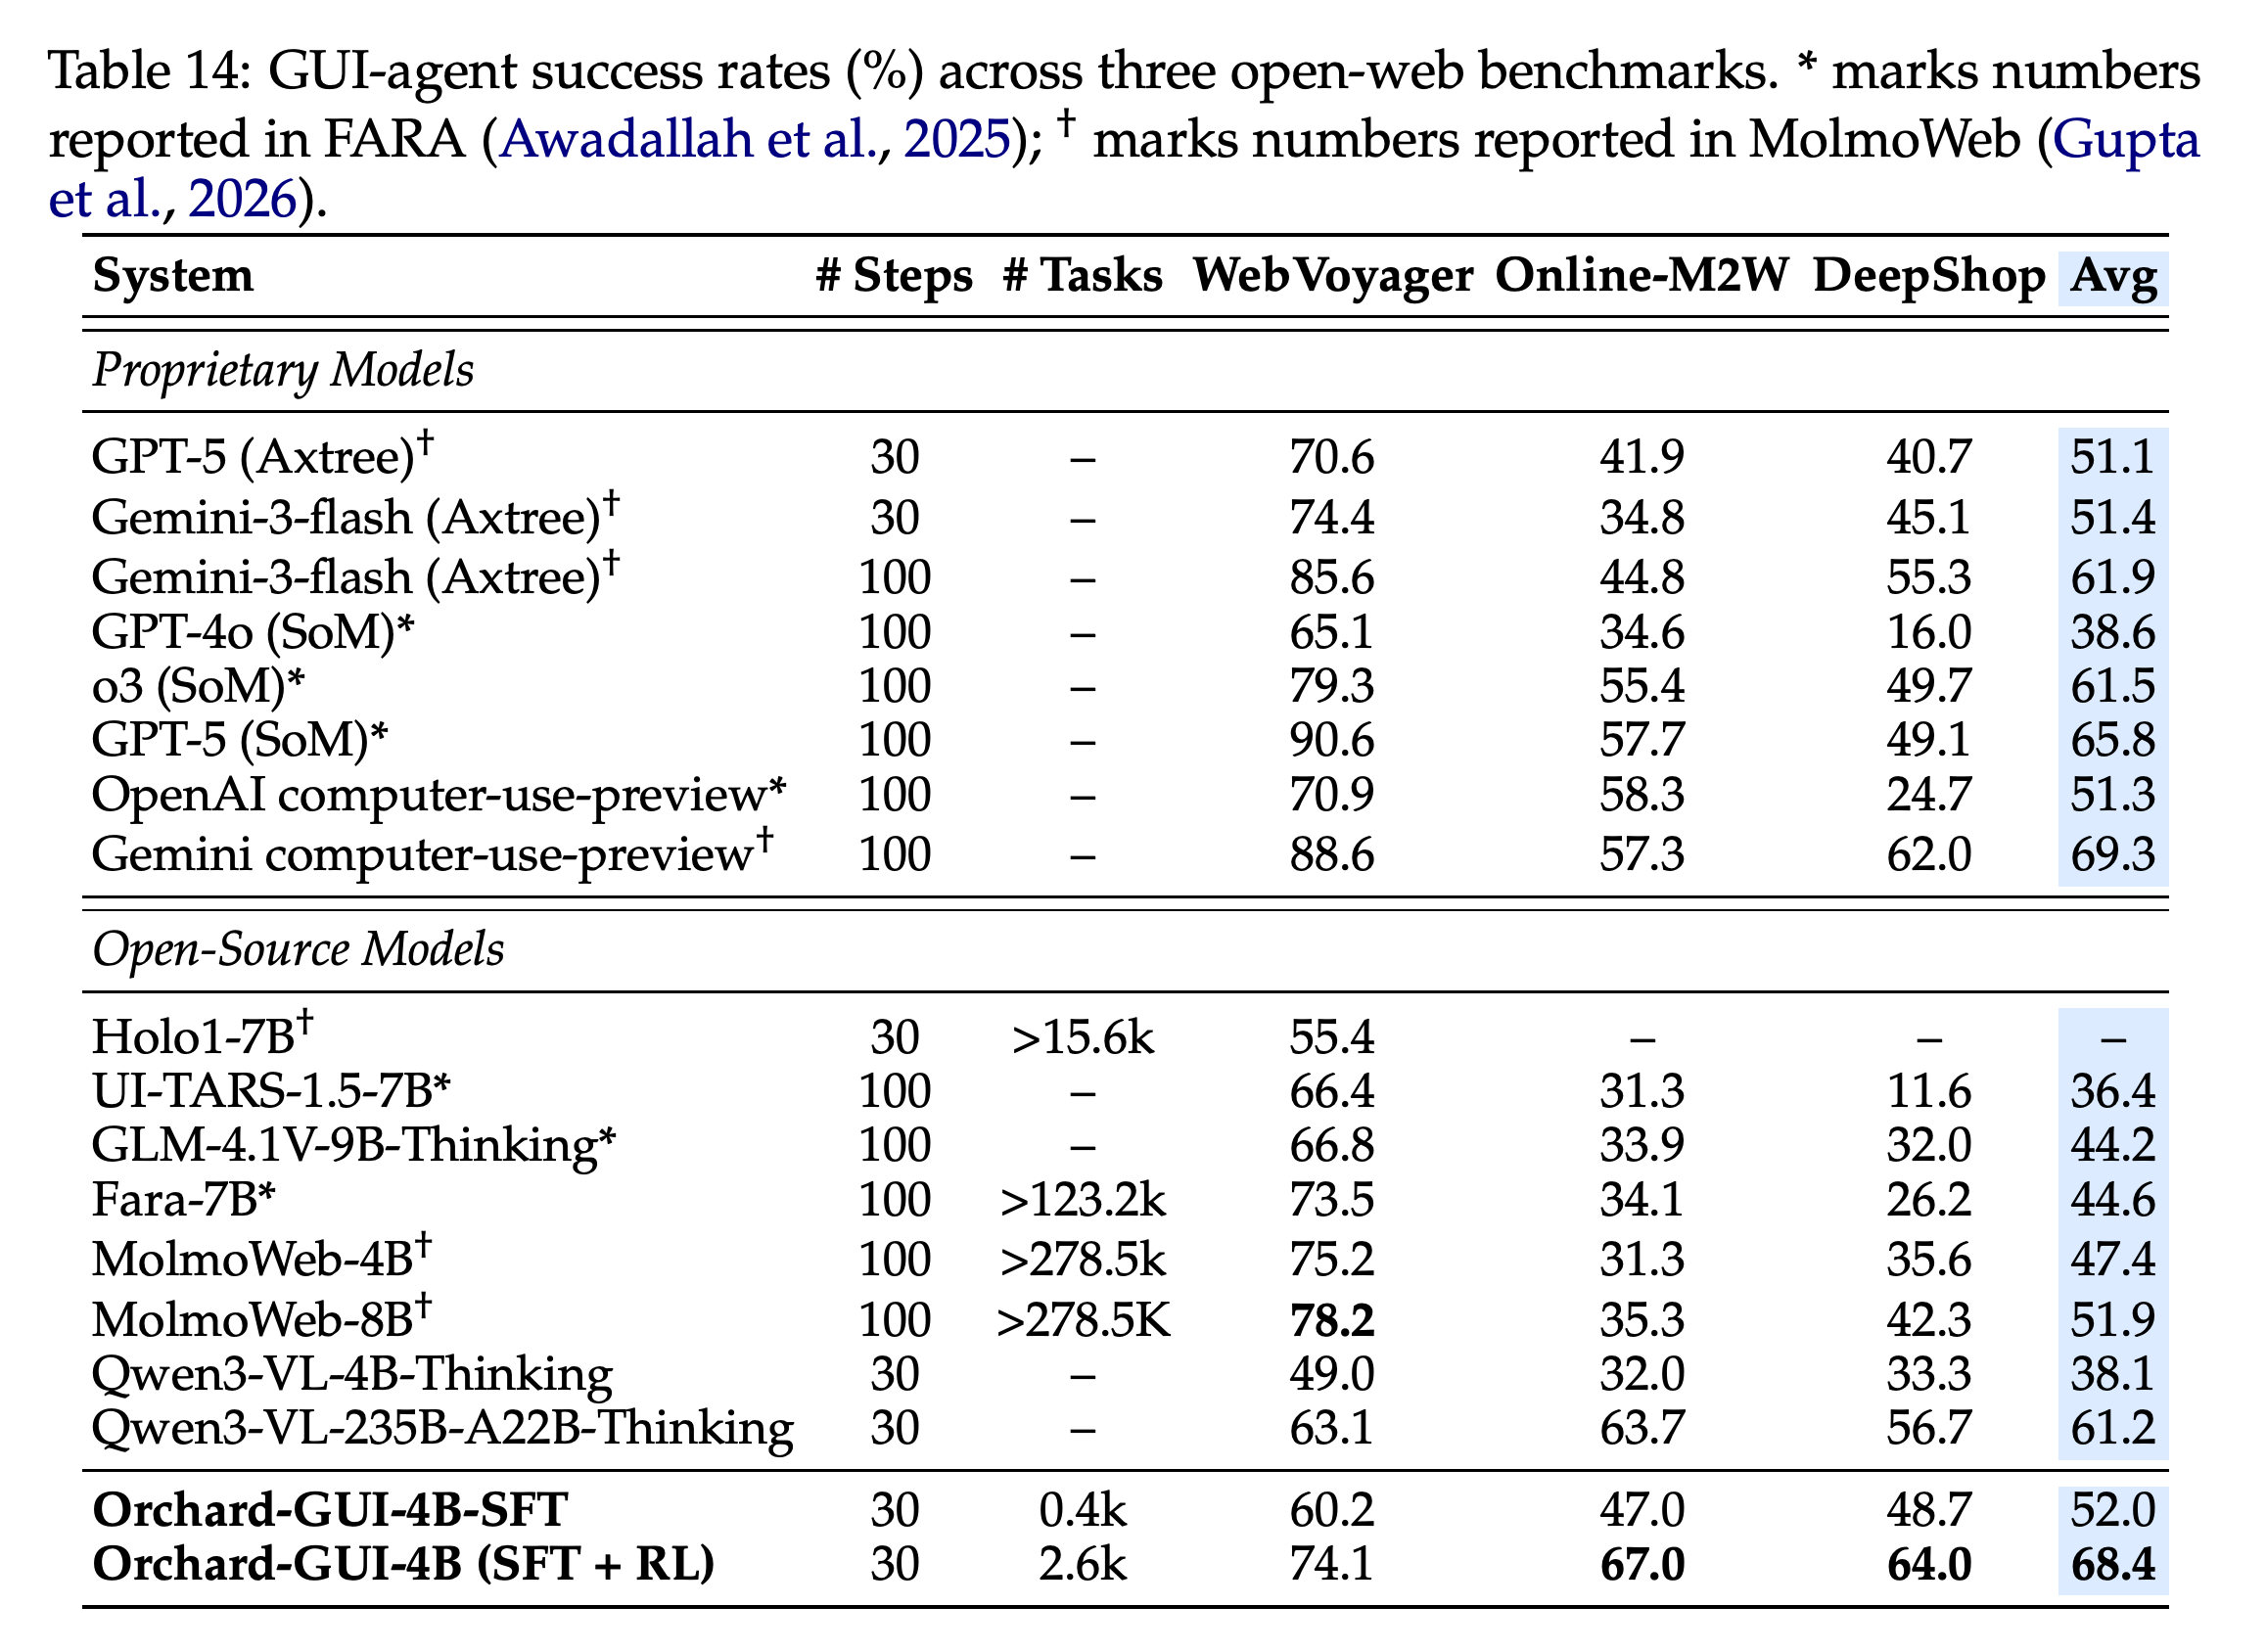
Table 14 reports Orchard-GUI success of 74.1% on WebVoyager, 67.0% on Online-Mind2Web, and 64.0% on DeepShop, averaging 68.4%. The SFT checkpoint averages 52.0%, and the base Qwen3-VL-4B-Thinking model averages 38.1%.
- RL improves the SFT checkpoint by 13.9, 20.0, and 15.3 points on the three benchmarks. The final model exceeds its 235B teacher’s 61.2% average and the strongest prior open baseline listed, MolmoWeb-8B, at 51.9%.
- The advantage is concentrated on Online-Mind2Web and DeepShop: Orchard exceeds MolmoWeb-8B by 31.7 and 21.7 points, but its 74.1% WebVoyager result is below MolmoWeb-4B’s 75.2% and MolmoWeb-8B’s 78.2%.
- Gemini computer-use-preview averages 69.3%, compared with Orchard’s 68.4%. Many comparison systems use 100 steps rather than Orchard’s 30, and some use accessibility trees or Set-of-Mark representations, so harness and budget conditions differ.
- The curated training subsets are small, but end-to-end compute efficiency requires accounting for 62,395 teacher rollouts, judge calls, and repeated RL sampling.
Orchard's leading open-source average is driven by Online-Mind2Web and DeepShop, not the highest WebVoyager score. Step budgets, observation representations, training-task counts, and the provenance of comparison results vary across systems.
5 Orchard-Claw
Orchard-Claw studies personal-assistant workflows involving email, calendars, inventory, scheduling, and other tools. It uses synthetic tasks and end-to-end training under both the benchmark’s ReAct-style harness and ZeroClaw.
5.1 Problem Setting
Claw-Eval audits completion, safety, and robustness across the full trajectory using automated scripts and an LLM judge. It aggregates them as task_score = safety × (0.8 · completion + 0.2 · robustness), and counts a task as passed when task_score ≥ 0.75.
- Training and evaluation environments run through Orchard Env in isolated 2-vCPU, 2-GiB sandboxes built from a Python-based image with ClawEval and ZeroClaw installed.
- ZeroClaw is a lightweight Rust implementation of an OpenClaw-style harness. Both tested harnesses are used during training, so the ZeroClaw gains demonstrate compatibility and harness utilization, not transfer to an unseen harness.
5.2 Trajectory Collection and Curation
Claude Opus 4.6 synthesizes 192 tasks from Claw-Eval seeds and ClawHub workflows through proposal, environment and test generation, MiniMax-M2.5 solving, and refinement. The average synthesis cost is $4.9 per task.
- For each task, five MiniMax-M2.5 rollouts are sampled under the corresponding harness, and only successful trajectories are retained.
- A proxy LLM server records individual input–output calls, including those made by complex harnesses, then groups them into trajectories. The SFT set contains 561 trajectories and 4,537 training pairs.
- Appendix I illustrates the captured ZeroClaw format. This is a preliminary study with a small synthetic pool; the paper supplies no detailed decontamination analysis for synthesis from benchmark seeds.
5.3 Training Recipe
Orchard-Claw initializes Qwen3-30B-A3B-Thinking-2507 and performs one SFT epoch on proxy-recorded responses, masking inputs. SFT uses global batch size 16, 64K context, cosine-decayed learning rate from 10⁻⁵ to 10⁻⁶, and left truncation; inference extends context to 256K.
- RL assigns +1 to every recorded pair in a trajectory that passes all test scripts and −1 otherwise. Standard GRPO uses batch size 8, group size 8, and 150 training steps, with 64 asynchronous rollout sandboxes per step.
- Each rollout has a 10-minute wall-clock budget rather than a fixed step limit. Timed-out trajectories are aborted and excluded from training.
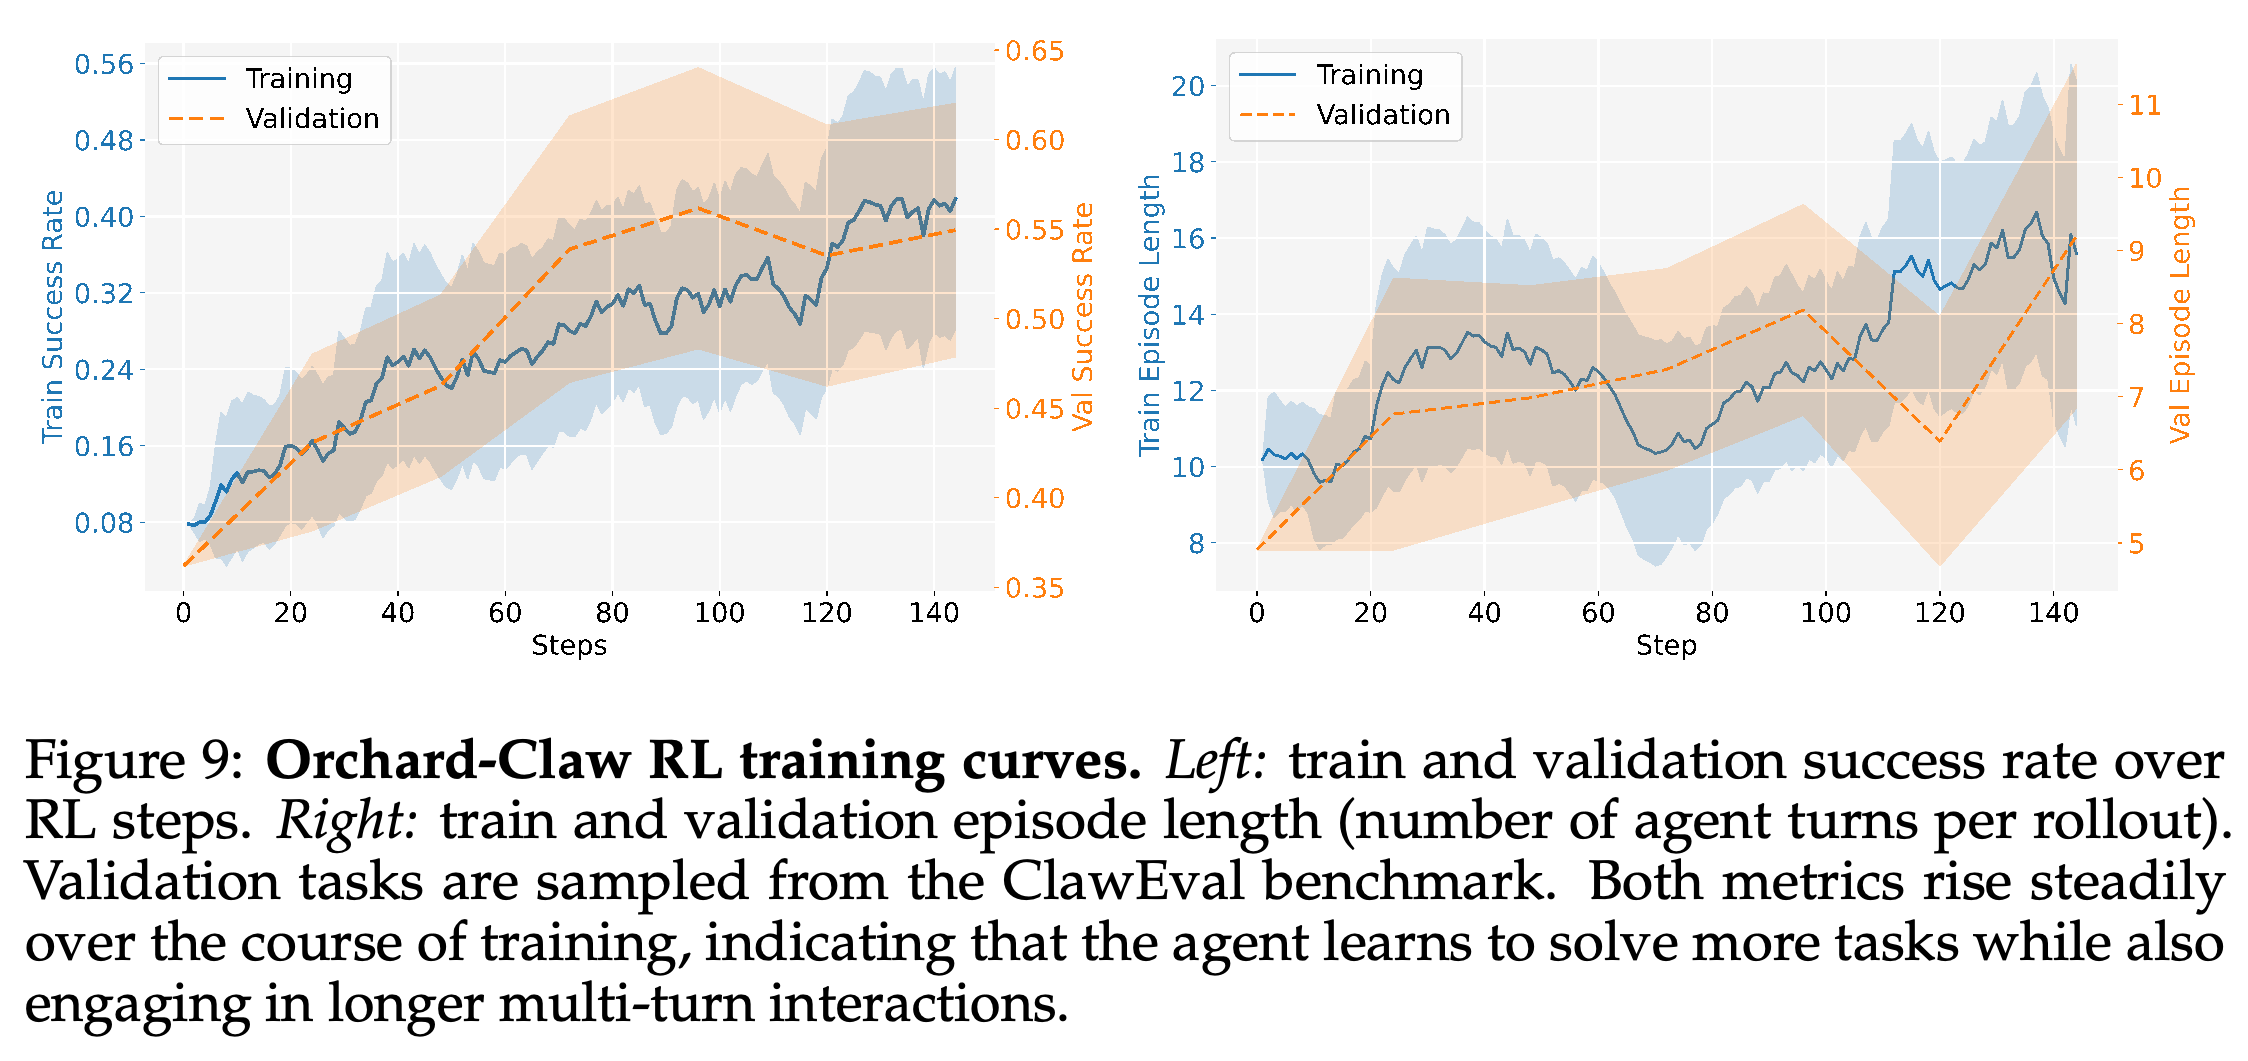
- Figure 9 shows increasing train and validation success alongside generally longer episodes. Training and validation use different axes, and the curves fluctuate; longer episodes alone do not establish greater efficiency.
Success generally improves while rollout lengths increase. Training and validation use separate vertical scales, and neither series is monotonic; longer episodes do not by themselves establish better efficiency. Validation tasks are sampled from ClawEval.
5.4 Main Results
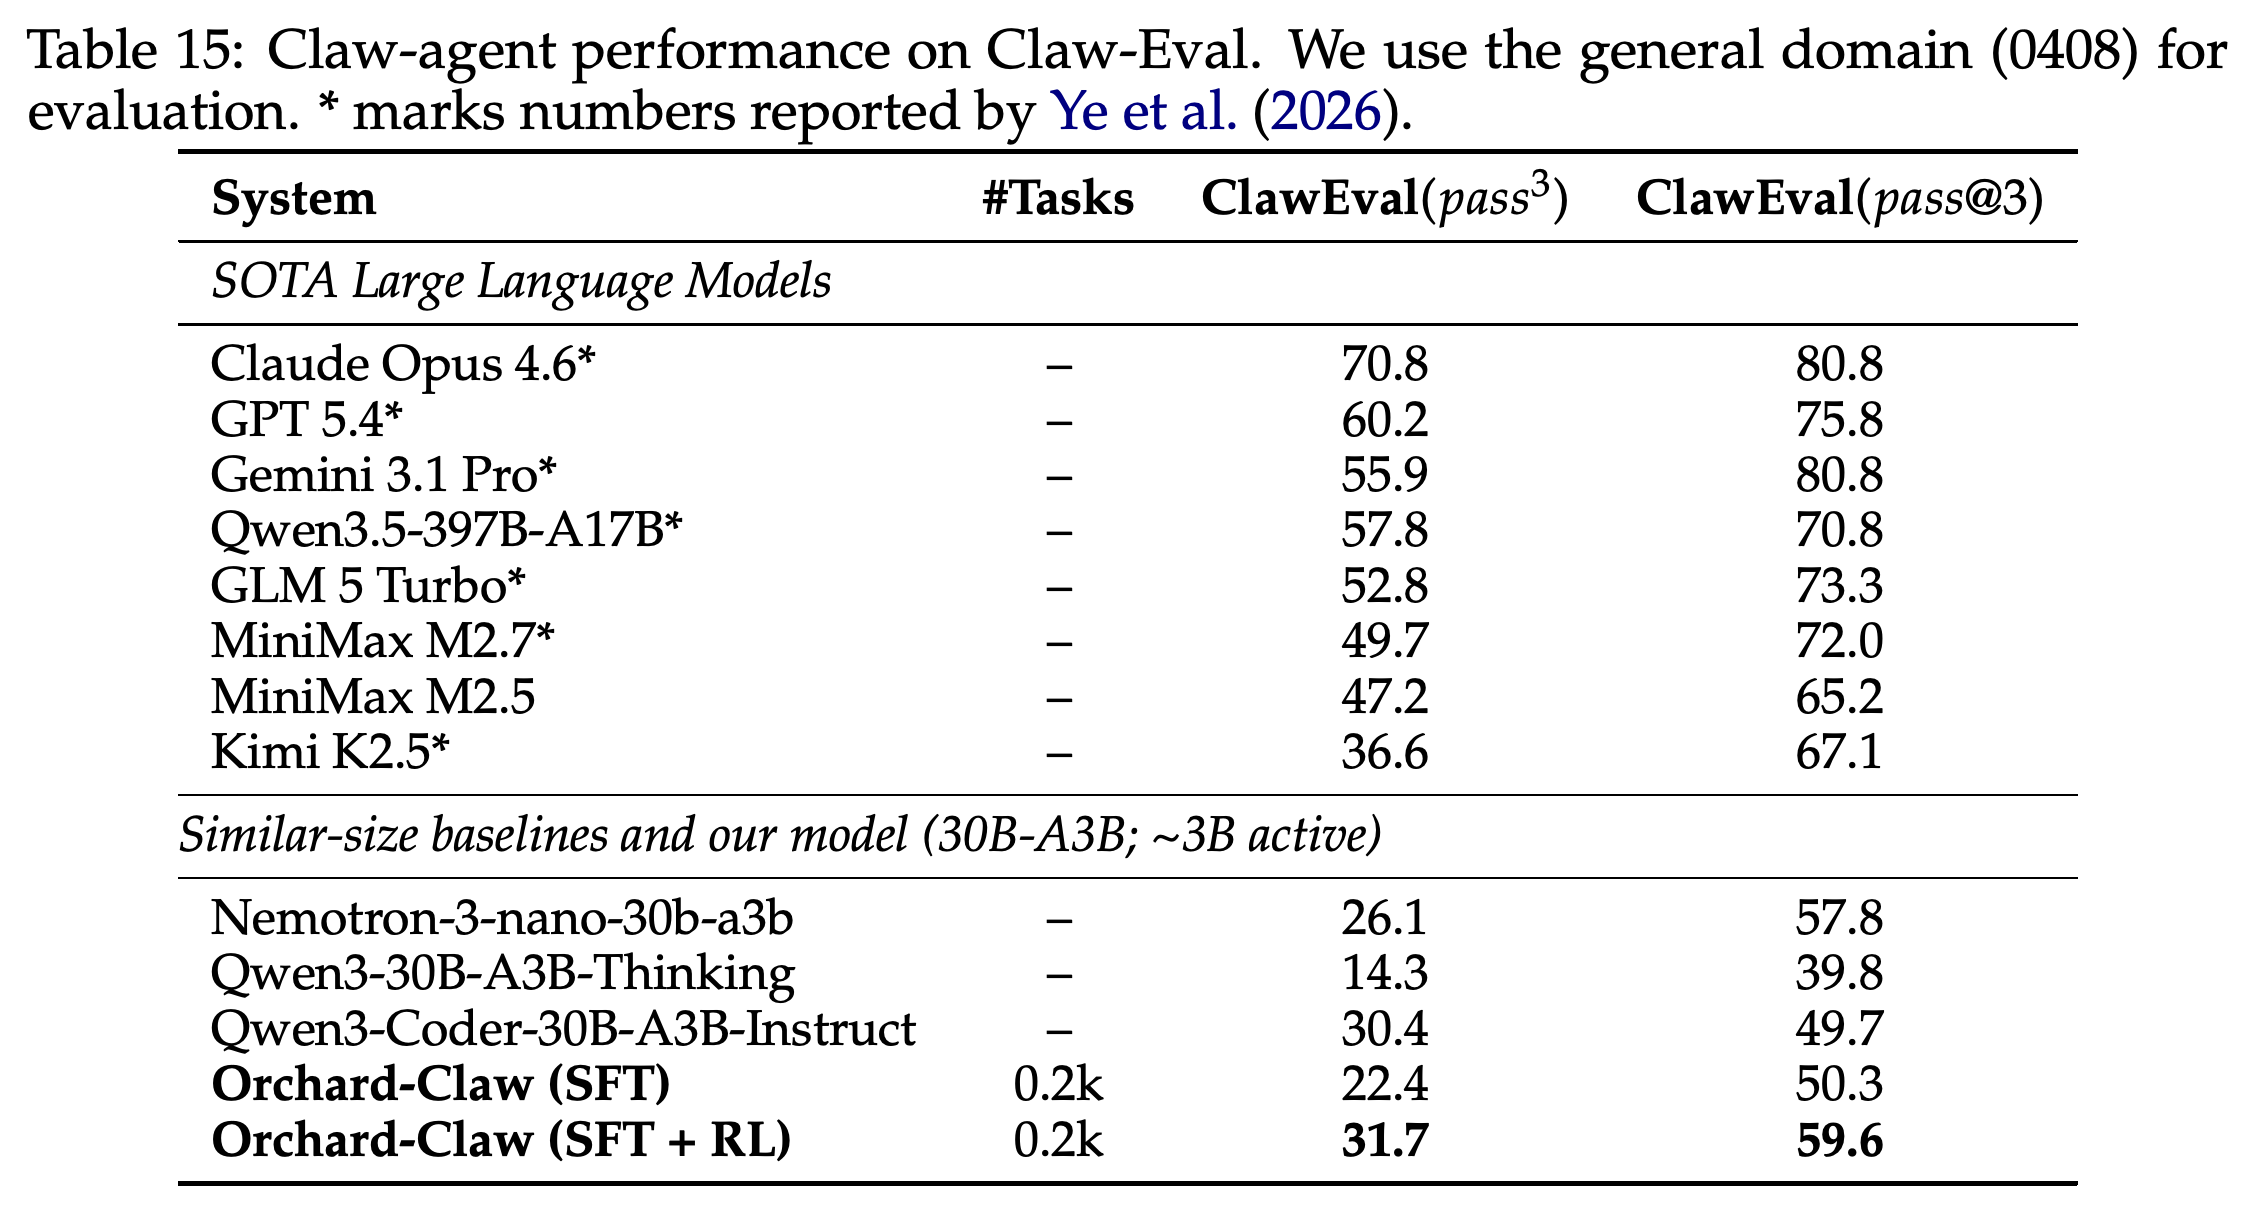
On Claw-Eval’s general domain (0408), Table 15 reports 31.7% pass³ and 59.6% pass@3 for Orchard-Claw under the native ReAct-style harness. The base model scores 14.3% and 39.8%, while SFT alone scores 22.4% and 50.3%.
- RL adds 9.3 points to both metrics relative to SFT. Orchard exceeds the similar-size Nemotron-3-nano-30b-a3b and Qwen3-Coder-30B-A3B-Instruct baselines in the table, but remains below the strongest large-model results.
- Table 16 shows that ZeroClaw raises the trained model to 41.0% pass³ and 73.9% pass@3, gains of 9.3 and 14.3 points over ReAct. The same harness change gives smaller or mixed improvements for the comparison models.
- The authors attribute stronger harness utilization to training with the target harnesses. The table does not isolate which ZeroClaw features, such as subagents or auto-compaction, cause the gains.
- Both pass³ and pass@3 are retained as distinct source metrics; the paper does not explicitly define their mathematical estimators.
SFT and RL progressively improve both reported Claw-Eval metrics using approximately 0.2K synthetic tasks. The final model exceeds the listed comparable-size baselines but remains below several larger systems, especially on pass³.
6 Related Work
Related work covers interactive environment orchestration, software-engineering agents, GUI and browser agents, and long-running Claw-style assistants. Orchard contributes a narrow reusable execution boundary and combines established SFT and group-relative RL with partial-progress supervision, reward-aware sampling, dense reward variants, and historical value-model training.
- MegaFlow and ProRL Agent exemplify integrated or partly decoupled rollout systems. E2B, Daytona, and Modal offer developer-facing sandbox or compute interfaces, while Orchard emphasizes researcher-controlled Kubernetes deployment.
- SWE-agent and OpenHands supply agent interfaces; SWE-smith, BugPilot, SWE-rebench, and Scale-SWE expand task or trajectory sources. Orchard uses real issue sources rather than introducing a SWE task synthesizer.
- Fara and MolmoWeb emphasize distilled GUI training data; UI-TARS and other GUI RL systems motivate reinforcement learning beyond imitation. Claw-Eval, ClawGym, MetaClaw, and OpenClaw-RL provide related evaluation, synthesis, and adaptation approaches.
7 Conclusion
The conclusion argues that scalable agent development requires both execution infrastructure and learning design. The three domain recipes demonstrate that one sandbox service can support distinct modalities, harnesses, supervision sources, and rewards without incorporating the trainer or harness into the environment API.
- The demonstrated reuse concerns an execution abstraction and training components, not a single policy or reward function transferred unchanged across SWE, GUI, and personal-assistant tasks.
Appendix
- A Orchard Env Design Details describes runtime injection through an init container and shared emptyDir volume, launching the copied runtime through /opt/sandbox-agent/start.sh. The implementation targets Linux container images and normally launches through sh -c; direct Pod-IP routing, default-deny egress policies with selective exceptions, heartbeat cleanup, and LIST+WATCH readiness complete the design.
- B Cost Analysis Details assumes 17 Azure Standard_D16ads_v5 instances: 16 sandbox nodes host eight sandboxes each, and one node runs the orchestrator. It contrasts approximately $0.165/hr spot with $0.824/hr on-demand pricing and lists managed-service compute and memory rates. The $673 total corresponds approximately to spot pricing for all 17 nodes, whereas the stated deployment uses an on-demand orchestrator; the reported total therefore does not follow that mixed-pricing setup.
- C Orchard RL Implementation Details extends slime with Ray orchestration, Megatron-LM training, SGLang inference, Orchard execution, and an asynchronous agentic loop driver. It describes pipelined rollout and training, assistant-token loss masking, layered timeouts and retries, resource escalation after exhaustion, and randomized creation jitter to reduce synchronized sandbox startup.
- D Orchard-SWE Prompt List provides the Value-Estimation Prompt and Process-Reward Grading Prompt. The former conditions values on known failure, requests an initial probability of 0.3–0.5 and a final probability below 0.2, and forbids monotonically increasing values. The latter requests evidence-based R1–R7 scores and limits reference use to grounding self-test relevance, coverage, and discriminativeness.
- E Orchard-SWE RPR Rubrics and Curves supplies the seven weighted dimensions in Table 17 and process-score trends in Figure 10. The plots show fix quality, self-test relevance, coverage, regression guarding, verification integrity, and aggregate judge reward, but do not separately plot Rigor or Discriminativeness.
- F Orchard-GUI Tool List gives full schemas under Pointer Actions: click / hover / drag; Keyboard Actions: write / press_keys; Page-Navigation Actions: scroll / goto_url / go_back / wait; Tab-Management Actions: new_tab / switch_tab / close_tab; and Termination Action: done. Coordinates are viewport-relative, scroll amount is bounded from 0.0 to 1.0, switch_tab uses a 0-based tab_index, and done requires a response string for completion or failure reporting.
- G Example GUI Agent Trajectory includes Inputs to LLM – full trajectory (last turn, 1 context image) and Example response from LLM at the last turn. The Amazon task seeks a washable dog bed at least 30 inches long; the trace navigates search and filtering, inspects an EHEYCIGA product, and ends with a response reporting dimensions of 35 × 23 × 3.5 inches. This is an illustrative trace, not an additional aggregate performance experiment.
- H Orchard-GUI Task Filtering Pipeline records the successive pool sizes 292,092 → 278,252 → 254,815 → 254,404 → 140,055 → 15,601. It removes benchmark splits, child tasks, WebVoyager intent overlap, unsuitable websites, and intents whose cosine similarity to a retained task exceeds 0.99 under Qwen/Qwen3-Embedding-8B. This threshold wording differs from the ≥ 0.99 wording in the main figure caption.
- I Example Claw Agent Trajectory provides Example Model Input in the ZeroClaw Harness and Example Response from LLM. The inventory workflow uses gmail_list_messages, gmail_get_message, and inventory_list_products, flags restocking costs exceeding $1000 as HIGH PRIORITY, and plans a summary at /home/user/rotation_plan.txt. The excerpt demonstrates proxy-recorded multi-tool context but stops before the workflow is completed.
Brief Thoughts
The main contribution is a reusable execution boundary tested through three concrete agent-training recipes. The latency and lifecycle tests support practical sandbox operation, while the controlled cross-harness matrix shows that infrastructure independence does not imply policy independence: learned tool formats and observation conventions remain important.
The training gains are substantial, but their interpretation depends on the comparison. Failed-trace supervision is not tested against an equal addition of resolved data; RPR process improvements are measured with the training rubric; and value-model reranking trades additional inference rollouts for accuracy. Missing uncertainty estimates, incomplete cost accounting, inconsistent reported details, and remaining harness-transfer losses limit claims of general efficiency or harness independence.