


PaliGemma 2: A Family of Versatile VLMs for Transfer | Summary
04 Dec 2024 | Paper Review Vision-Language Models Multimodal Pretraining Supervised Fine-TuningContents
- Summary
- 1. Introduction
- 2. Related work
- 3. Model
- 4.1. Investigating model size and resolution
- 4.2. Text detection and recognition
- 4.3. Table structure recognition
- 4.4. Molecular structure recognition
- 4.5. Optical music score recognition
- 4.6. Generating long, fine-grained captions
- 4.7. Spatial reasoning
- 4.8. Radiography report generation
- 4.9. CPU inference and quantization
- 5. Conclusion
- Appendix
- Brief Thoughts
This article explains the key points of PaliGemma 2: A Family of Versatile VLMs for Transfer.
- 2024-12-04 (arXiv)
- Steiner, Andreas, Pinto, André Susano, Tschannen, Michael, Keysers, Daniel, Wang, Xiao, Bitton, Yonatan, Gritsenko, Alexey, Minderer, Matthias, Sherbondy, Anthony, Long, Shangbang, et al.
- Google DeepMind
- Paper
Summary
- Adapting a vision-language model, which processes images and generates text, requires choosing how much computation to spend on image detail and language-model capacity during fine-tuning, or further training on a target task. Across 30+ academic benchmarks, PaliGemma 2 improves average task scores over PaliGemma at matched 3B model size and resolution by 0.65 at 224px² and 0.85 at 448px², with larger variants providing additional, task-dependent gains; B denotes billion parameters.
- The family combines SigLIP-So400m, an image encoder that converts images into numerical representations, with Gemma 2 language models to produce 3B, 10B, and 28B variants at three image resolutions. Controlled comparisons show that text-heavy tasks often benefit most from higher resolution, whereas multilingual and visual reasoning tasks often benefit more from a larger language model; larger models generally favor smaller fine-tuning learning rates.
- Task-specific fine-tuning improves reported results in text recognition, table extraction, molecular drawings, music transcription, detailed captioning, and chest X-ray reports under the paper’s respective evaluation protocols. Scaling from 10B to 28B often gives little improvement. On the reported COCO and DocLayNet detection transfers, performance trails specialized detectors. The quantization study, which tests reduced-precision model storage, covers five tasks with one fine-tuning run per task.
1. Introduction
The paper replaces PaliGemma’s Gemma language component with Gemma 2 while retaining its image encoder and three-stage training recipe. Its open-weight checkpoints, whose learned parameters are released, are intended for downstream fine-tuning on image captioning, visual question answering, which answers questions about images, short-video tasks, and referring segmentation, which predicts a mask for an object described in text.
2. Related work
Related work traces the development from separately encoded image and text representations to systems combining pretrained vision encoders and language models. The paper studies image resolution and language-model size jointly under a shared fine-tuning recipe, reducing the architectural and training differences that complicate comparisons across unrelated model families.
3. Model
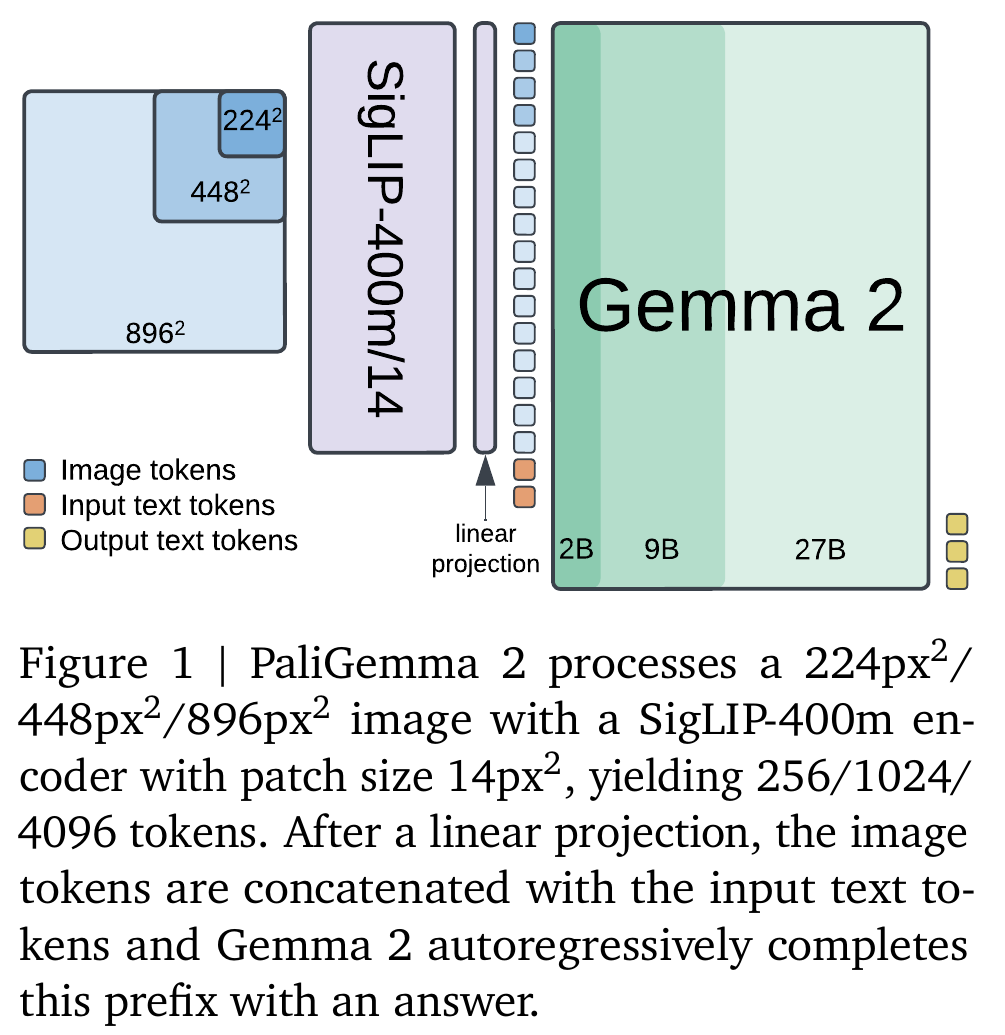
A linear projection maps SigLIP-So400m’s image representations into Gemma 2’s input space; the model then generates answer tokens, or sequence units, autoregressively, predicting each from the preceding sequence. Images at 224px², 448px², and 896px² produce 256, 1024, and 4096 visual tokens, respectively, using a patch size of 14px². The 2B, 9B, and 27B language components yield total parameter counts of 3.0B, 9.7B, and 27.7B.
Stage 1 jointly trains all parameters on 1 billion multimodal examples at 224px²; Stage 2 continues for 50 million examples at 448px² and 10 million at 896px², upweighting tasks needing visual detail and allowing longer outputs. Stage 3 fine-tunes the corresponding checkpoint on a target task; the training mixture includes captioning, text reading, visual question answering, detection, and segmentation, with many labels generated by publicly available specialist models. Training uses Adam, an adaptive optimizer; Stages 1 and 2 use learning rates of 10⁻⁵ for 3B and 5 × 10⁻⁶ for 10B and 28B, while logits soft-capping, which limits attention and output score magnitudes, is disabled during Stage 3 because it harmed some transfer results.
The variants retain the same image-encoder-to-language-model interface. Increasing resolution lengthens the visual token sequence, explaining why resolution increases computation inside the language model even when the encoder architecture stays the same.
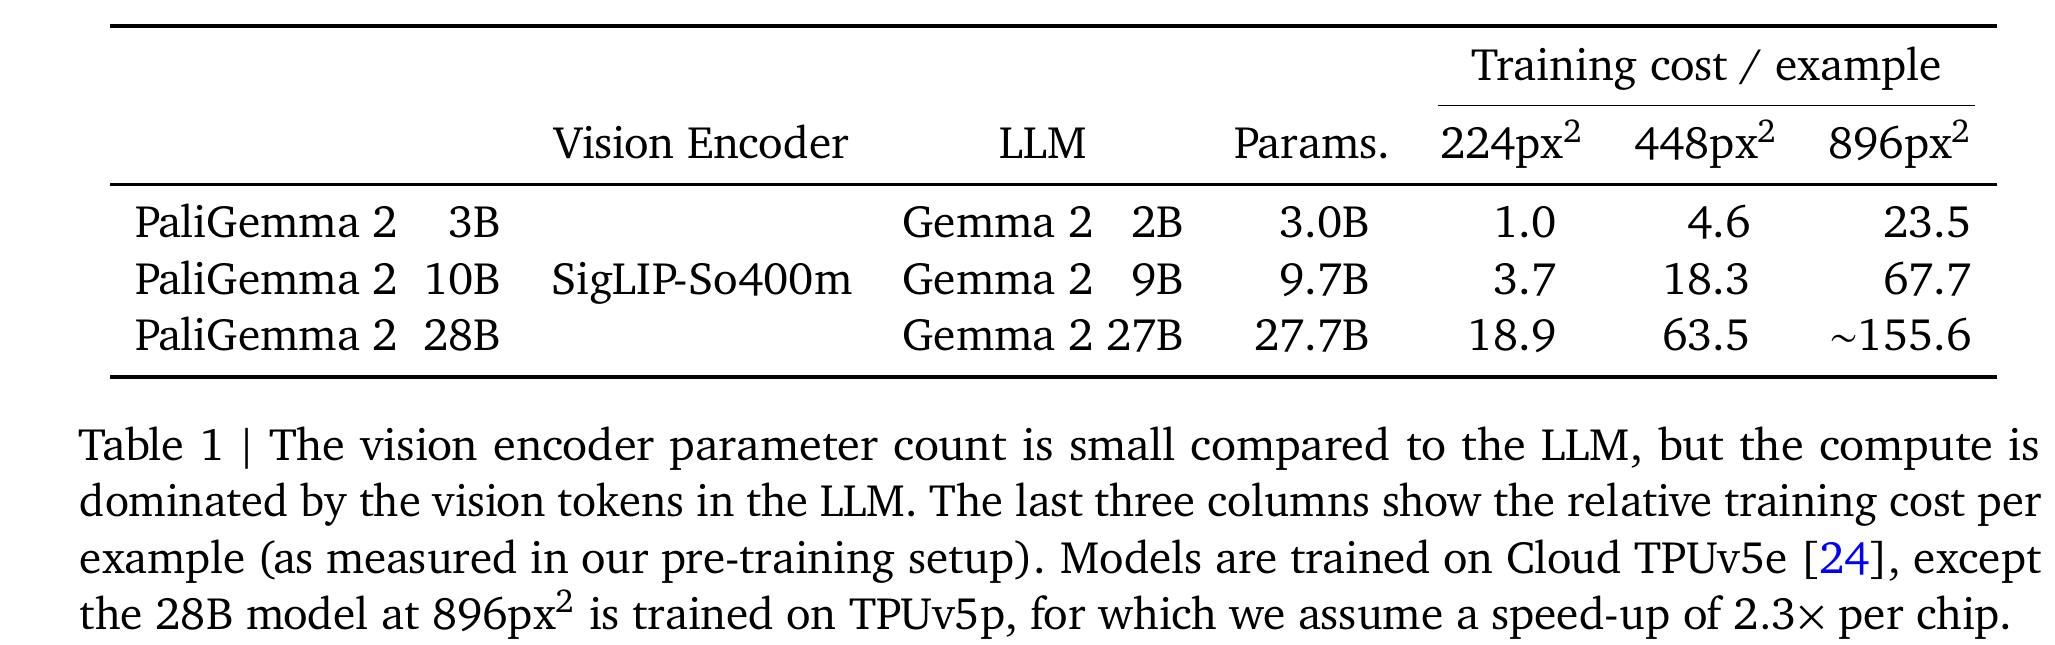
Relative training cost rises from 1.0 for 3B at 224px² to 4.6 at 448px² and 23.5 at 896px². The approximately 155.6 cost for 28B at 896px² incorporates an assumed 2.3× per-chip speed-up for TPUv5p, so it is not a direct same-hardware measurement.
4.1. Investigating model size and resolution
The experiments extend earlier PaliGemma benchmarks with text and table recognition, molecules, music, detailed captions, spatial reasoning, and radiography reports; Appendices A and B provide examples and transfer details. The main scaling study fine-tunes 3B, 10B, and 28B models at 224px² and 448px² on the 30+ earlier benchmarks, retains their task settings, and sweeps learning rates in {0.03, 0.06, 0.1, 0.3, 0.6, 1.0, 3.0} × 10⁻⁵. For most tasks, it sweeps at 224px², selects a learning rate for each task and model size using validation data, and reuses that choice at both resolutions. Table 13 reports means and standard deviations over five fine-tuning runs.
4.1.1. Effect on task performance
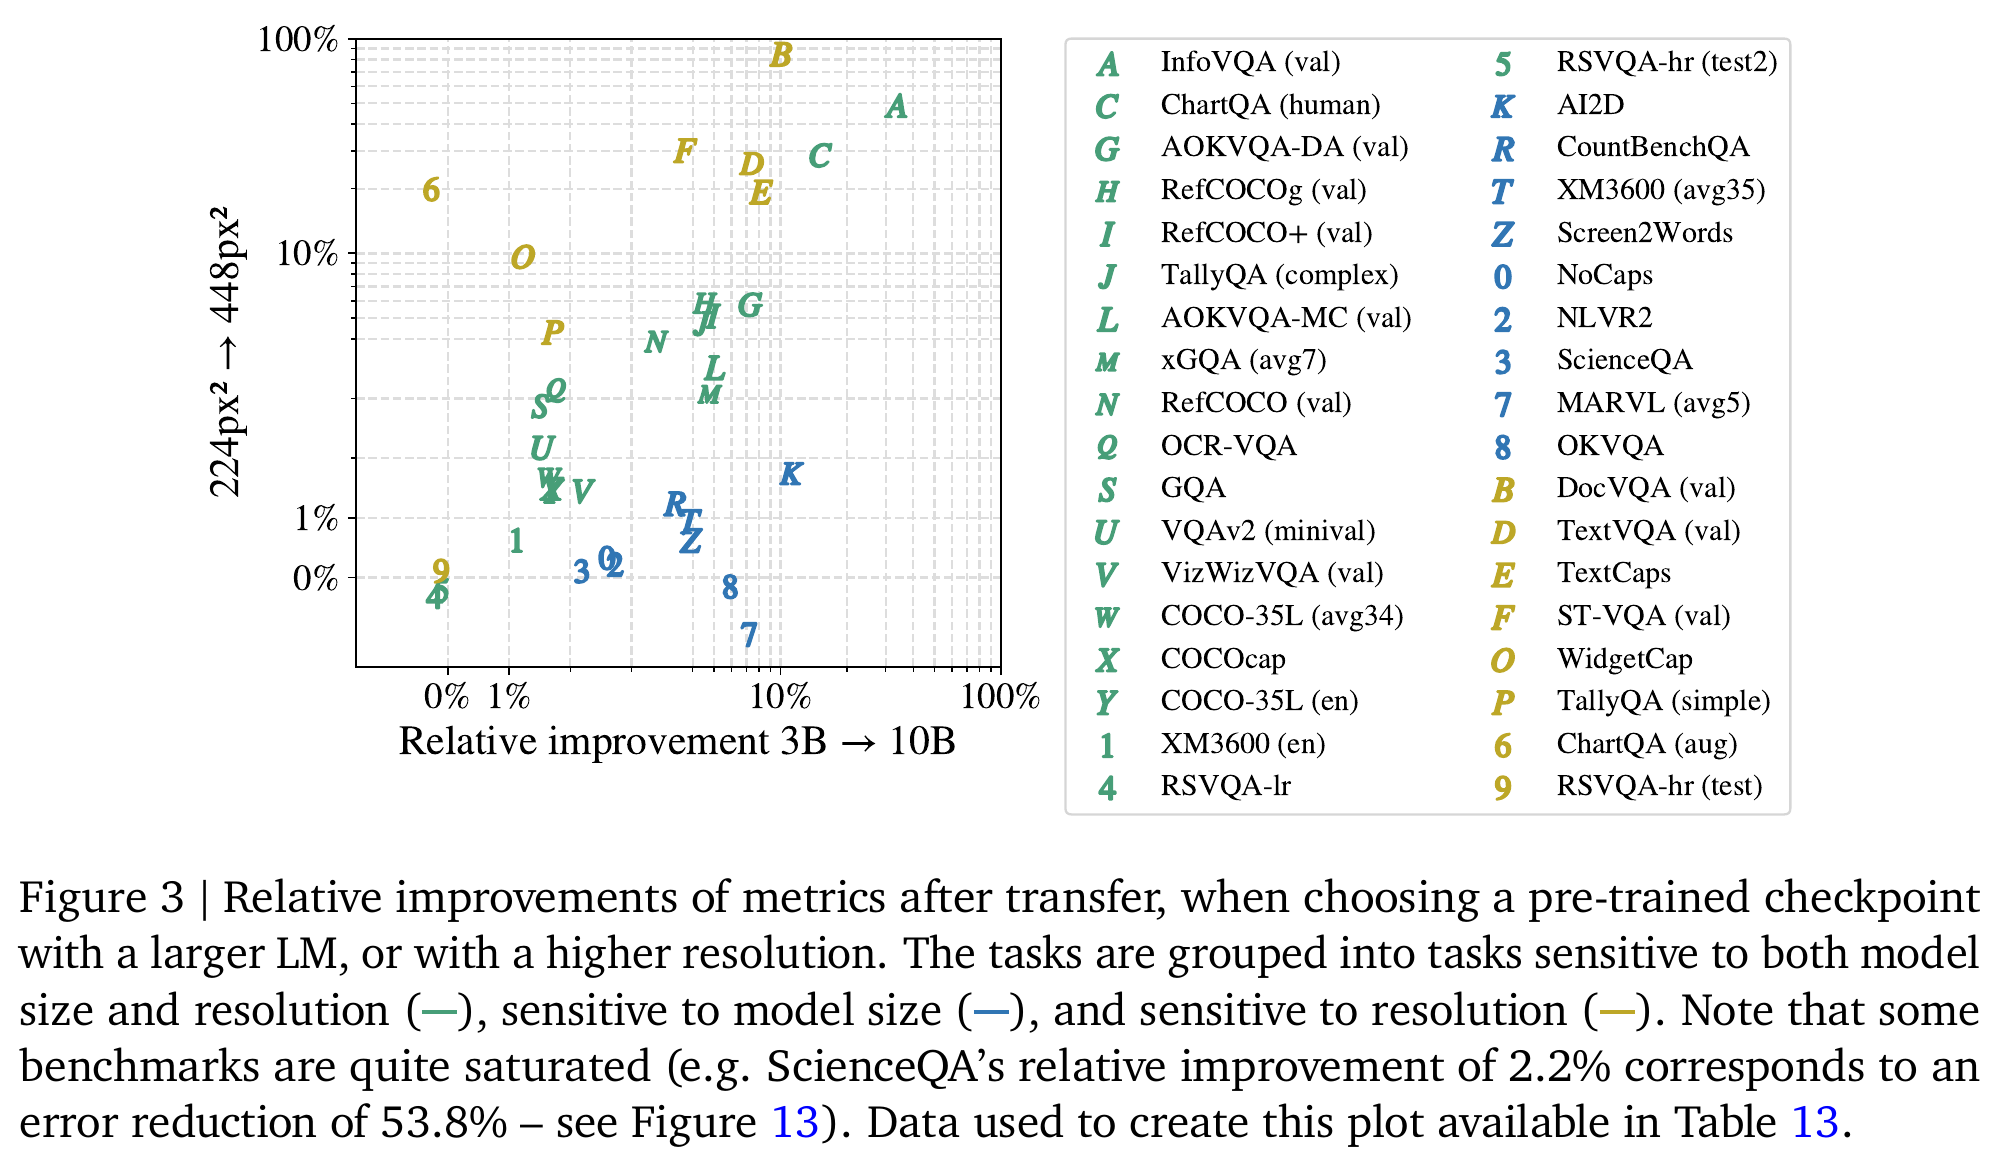
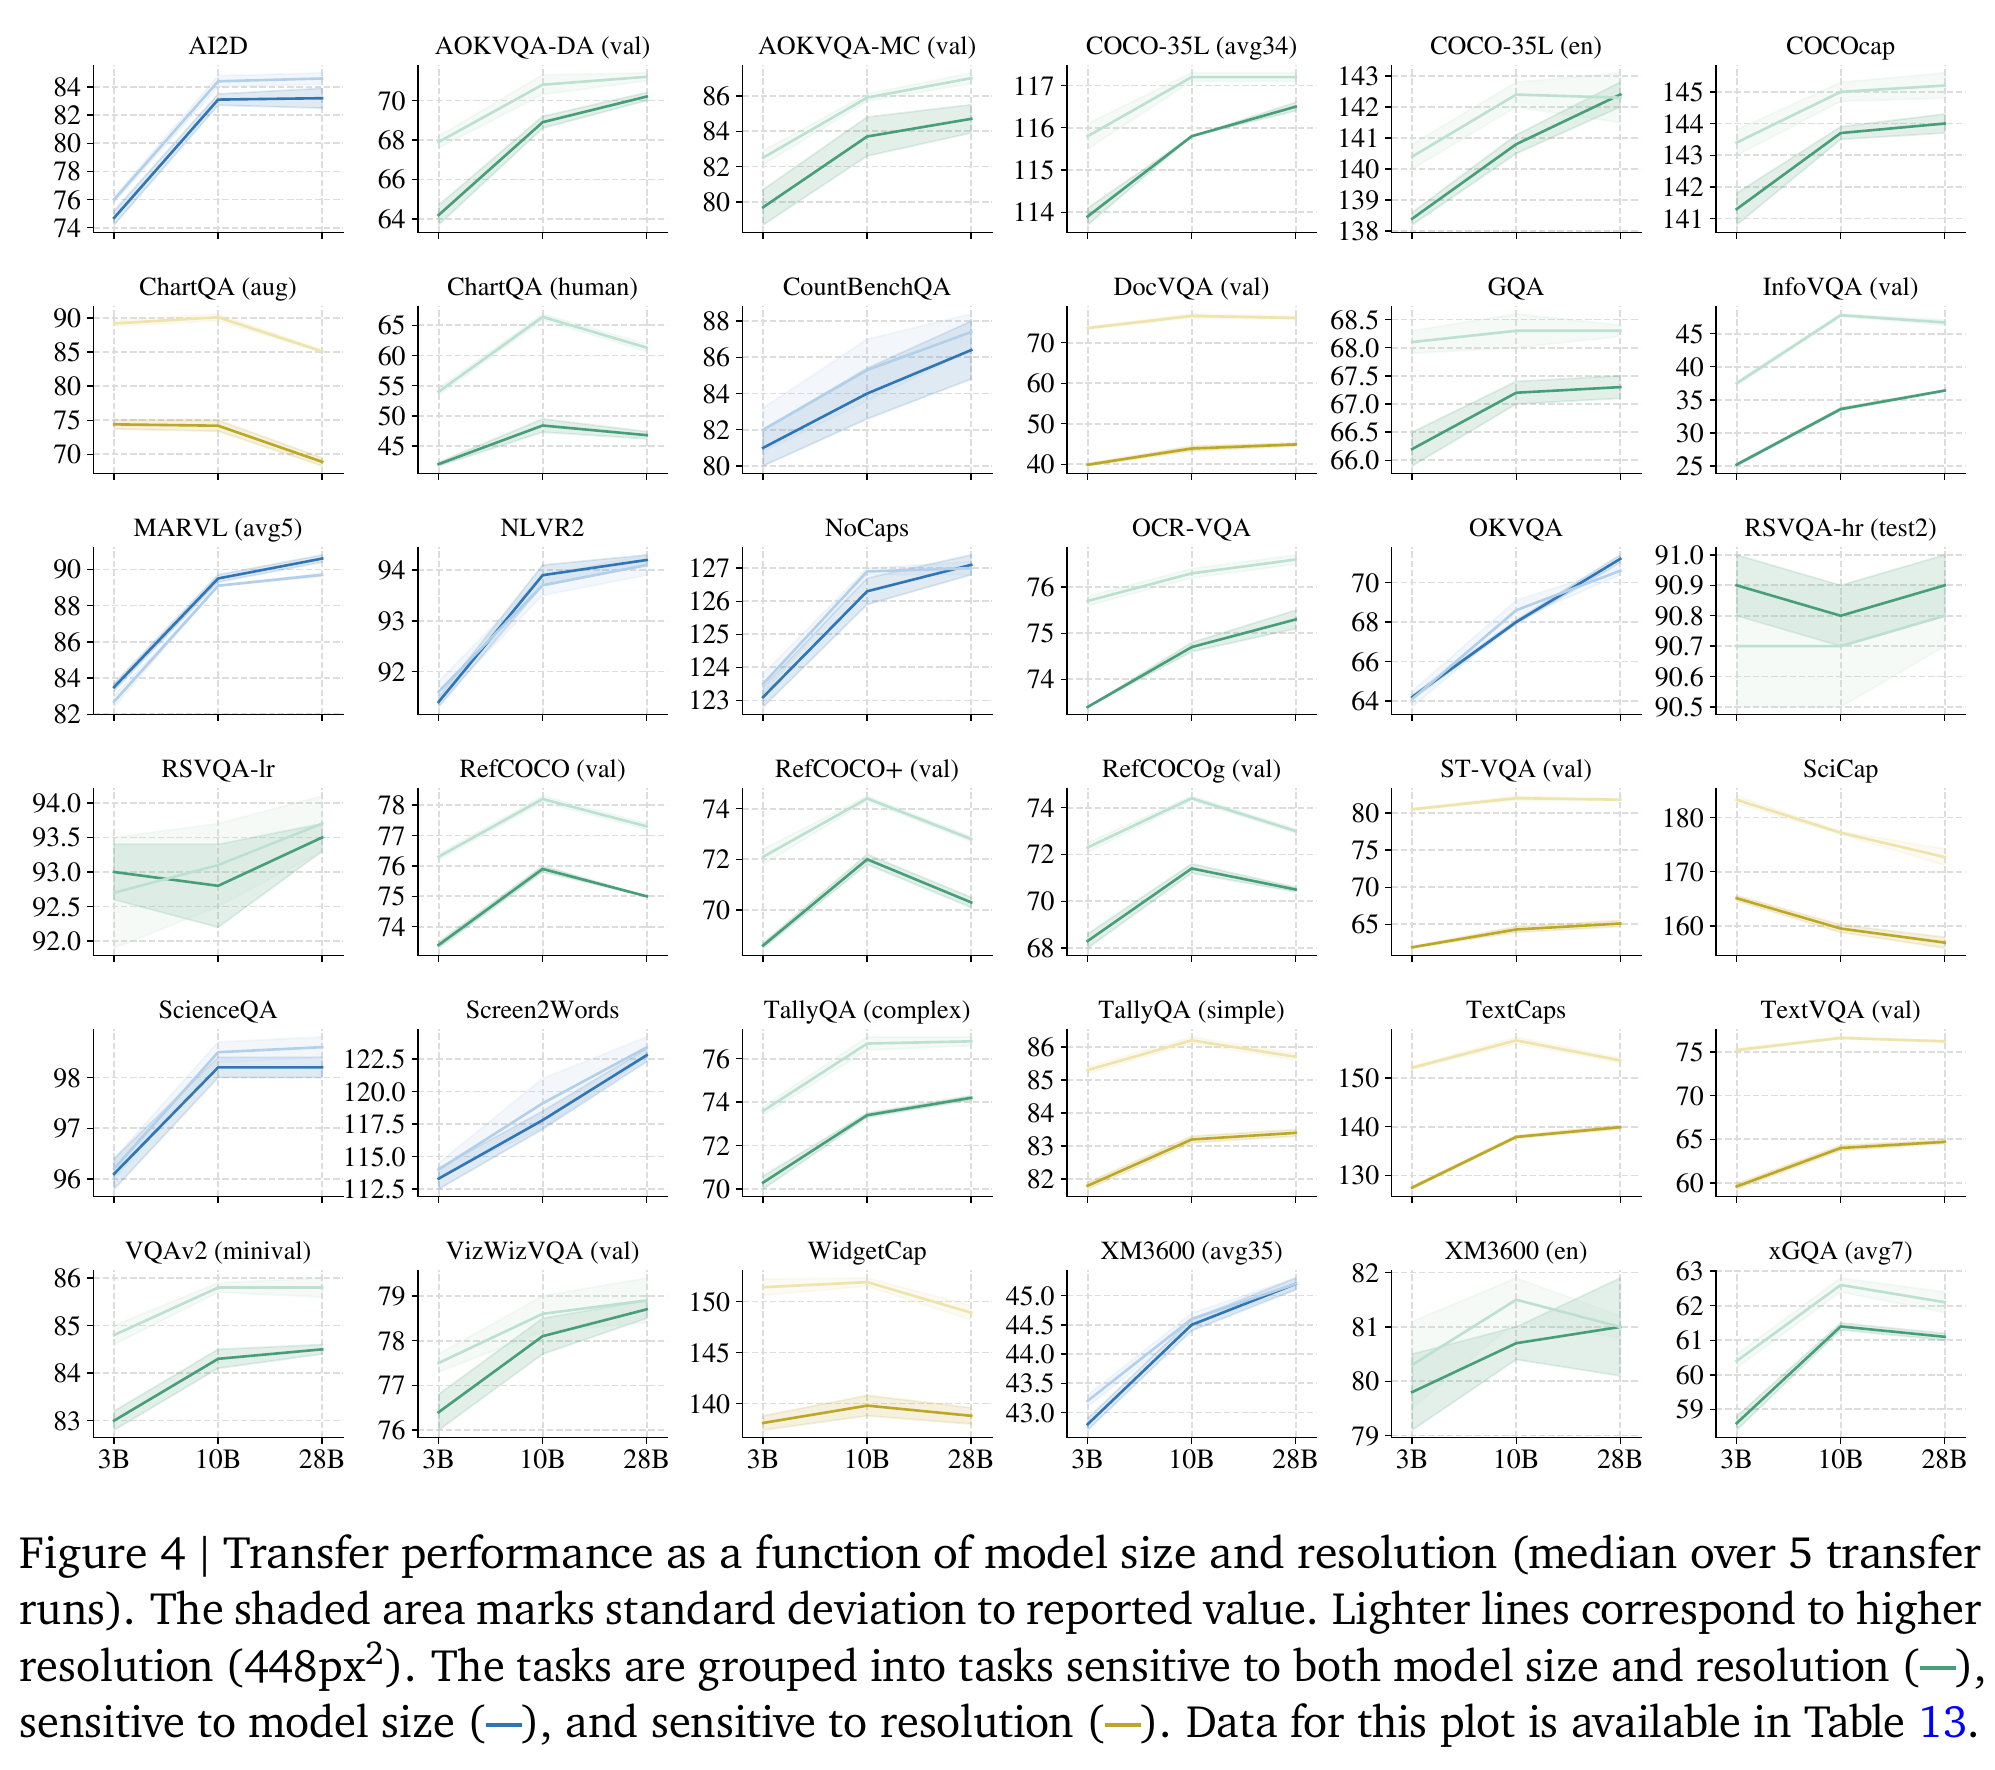
Starting from 3B at 224px², increasing model size to 10B requires 3.7× more floating-point operations, while increasing resolution to 448px² requires 4.6× more. Text, document, screen, and chart tasks generally favor higher resolution; multilingual captioning and several reasoning tasks favor larger language models. Further scaling to 28B often yields modest gains, plateaus, or regressions; the authors suggest that the smaller Gemma 2 models’ distillation, or training from a larger model’s predictions, may help explain their transfer behavior relative to the separately trained 27B model, but do not test this explanation.
The scatterplot separates tasks that favor higher resolution from those that favor a larger language model. Its comparisons use similar but unequal compute increases, 4.6× and 3.7×, so they do not measure gains under exactly matched computation.
The task-level curves reveal plateaus and regressions: several referring-expression tasks, which identify objects from text, peak at 10B, while SciCap, a scientific-figure captioning benchmark, decreases with model size. Higher resolution strongly improves several document and text tasks across sizes; the caption specifies medians over five runs with standard-deviation shading.
4.1.2. Model size and transfer learning rate
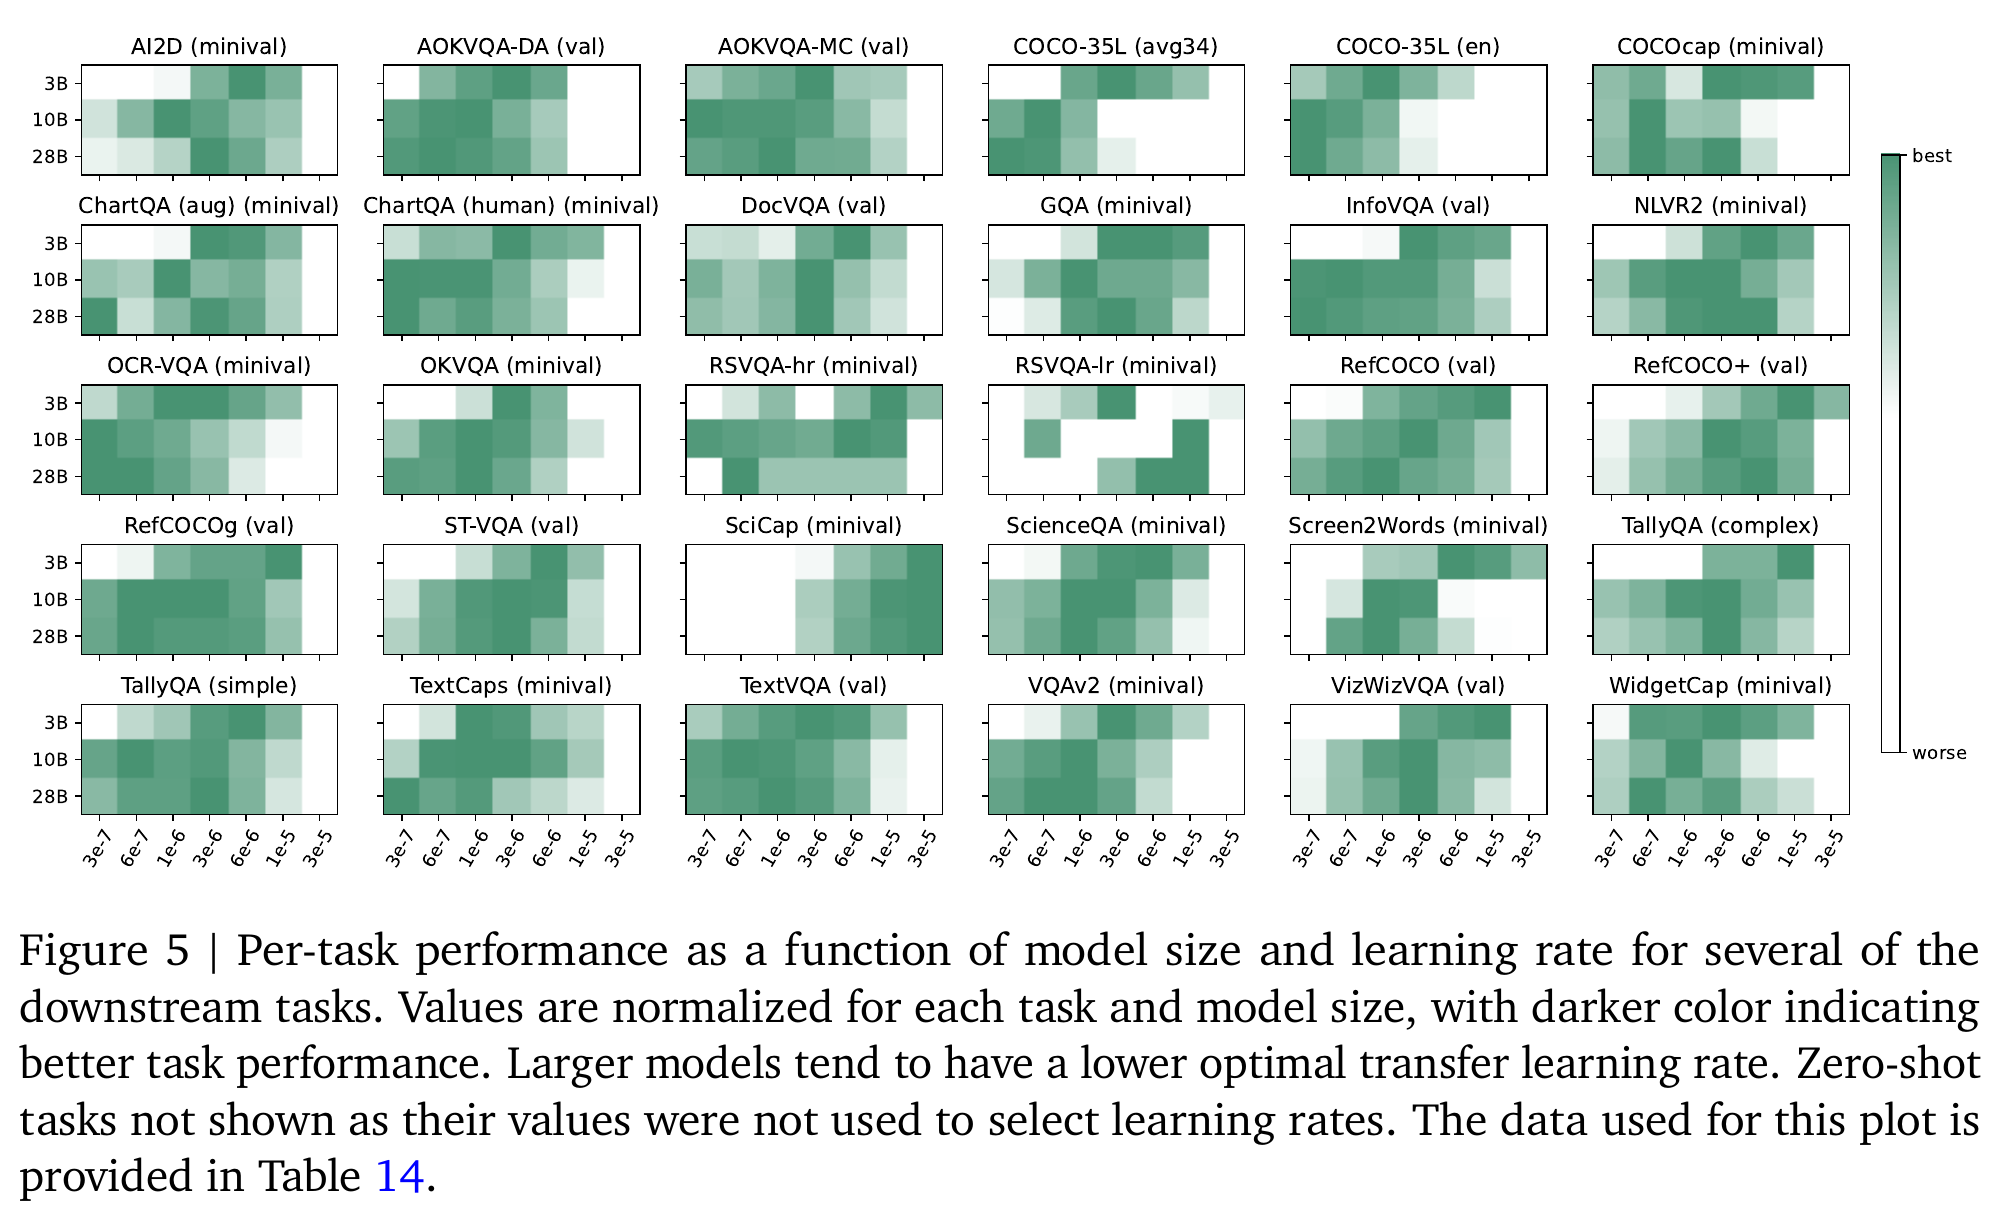
The learning-rate sweeps show a general shift toward smaller optimal rates as model size increases, supporting the recommendation to sweep smaller rates when scaling. The trend varies by task, and PaliGemma 2 3B also generally prefers smaller rates than the original PaliGemma.
Darker cells frequently move toward smaller learning rates for larger models, supporting retuning when scaling. Values are normalized within each task and model size, so color intensity cannot compare absolute performance across model sizes.
4.1.3. Using Gemma 2 instead of Gemma 1
At matched 3B size and image resolution, replacing Gemma with Gemma 2 improves average benchmark scores by 0.65 at 224px² and 0.85 at 448px². Table 15 also records regressions, including decreases of 4.3 and 5.6, respectively, on Screen2Words, a mobile-screen description benchmark.
4.2. Text detection and recognition
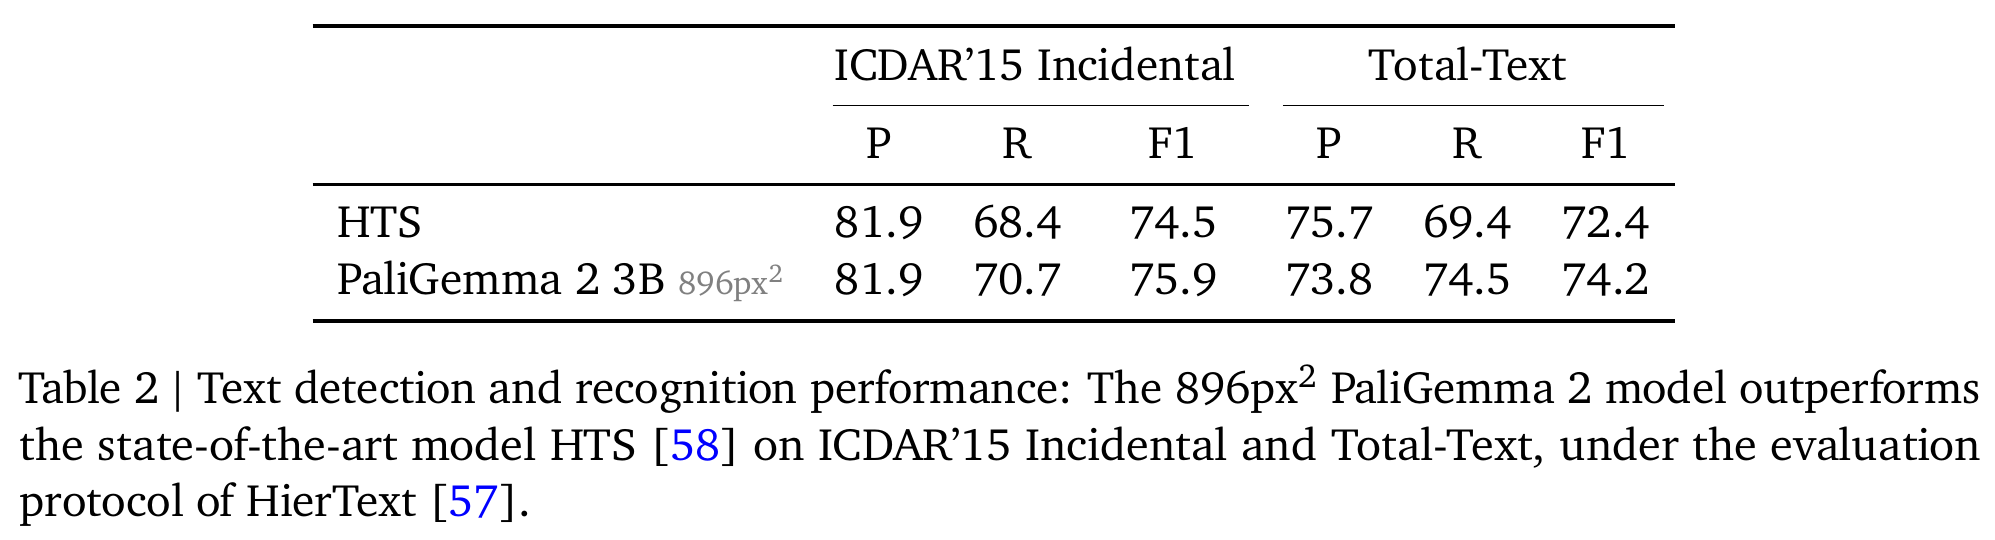
For optical character recognition, or OCR, the model outputs word transcriptions paired with bounding boxes after training on a mixture of seven text-recognition datasets. Under the HierText protocol, a prediction must match the transcription exactly and achieve intersection over union, the overlap area divided by the union area of the boxes, of at least 0.5; case and punctuation are not normalized, and words are not filtered by length. At 896px², PaliGemma 2 3B obtains F1, the harmonic mean of precision and recall, of 75.9 on ICDAR’15 Incidental and 74.2 on Total-Text, compared with Hierarchical Text Spotter (HTS) scores of 74.5 and 72.4; lower resolution substantially reduces quality, while larger models do not improve it.
The model improves F1 on both benchmarks, but its Total-Text precision decreases from 75.7 to 73.8 while recall increases from 69.4 to 74.5. Thus, the higher F1 accompanies a tradeoff between correctly recognizing more words and the fraction of predictions that are correct.
4.3. Table structure recognition
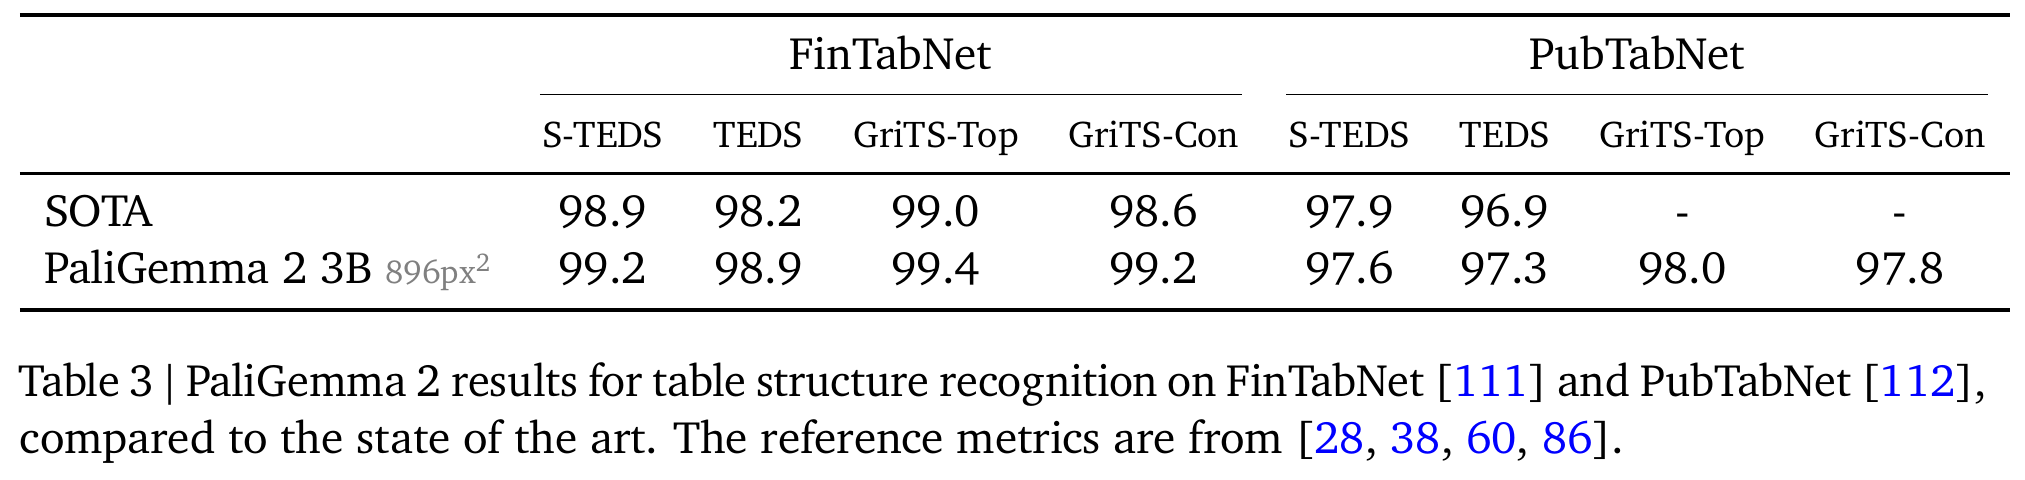
Table structure recognition generates table text, cell coordinates, and HTML, the markup used here to encode table structure, using training splits from PubTabNet’s 516k images and FinTabNet’s 113k tables. Evaluation uses Tree Edit Distance Similarity, or TEDS, which compares table representations, and Grid Table Similarity, or GriTS, which assesses cell structure and content. Compared with prior state-of-the-art results, the 3B model at 896px² improves FinTabNet TEDS from 98.2 to 98.9 and PubTabNet TEDS from 96.9 to 97.3, but PubTabNet structure-only TEDS decreases from 97.9 to 97.6; larger models add no reported benefit, and lower resolution slightly reduces quality.
FinTabNet improves on all four listed metrics, while PubTabNet improves full TEDS but decreases structure-only TEDS. Missing prior PubTabNet GriTS values prevent a direct comparison on those columns.
4.4. Molecular structure recognition
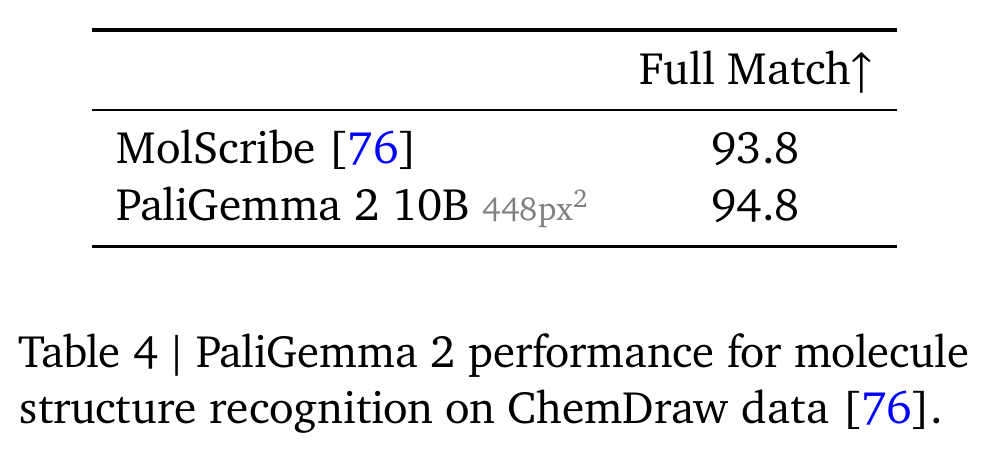
Molecular structure recognition converts drawings into SMILES strings, a textual representation of molecular graphs. Training uses 1 million PubChem molecules rendered with the Indigo chemistry toolkit and varied drawing styles; evaluation uses the same 5.7k synthetic ChemDraw images as MolScribe, a molecular-recognition baseline. PaliGemma 2 10B at 448px² achieves 94.8% exact match versus MolScribe’s 93.8%, with no further gain from higher resolution.
The 10B model at 448px² improves exact molecular match by 1.0 percentage point over MolScribe on the shared ChemDraw evaluation. The result concerns synthetic rendered drawings.
4.5. Optical music score recognition
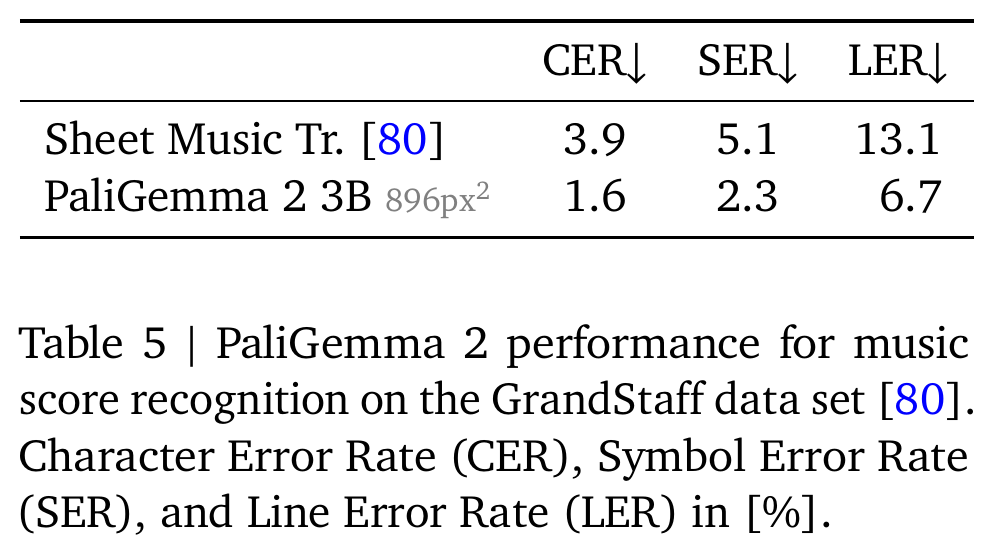
Optical music score recognition translates single-line pianoform images into **kern, a representation encoding pitch, duration, articulation, and barlines. On GrandStaff’s 53.7k images with official splits, training includes original and synthetically augmented images, while evaluation uses undistorted originals. The 3B model at 896px² reduces character, symbol, and line error rates, edit-distance measures computed at those respective units, to 1.6%, 2.3%, and 6.7%, from the Sheet Music Transformer’s 3.9%, 5.1%, and 13.1%; increasing to 10B does not further reduce errors.
All three music-transcription error measures decrease with the 3B model at 896px². The 6.7% line-level edit error remains higher than the 1.6% character-level error; these are edit-distance measures at different units, not percentages of completely incorrect examples.
4.6. Generating long, fine-grained captions
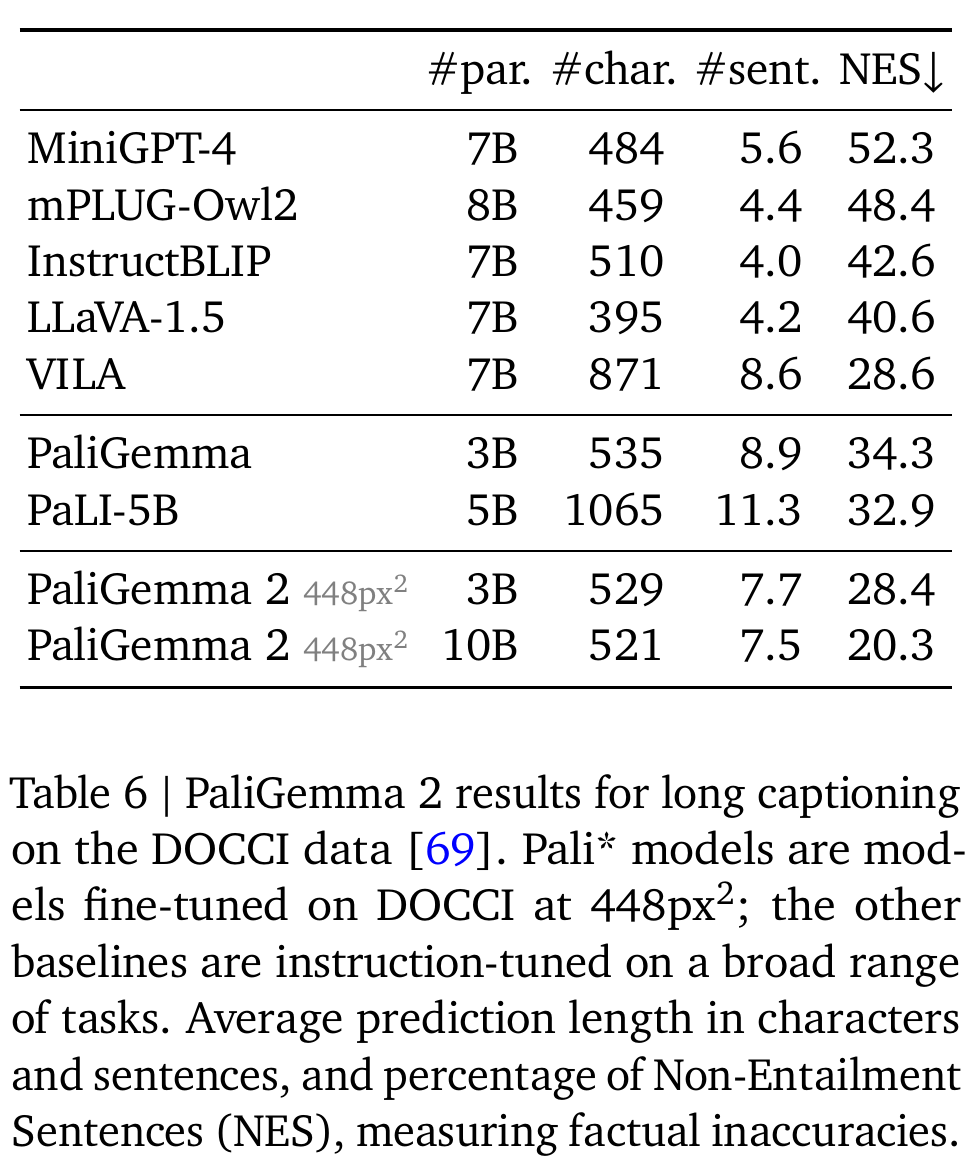
Detailed captioning uses DOCCI, Descriptions of Connected and Contrasting Images, containing 15k images with human-written English descriptions averaging 7.1 sentences. At 448px², the 10B model produces 20.3% non-entailment sentences, meaning sentences rated Neutral or Contradiction, versus 34.3% for PaliGemma and 28.4% for PaliGemma 2 3B. The protocol selects initial checkpoints using test-split perplexity, a measure of how well the model predicts reference text, evaluates factuality on the 100-image qual_dev split with maximum decoding length 192, then retrains selected configurations on train plus test and evaluates again on qual_dev; the final factuality evaluation therefore reuses images involved in model selection.
The 10B model’s 20.3% non-entailment rate accompanies 521 characters and 7.5 sentences on average, compared with PaliGemma’s 535 characters, 8.9 sentences, and 34.3%. The non-Pali baselines use instruction tuning across many tasks, so their comparison with DOCCI-fine-tuned models does not isolate architecture.
4.7. Spatial reasoning
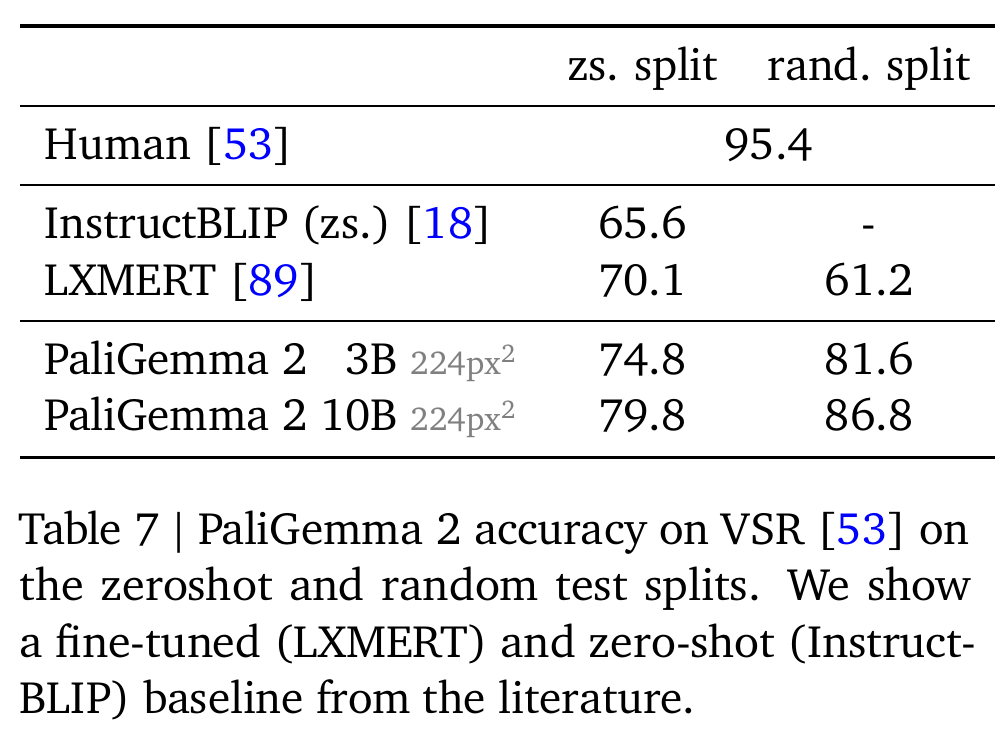
Visual Spatial Reasoning, or VSR, tests whether statements about relationships between objects are true or false, addressing failure cases such as negation that some localization benchmarks miss. At 224px², fine-tuned PaliGemma 2 10B achieves 79.8% accuracy on the zero-shot test split and 86.8% on the random test split, compared with the fine-tuned cross-modal encoder baseline LXMERT’s 70.1% and 61.2%. Here “zero-shot” names the benchmark split rather than evaluation without PaliGemma 2 fine-tuning; larger models help, while resolution above 224px² does not.
Scaling from 3B to 10B improves accuracy on both VSR splits, but the 86.8% random-split result remains below the reported human accuracy of 95.4%. The table distinguishes InstructBLIP evaluated without task-specific fine-tuning from the fine-tuned systems.
4.8. Radiography report generation
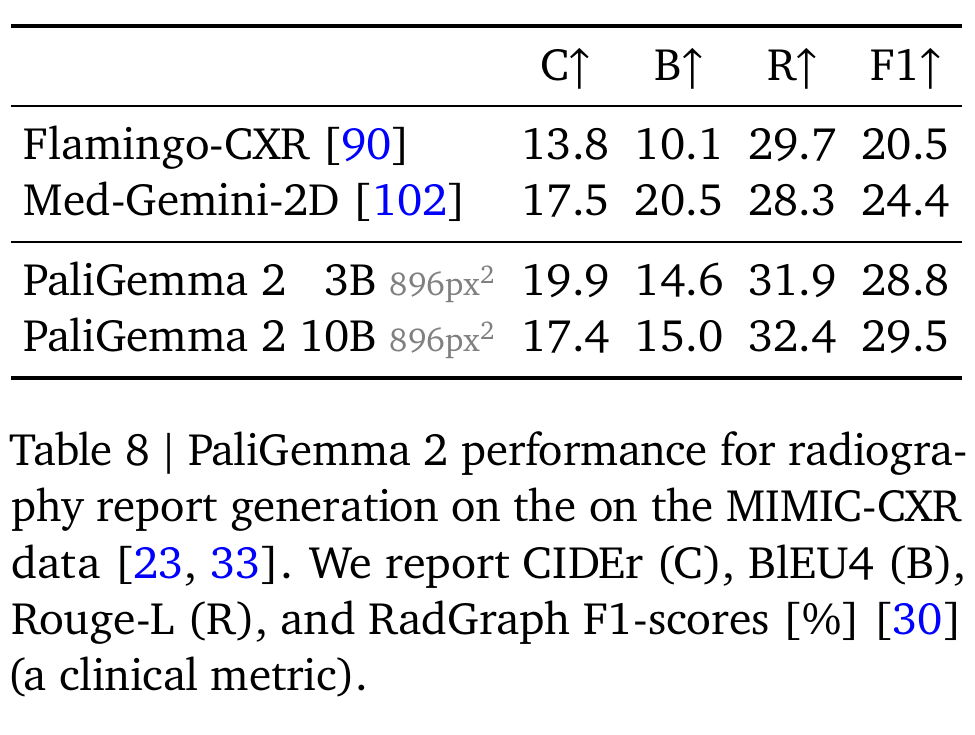
Chest X-ray report generation uses MIMIC-CXR, a dataset containing 377k images from 228k radiographic studies, with the same splits as Flamingo-CXR, an earlier report-generation system. Gemini 1.5 pro removes references to unavailable prior X-rays from the reports, and evaluation on test data held out during training and tuning includes RadGraph F1, which measures agreement in extracted clinical entities and relationships between generated and reference reports. At 896px², the 10B model reaches 29.5% RadGraph F1 versus 24.4% for Med-Gemini-2D and 20.5% for Flamingo-CXR, although Med-Gemini-2D retains the higher BLEU4 score, which measures four-word-sequence overlap with reference text.
PaliGemma 2 10B leads the listed systems in RadGraph F1 and Rouge-L, a reference-overlap metric based on the longest common subsequence. The 3B variant has the highest CIDEr, a caption-consensus metric based on weighted word-sequence overlap, while Med-Gemini-2D has the highest BLEU4, so no system leads every metric.
4.9. CPU inference and quantization
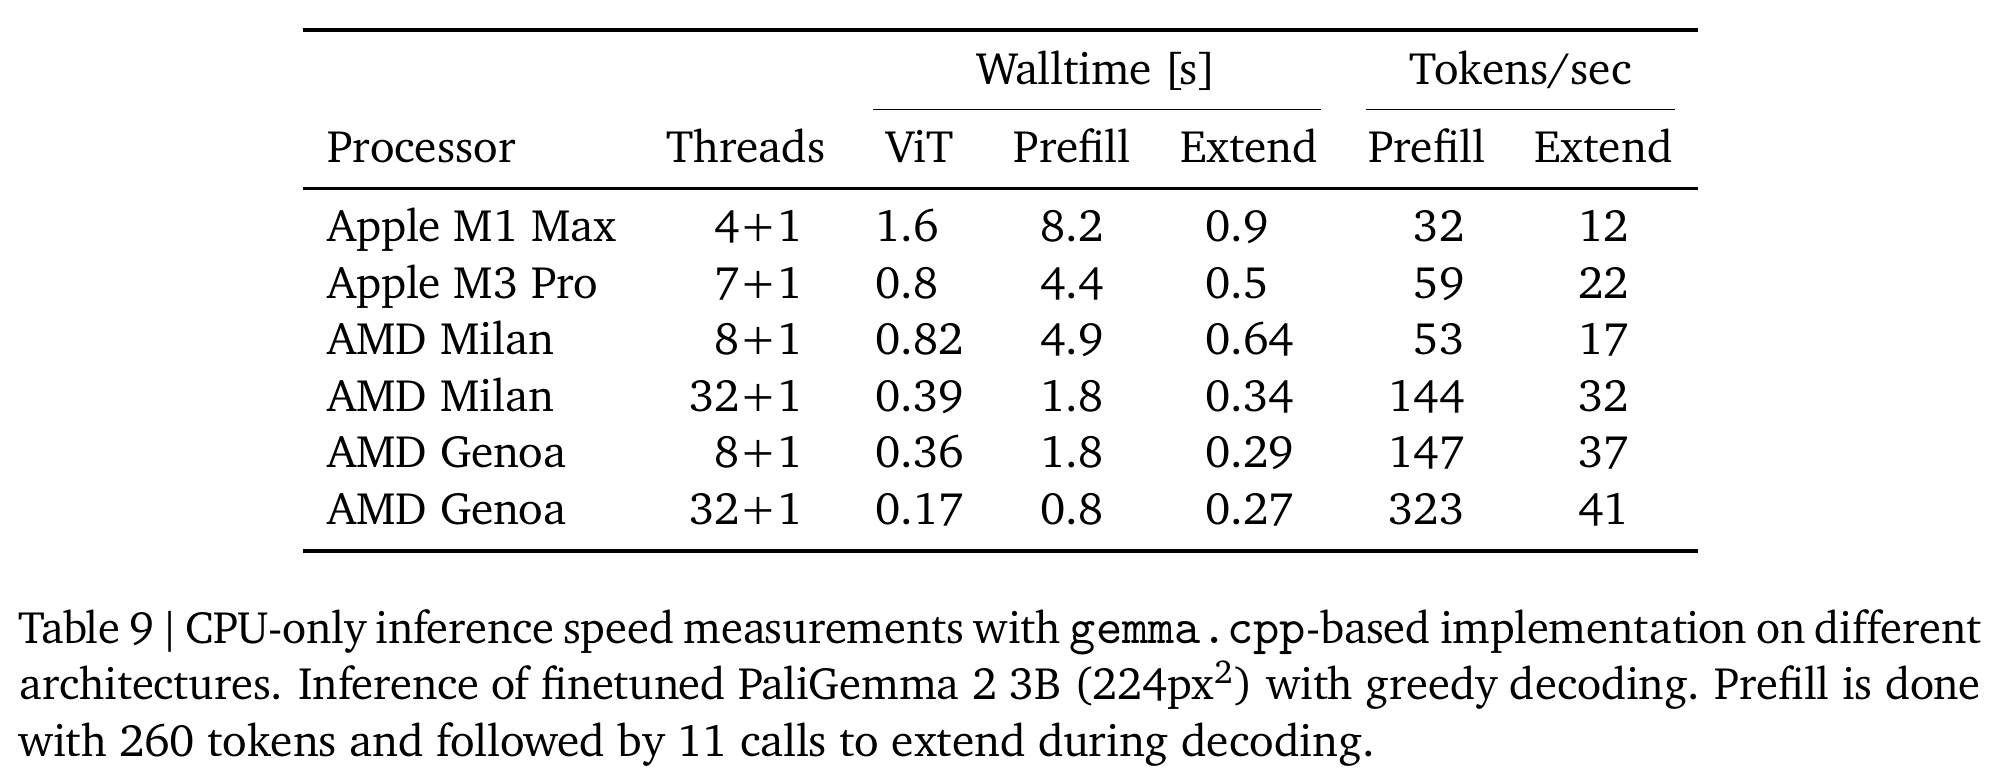
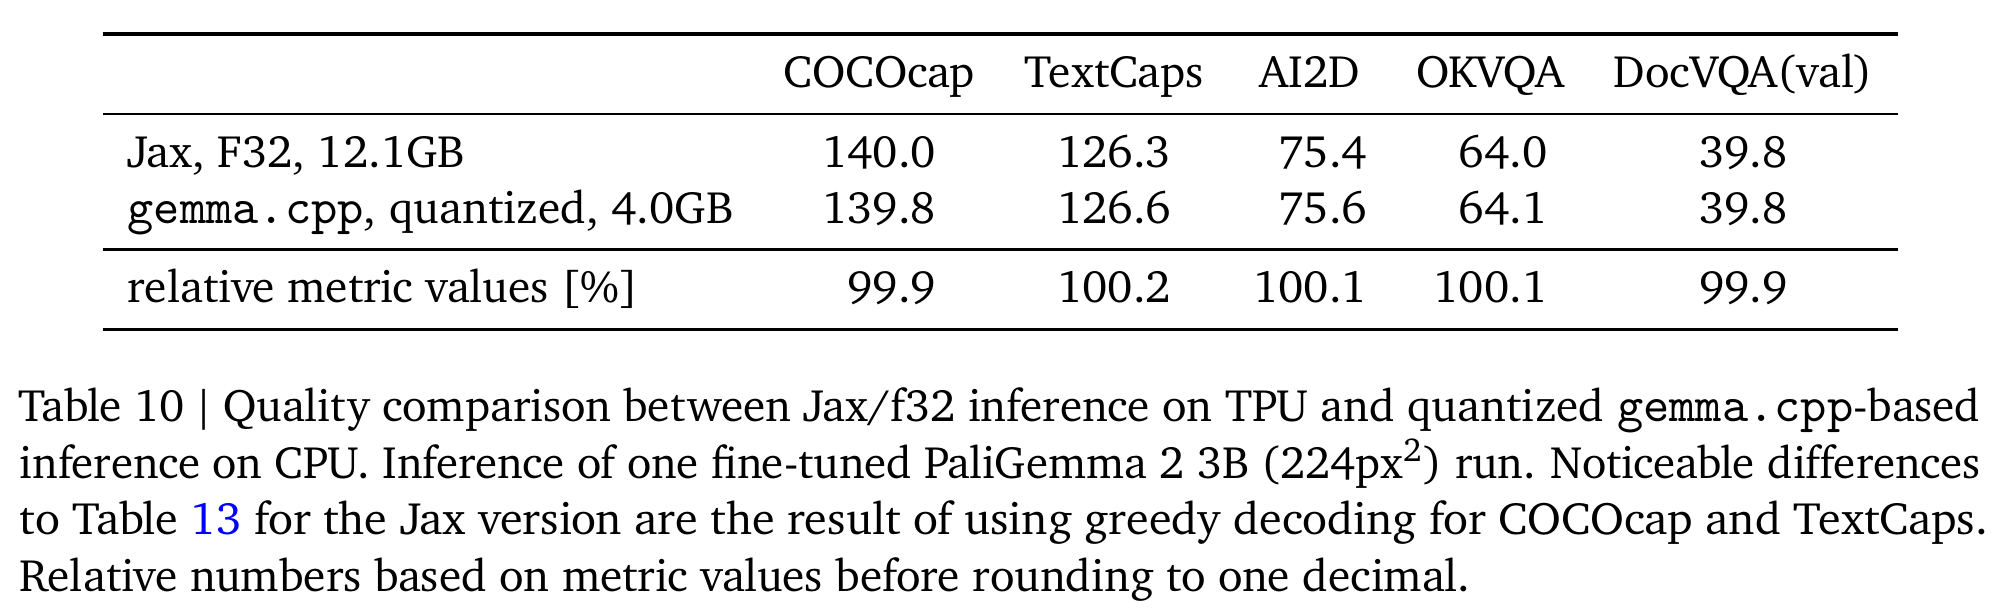
Inference on the central processing unit, or CPU, uses gemma.cpp, a portable C++ inference engine supporting 8-bit switched-floating-point quantization. The speed experiment uses a COCOcap image-captioning checkpoint with 3B parameters at 224px², batch size 1, prefill, or initial processing, of a 260-token image-and-text prefix, and an 11-token output: generation ranges from 12 tokens/sec on Apple M1 Max to 41 tokens/sec on AMD Genoa with 32+1 threads. Across five tasks, quantization reduces model storage from 12.1GB to 4.0GB and retains 99.9–100.2% of the original metric values, based on one fine-tuning run per task.
On Apple M3 Pro, visual encoding takes 0.8 s and prefill takes 4.4 s, while the 11-token generation phase takes 0.5 s. Generation throughput alone therefore omits most of the measured response time in this example.
The quantized implementation closely matches the 32-bit floating-point scores across five selected tasks while using 4.0GB instead of 12.1GB. The comparison uses one fine-tuned checkpoint per task and does not measure variability across training runs.
5. Conclusion
The paper concludes that its family of open-weight models transfers across captioning, question answering, video, music, molecules, and medical imaging. The larger variants improve many results over PaliGemma when additional computation is available, with gains that depend on task, model size, and resolution.
Appendix
- A. Tasks illustrates input and output formats for text and table recognition, molecular drawings, music transcription, detailed captions, and radiography reports. Its caption examples highlight sentences judged non-entailing.
- B. Transfer and evaluation details gives task-specific adaptation protocols. Table preprocessing pads and resizes images, encodes non-empty cell boxes with location tokens, skips training examples for invalid table structures and overlapping cell bounding boxes, corrects FinTabNet annotations, and leaves reported test splits unfiltered. For DOCCI, five raters classify each sentence as Entailment, Neutral, Contradiction, or Nothing to assess; majority decisions determine the labels. Neutral and Contradiction form the Non-entailment rate used for model selection, and the paper reports an overall binary agreement of 0.8407, described as the proportion where all raters agree on the Entailment category. The appendix also specifies training and decoding settings for text, molecules, music, spatial reasoning, and radiography. The DOCCI transfer protocol and hyperparameters follow prior work.
- For text recognition, the authors fine-tune for 15,000 steps with batch size 256 on 256 TPU-v5e chips, using a maximum sequence length of 2,048 and label smoothing of 0.1. They report a best learning rate of 10⁻⁵ and best results at 896px². Table structure recognition uses the same transfer setup but a maximum output length of 4,096, no label smoothing, and an optimal learning rate of 10⁻⁴.
- For molecular structure recognition, the authors fine-tune for 30,000 steps with batch size 256, learning rate 10⁻⁴, and label smoothing of 0.1; images are padded to a square before resizing. Optical music recognition follows this setup with a maximum output length of 1,024 instead of 256.
- Spatial reasoning fine-tuning explores learning rates, weight decay, dropout and epoch counts with batch size 1,024 and a maximum output length of 18. For radiography, the model receives the indication as a prefix and predicts findings and impressions. At 448px², the selected starting recipe uses eight epochs, a 5 × 10⁻⁶ learning rate and greedy decoding, without label smoothing, dropout or weight decay; learning rates are swept again for higher resolutions and model sizes.
- C. Object detection uses noise-box sequence augmentation and class-token likelihood for confidence scores, training both COCO and DocLayNet transfers for 50 epochs. The reported transfers trail specialized detectors; the proposed mismatch between detection metrics and language-model training remains a hypothesis.
- D. Ethics and Safety reports child-safety, content-safety, and representational-harm evaluations, including Perspective API scores for FairFace captions. Table 12 reports subgroup maxima and medians as percentages; its largest listed subgroup maximum is 0.83% for Threat. The prose uses a threshold > 0.8, while the table caption specifies ≥ 0.8.
- E. Detailed results provides relative-score and error-reduction views, repeated-run benchmark statistics, learning-rate sweeps, and matched 3B comparisons. Table 13 reports means and standard deviations across five runs; Figure 4 describes medians, whereas Table 13 describes means, leaving an inconsistency in the stated aggregation.
Brief Thoughts
The controlled comparison of language-model capacity and visual resolution is useful for selecting a checkpoint: document recognition benefits from retaining detail, while several reasoning tasks benefit more from language-model scale. Validation-based learning-rate selection and repeated benchmark runs strengthen these comparisons, although selecting rates only at 224px² for most tasks leaves whether a different learning rate would be better at 448px² untested for those tasks.
The transfer results require different interpretations: molecular evaluation uses synthetic drawings, captioning reuses qual_dev for selection and final evaluation, and medical metrics measure report agreement without testing clinical deployment. The detection shortfall and five-task quantization study also leave task-specific validation necessary when selecting a checkpoint.