


Qwen2.5-VL Technical Report | Summary
19 Feb 2025 | Paper Review Vision-Language Models Document Parsing Video Understanding Computer-Use AgentsContents
This article explains the key points of Qwen2.5-VL Technical Report.
- 2025-02-19 (arXiv)
- Bai, Shuai, Chen, Keqin, Liu, Xuejing, Wang, Jialin, Ge, Wenbin, Song, Sibo, Dang, Kai, Wang, Peng, Wang, Shijie, Tang, Jun, et al.
- Alibaba Group
- Paper
- Github
- Project Page
Summary
- Qwen2.5-VL addresses how a vision-language model, which processes images or video together with text, can recognize fine details, extract document content and structure, locate objects, and understand long videos within one architecture. In the report’s DocVQA test comparison, which evaluates questions about document images, Qwen2.5-VL-72B scores 96.4 versus 95.2 for Claude-3.5 Sonnet and 91.1 for GPT-4o, while results on other tasks are mixed.
- The architecture combines variable-resolution image processing, window attention that restricts most visual attention operations to local regions, and video position encoding aligned with elapsed time. Three pre-training stages use 4.1 trillion tokens, the sequence units processed during training, followed by instruction-response training and preference-based optimization; the model family has 3B, 7B, and 72B variants, where B denotes billions of parameters.
- The benchmark tables show gains in document processing, selected long-video tasks, counting, and screen element localization. The report provides no controlled ablations—experiments isolating individual changes—or dedicated latency and memory comparisons, so the contributions of architecture and data cannot be separated.
1 Introduction
The introduction identifies computational complexity, limited context handling, weak fine-grained perception, and inconsistent performance across sequence lengths as obstacles for large vision-language models. Its four technical contributions are window attention in the visual encoder, dynamic frames-per-second (FPS) sampling, temporal position encoding aligned with absolute time, and curated training data expanded from 1.2 trillion to 4.1 trillion tokens.
- The intended capabilities span structured document parsing, visual grounding—locating image content described in language—long-video event localization, and agents that select and execute actions on computers and mobile devices.
2.1 Model Architecture
The approach combines architectural changes with data construction and staged training. The model has three components: a Qwen2.5 large language model (LLM), which generates text; a redesigned Vision Transformer (ViT), which encodes image patches; and a two-layer multi-layer perceptron (MLP), a feedforward network that maps visual features into the language model’s embedding space. Image height and width are resized to multiples of 28, patches use stride 14, and each spatially adjacent group of four patch features is concatenated and merged before entering the language model.
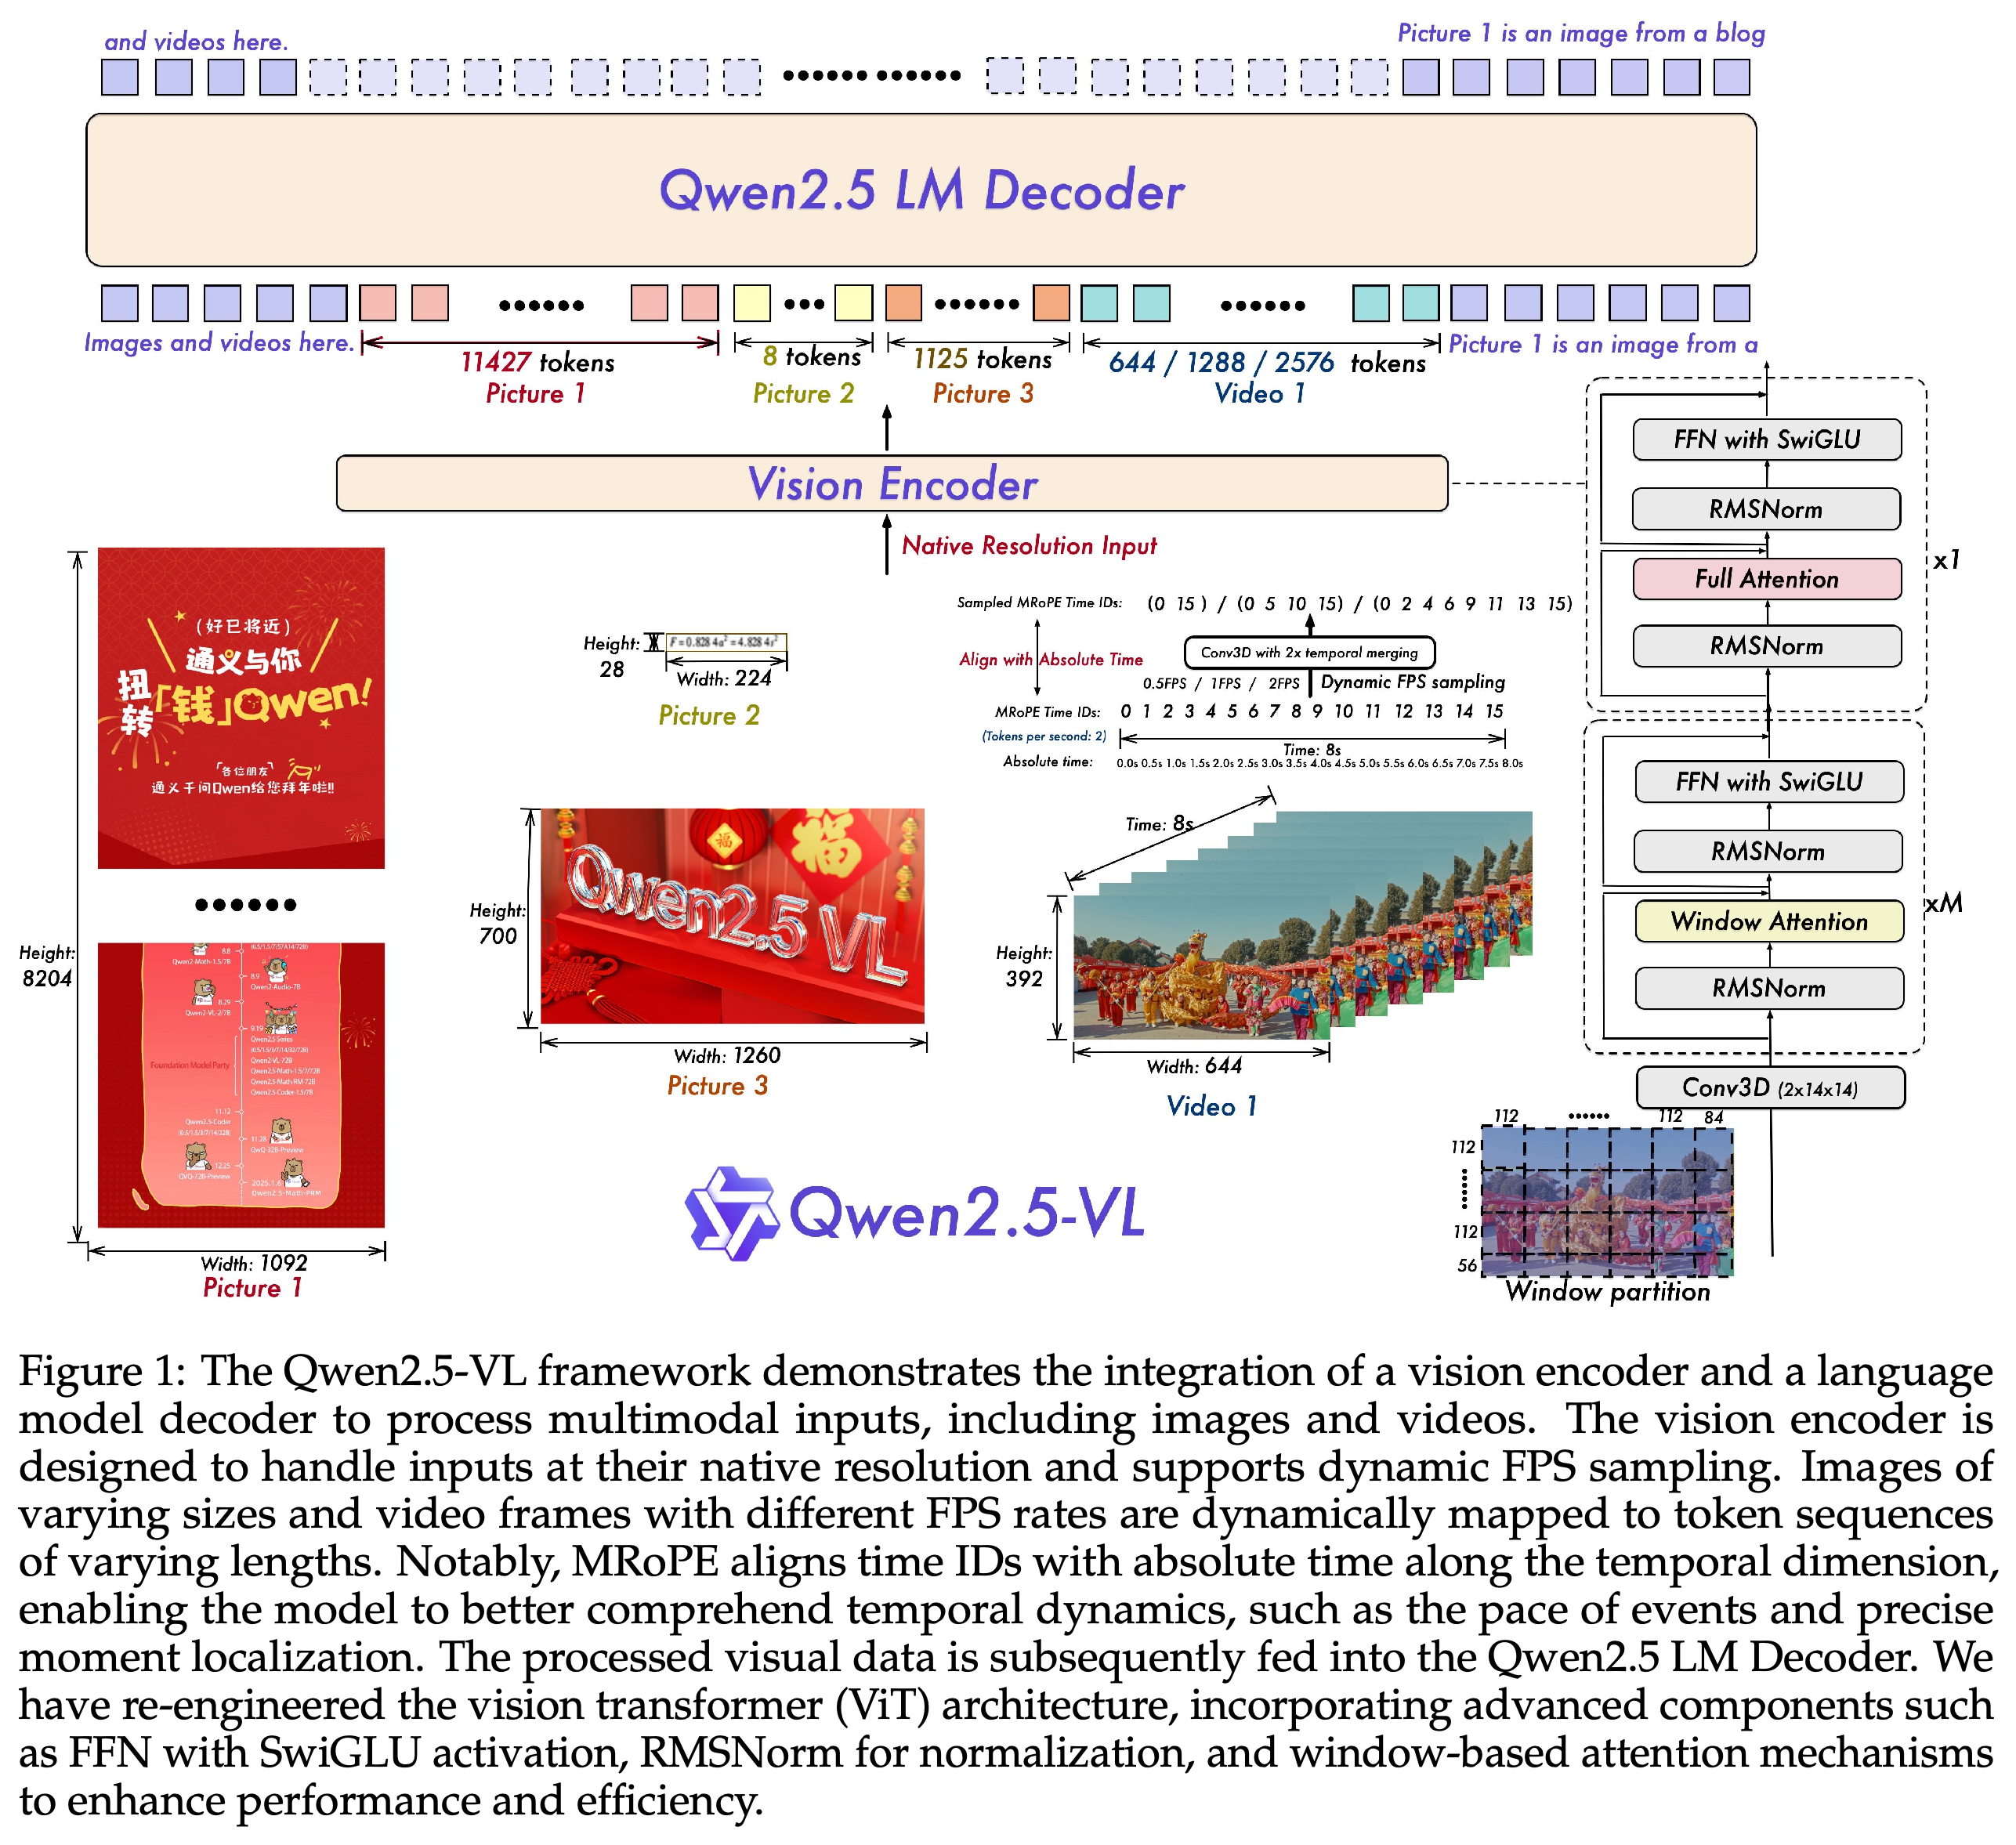
- Figure 1 connects variable image sizes and video sampling rates to variable visual sequence lengths, then shows their integration with text in the Qwen2.5 decoder.
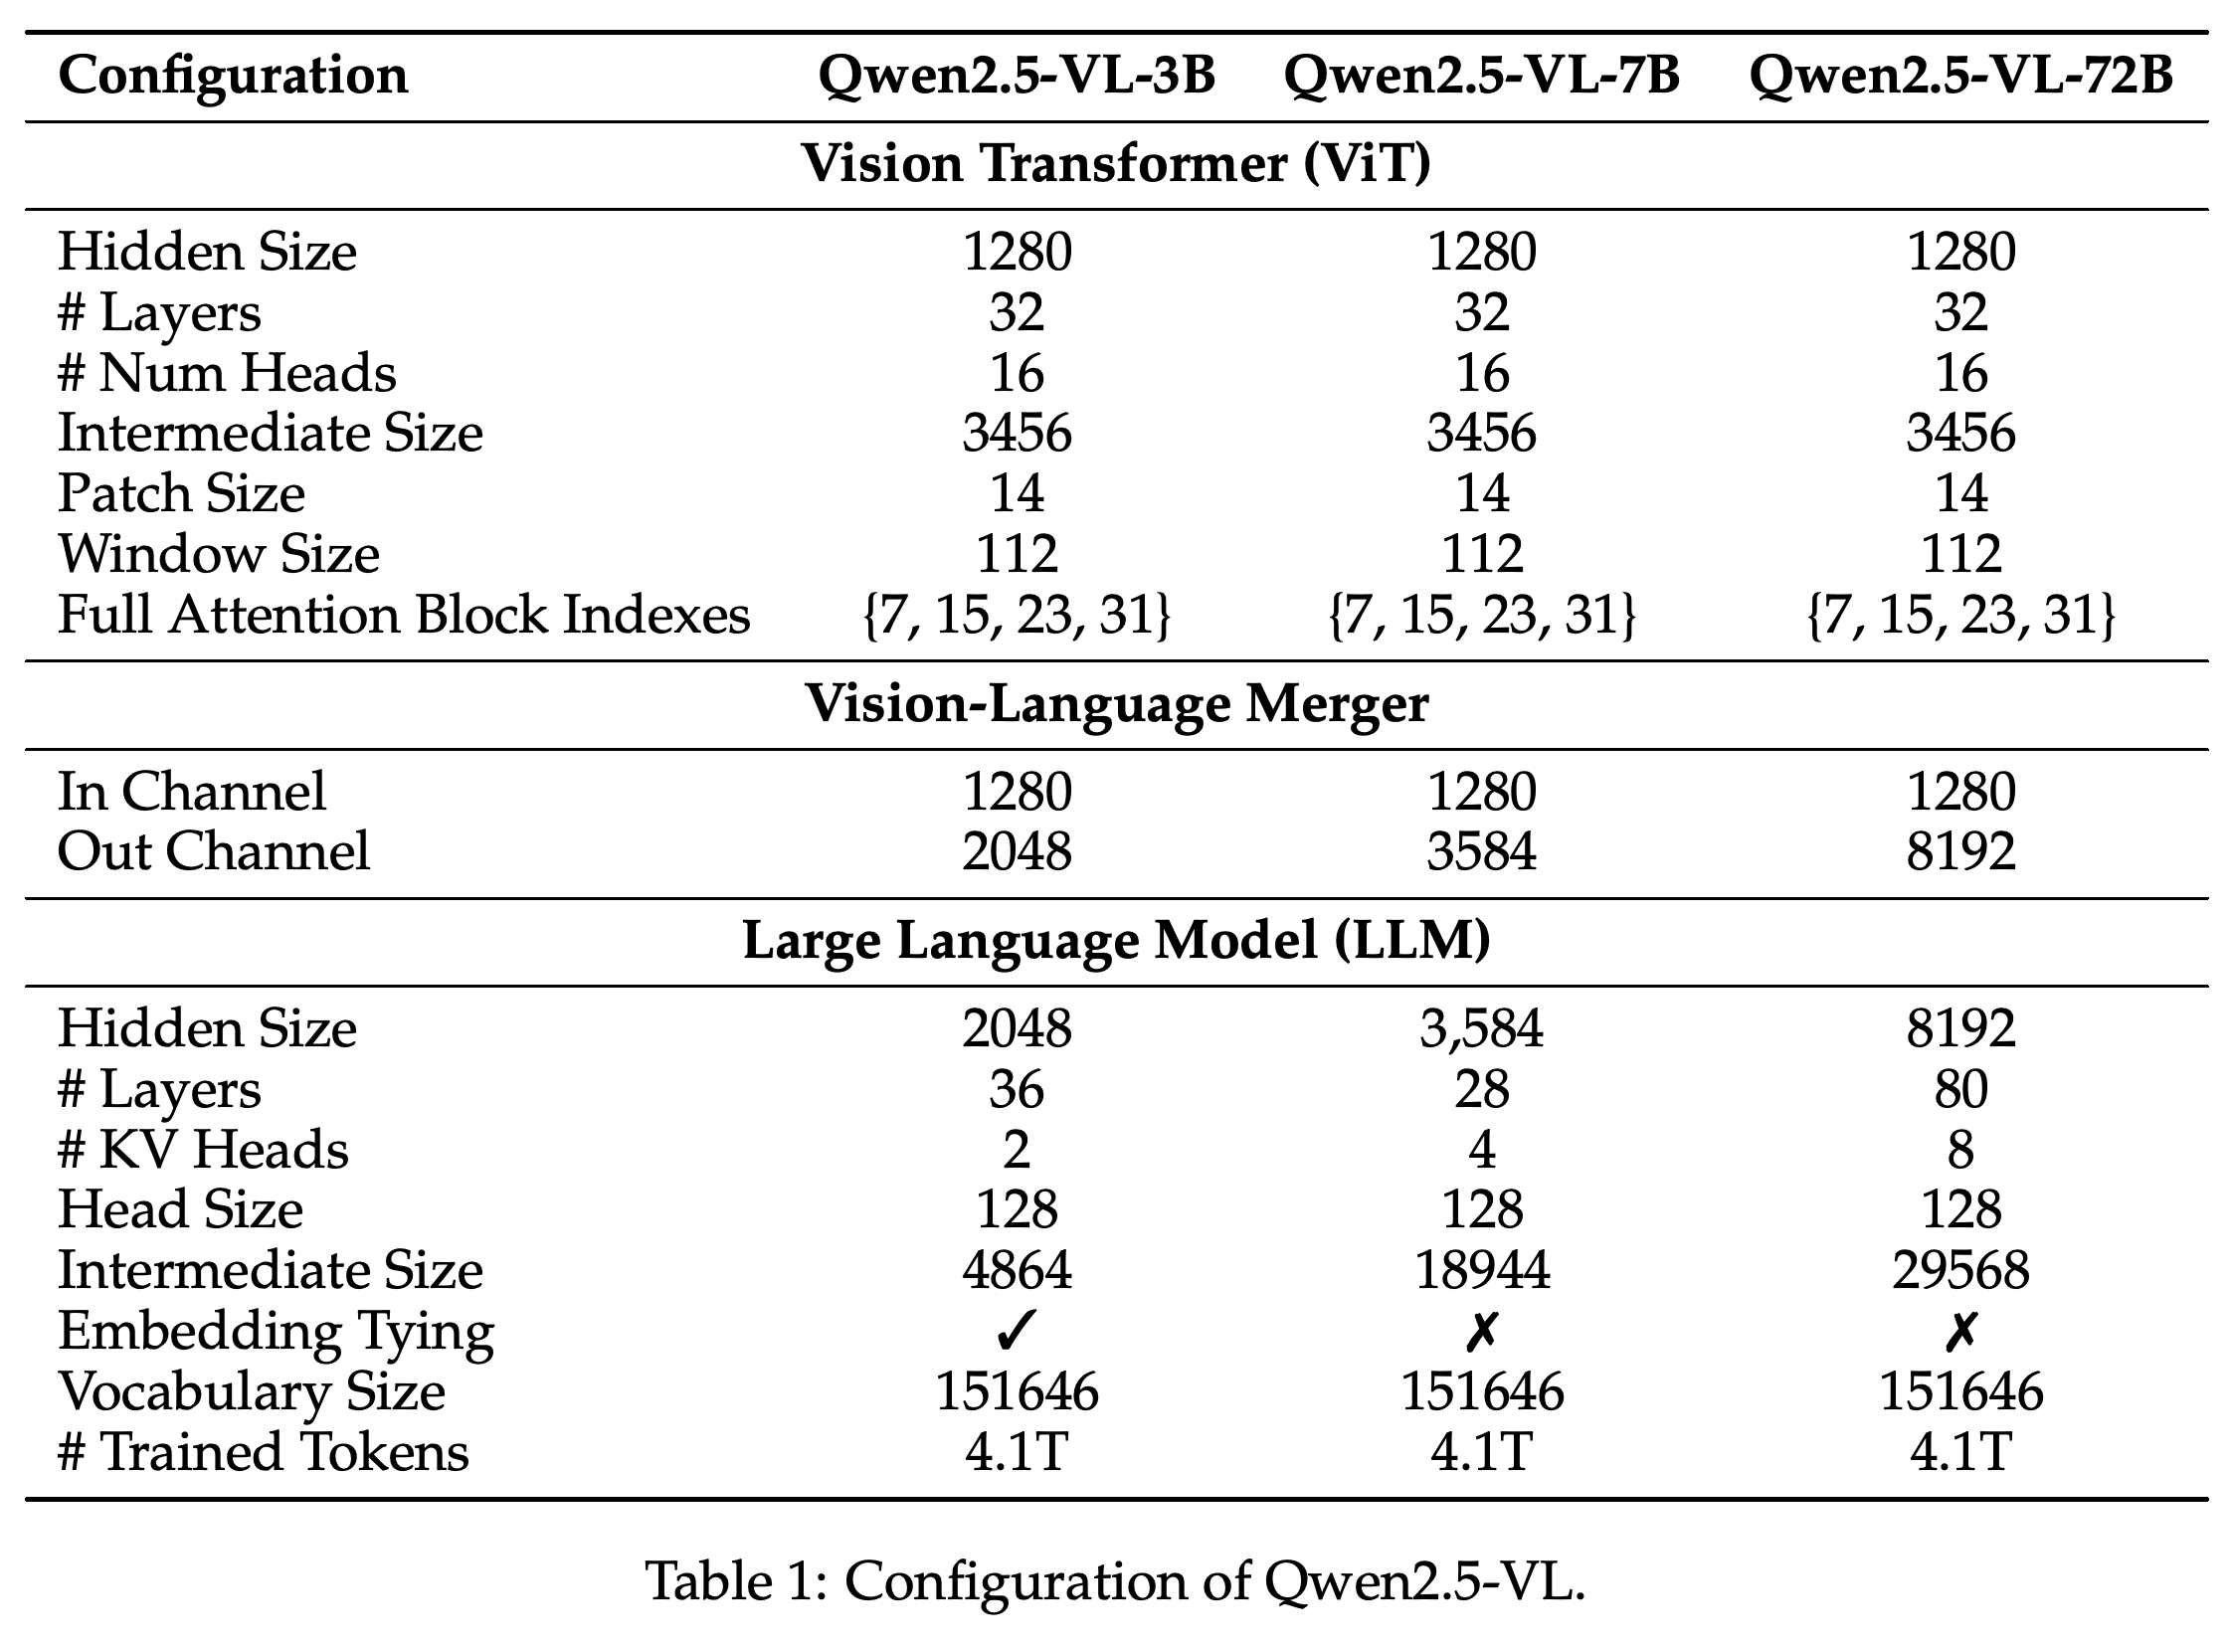
- Table 1 specifies a shared 32-layer visual encoder with hidden size 1280 and 16 attention heads. The 3B, 7B, and 72B decoders have hidden sizes 2048, 3584, and 8192, with 36, 28, and 80 layers, respectively.
- Rotary Position Embedding (RoPE), the positional encoding mechanism used by the model, is extended to represent visual spatial positions and video timing.
The examples show why visual sequence length varies with image dimensions and video sampling rate. The architecture combines local windows with occasional global attention, then sends visual tokens to the language decoder; temporal position intervals encode elapsed time across different sampling rates.
All three models share the same 32-layer visual encoder and full-attention block indexes. Decoder dimensions and merger output channels change with model size, showing that the family scales mainly through its language component while retaining a common visual configuration.
2.1.1 Fast and Efficient Vision Encoder
The visual encoder uses full self-attention, which connects all patches, only at block indexes {7, 15, 23, 31}; the remaining layers restrict attention to windows no larger than 112×112 pixels, corresponding to 8×8 patches. Fixed-size window attention scales linearly with patch count within those layers, although the four full-attention layers retain quadratic attention costs.
- Regions smaller than a window are processed without padding. Images use 14×14 patches, while video processing groups two consecutive frames into each temporal patch.
- The encoder uses 2D RoPE for spatial positions, RMSNorm—root mean square normalization—and SwiGLU, its activation function.
- The ViT is trained from scratch through CLIP pre-training, an image-text representation learning stage, vision-language alignment, and end-to-end fine-tuning. Dynamic resolution sampling respects original aspect ratios; the report does not quantify latency or memory savings in a dedicated experiment.
2.1.2 Native Dynamic Resolution and Frame Rate
Images of different dimensions produce visual token sequences of corresponding lengths, and boxes and points use coordinates based on the actual input image dimensions. For videos, training varies FPS and aligns temporal position identifiers with timestamps, allowing position intervals to represent elapsed time without adding textual timestamps or a separate localization head.
2.1.3 Multimodal Rotary Position Embedding Aligned to Absolute Time
Multimodal Rotary Position Embedding (MRoPE), the positional scheme inherited from Qwen2-VL, separates positions into temporal, height, and width components. Text uses identical identifiers across the three components, images keep the temporal component constant, and videos combine spatial positions with temporal identifiers.
- Qwen2-VL tied temporal identifiers to frame order. Qwen2.5-VL aligns them with absolute time so that different frame sampling rates can represent consistent temporal intervals.
2.2 Pre-Training
Pre-training combines construction of a multimodal corpus with a staged training schedule. The following subsections describe the data sources, quality controls, parameter updates, and sequence lengths used to develop image, document, video, and agent capabilities.
2.2.1 Pre-Training Data
The pre-training corpus combines cleaned web data and synthetic data covering captions, interleaved images and text, optical character recognition (OCR)—reading text from images—visual knowledge, academic questions, grounding, document parsing, video, and agent interactions. This subsection describes its size as approximately 4 trillion tokens; the introduction and training tables specify 4.1 trillion.
- Interleaved image-text data, which mixes images and text within a sequence, undergo standard cleaning and internal model scoring for text quality, image-text relevance, information complementarity, and balance of information density.
- Grounding data combines public and proprietary boxes and points, structured output formats including XML and JSON, copy-paste augmentation that inserts objects into images, and model-generated annotations. Detection training covers over 10,000 object categories, queries for absent categories, and images containing multiple instances.
- Document Omni-Parsing Data represents paragraphs, tables, charts, equations, illustrations, music sheets, and chemical formulas in HTML, a markup format that stores both content and layout coordinates. The QwenVL HTML Format uses data-bbox attributes to associate elements with their locations.
- OCR data includes synthetic, public, and internally collected examples across multiple languages, including Korean. Chart training includes 1 million synthesized samples; 6 million real-world table samples are processed by a recognition model and filtered for quality.
- Video data uses dynamic FPS sampling and synthesized multi-frame captions for videos exceeding half an hour. Localization timestamps appear in seconds and hour-minute-second-frame formats.
- Agent data combines mobile, web, and desktop screenshots with captions and interface-element locations. Actions share a function-call format, and human and model annotators produce step explanations from the task, the known action, and before-and-after screenshots; a model filters low-quality explanations.
2.2.2 Training Recipe
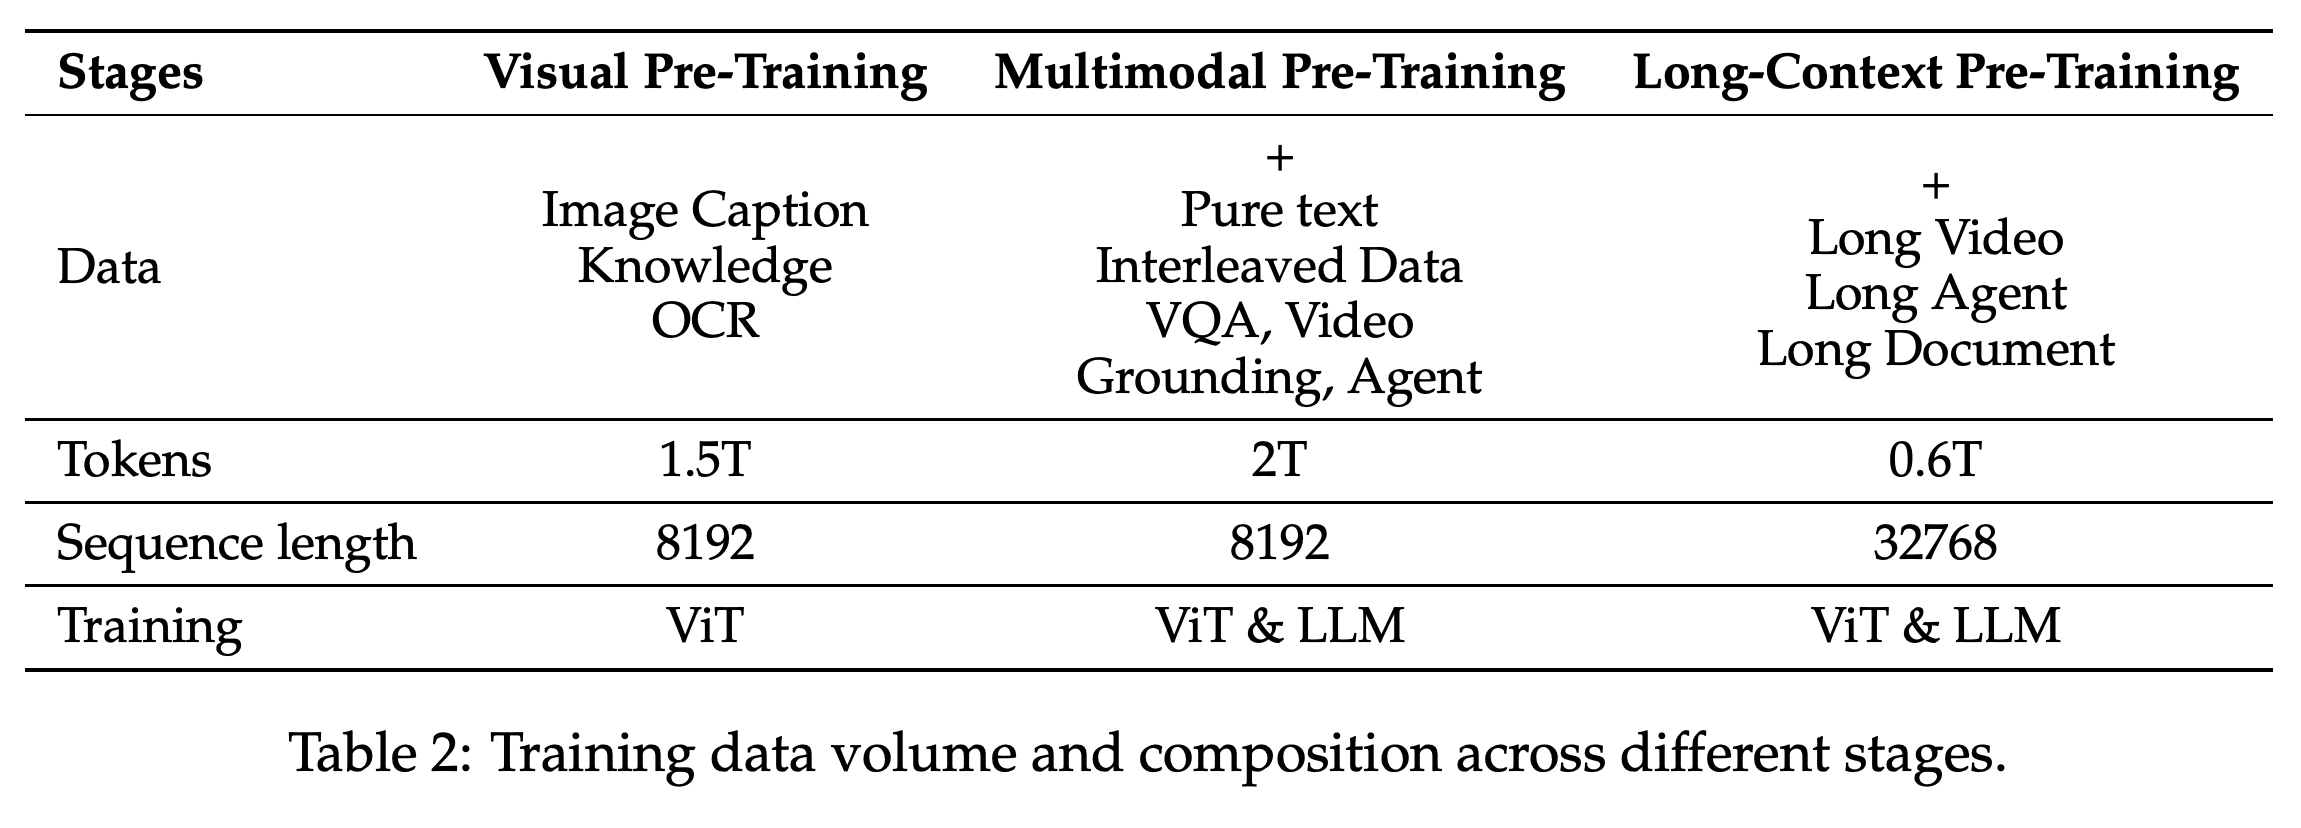
The visual encoder is initialized through training from scratch on DataComp, an image-text data resource, and internal datasets, while the language component starts from pre-trained Qwen2.5 weights. Table 2 describes visual pre-training with 1.5T tokens, multimodal pre-training with 2T tokens, and long-context pre-training with 0.6T tokens, where T denotes trillion.
- Visual pre-training updates the ViT using captions, visual knowledge, and OCR at sequence length 8192. Multimodal pre-training unfreezes all parameters and adds text, interleaved inputs, visual question answering (VQA)—answering questions about visual content—video, grounding, and agent data, also at length 8192.
- Long-context pre-training adds long videos, agent trajectories—sequences of actions—and documents while increasing sequence length to 32768. Samples are dynamically packed, or combined into training sequences, by decoder input length to balance computational load across graphics processing units.
The three token budgets sum to 4.1T. The schedule moves from training the visual encoder at sequence length 8192 to joint visual-language training, then increases the sequence length to 32768 for long videos, agent trajectories, and documents.
2.3 Post-training
Post-training uses Supervised Fine-Tuning (SFT), instruction-response training for downstream behavior, followed by Direct Preference Optimization (DPO), training on preferences to align responses with human judgments. SFT uses ChatML, a dialogue format that identifies roles, inserts visual embeddings alongside text, and preserves cross-modal positions during packing.
2.3.1 Instruction Data
The instruction dataset contains approximately 2 million entries, split evenly between pure text and multimodal examples by entry count. Multimodal entries consume more tokens and computation, so the 50%/50% entry split does not imply an equal allocation of training resources.
- The dataset is primarily Chinese and English with supplementary multilingual examples, and includes single-turn and multi-turn dialogue, single-image and multi-image inputs, and video-text combinations.
- Sources include open repositories, purchased datasets, and online queries. Task subsets cover VQA, captioning, mathematics, coding, security-related queries, document processing, OCR, grounding, video analysis, and agent interactions.
2.3.2 Data Filtering Pipeline
Filtering first uses Qwen2-VL-Instag, a classification model derived from Qwen2-VL-72B, to organize question-answer pairs into eight primary domains and 30 subcategories. Examples include Coding and Planning, with coding identifiers such as Code_Debugging, Code_Generation, Code_Translation, and Code_Understanding.
- Domain-specific rules remove repetitive, incomplete, truncated, incorrectly formatted, unrelated, or potentially harmful entries.
- Reward models, which score response quality, are trained on the Qwen2.5-VL series and assess query complexity and relevance, answer correctness, completeness, clarity, relevance, and helpfulness. Visual tasks receive additional checks on whether the answer correctly uses image evidence.
2.3.3 Rejection Sampling for Enhanced Reasoning
Rejection sampling generates responses with an intermediate Qwen2.5-VL model and retains examples whose answers match ground truth. It targets mathematics, coding, and domain-specific VQA requiring multi-step reasoning, producing Chain-of-Thought (CoT) examples with explicit intermediate reasoning steps.
- Additional filters reject code-switching, or switching languages within a response, excessive length, and repetition, while rules and models check whether intermediate steps use visual information correctly.
- The authors acknowledge that reasoning steps can ignore or misinterpret visual evidence and that aligning reasoning with both modalities remains a challenge. The report does not provide a numerical ablation measuring the isolated contribution of rejection sampling.
2.3.4 Training Recipe
The ViT remains frozen during both SFT and DPO. SFT includes image-text pairs, video, and pure text from general and specialized tasks; DPO uses image-text and pure text preference data, with each sample processed once.
3.1 Comparison with the SOTA Models
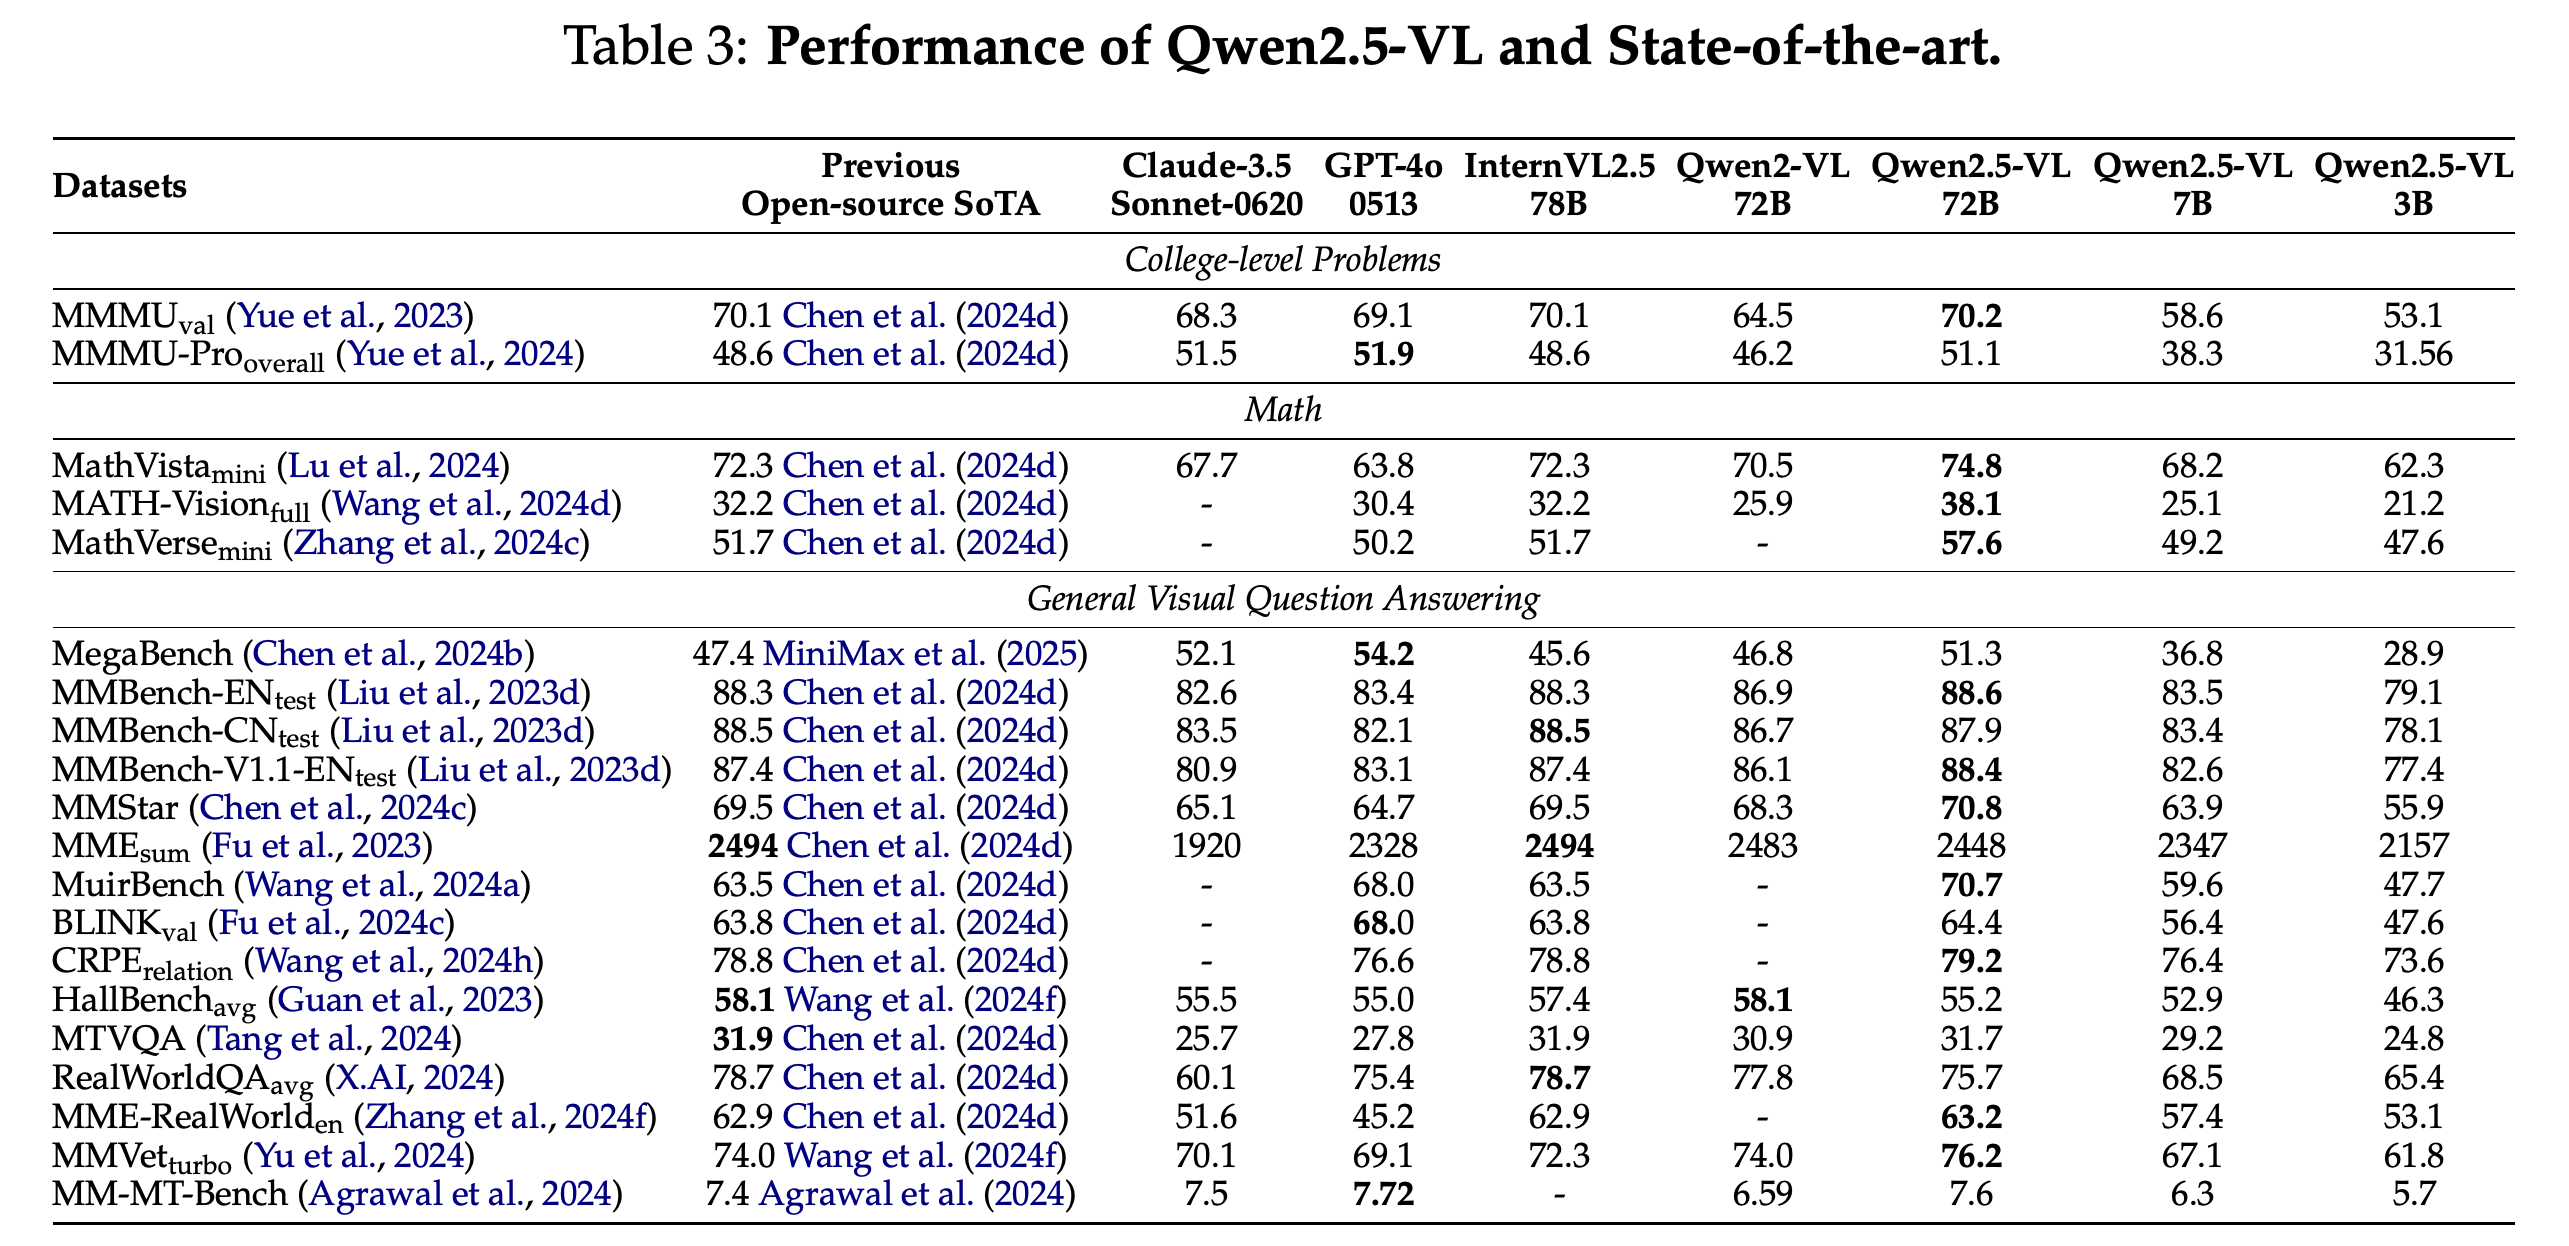
The experiments compare overall benchmark performance before examining individual capabilities. Table 3 compares the three Qwen2.5-VL sizes against previous open-source state-of-the-art (SOTA) results, Claude-3.5-Sonnet-0620, GPT-4o-0513, InternVL2.5-78B, and Qwen2-VL-72B. The 72B model scores 70.2 on MMMU validation, a college-level multimodal benchmark, versus 70.1 for InternVL2.5-78B and 69.1 for GPT-4o-0513.
- On MMMU-Pro overall, a more robust college-level multimodal evaluation, its 51.1 exceeds InternVL2.5-78B’s 48.6 but trails GPT-4o-0513’s 51.9 and Claude-3.5-Sonnet-0620’s 51.5.
- On the visual mathematics benchmarks MathVista mini, MATH-Vision full, and MathVerse mini, it achieves 74.8, 38.1, and 57.6, compared with 72.3, 32.2, and 51.7 for InternVL2.5-78B.
- Performance is mixed across general visual tasks: MegaBench, a broad real-world task benchmark, is 51.3 versus GPT-4o-0513’s 54.2, and RealWorldQA, a visual question-answering benchmark, is 75.7 versus InternVL2.5-78B’s 78.7.
The 72B model improves visual mathematics and several general visual benchmarks, but the comparison also includes losses on MegaBench, MME, HallBench, and RealWorldQA. The smaller variants have lower scores on demanding tasks such as MMMU-Pro and visual mathematics.
3.2 Performance on Pure Text Tasks
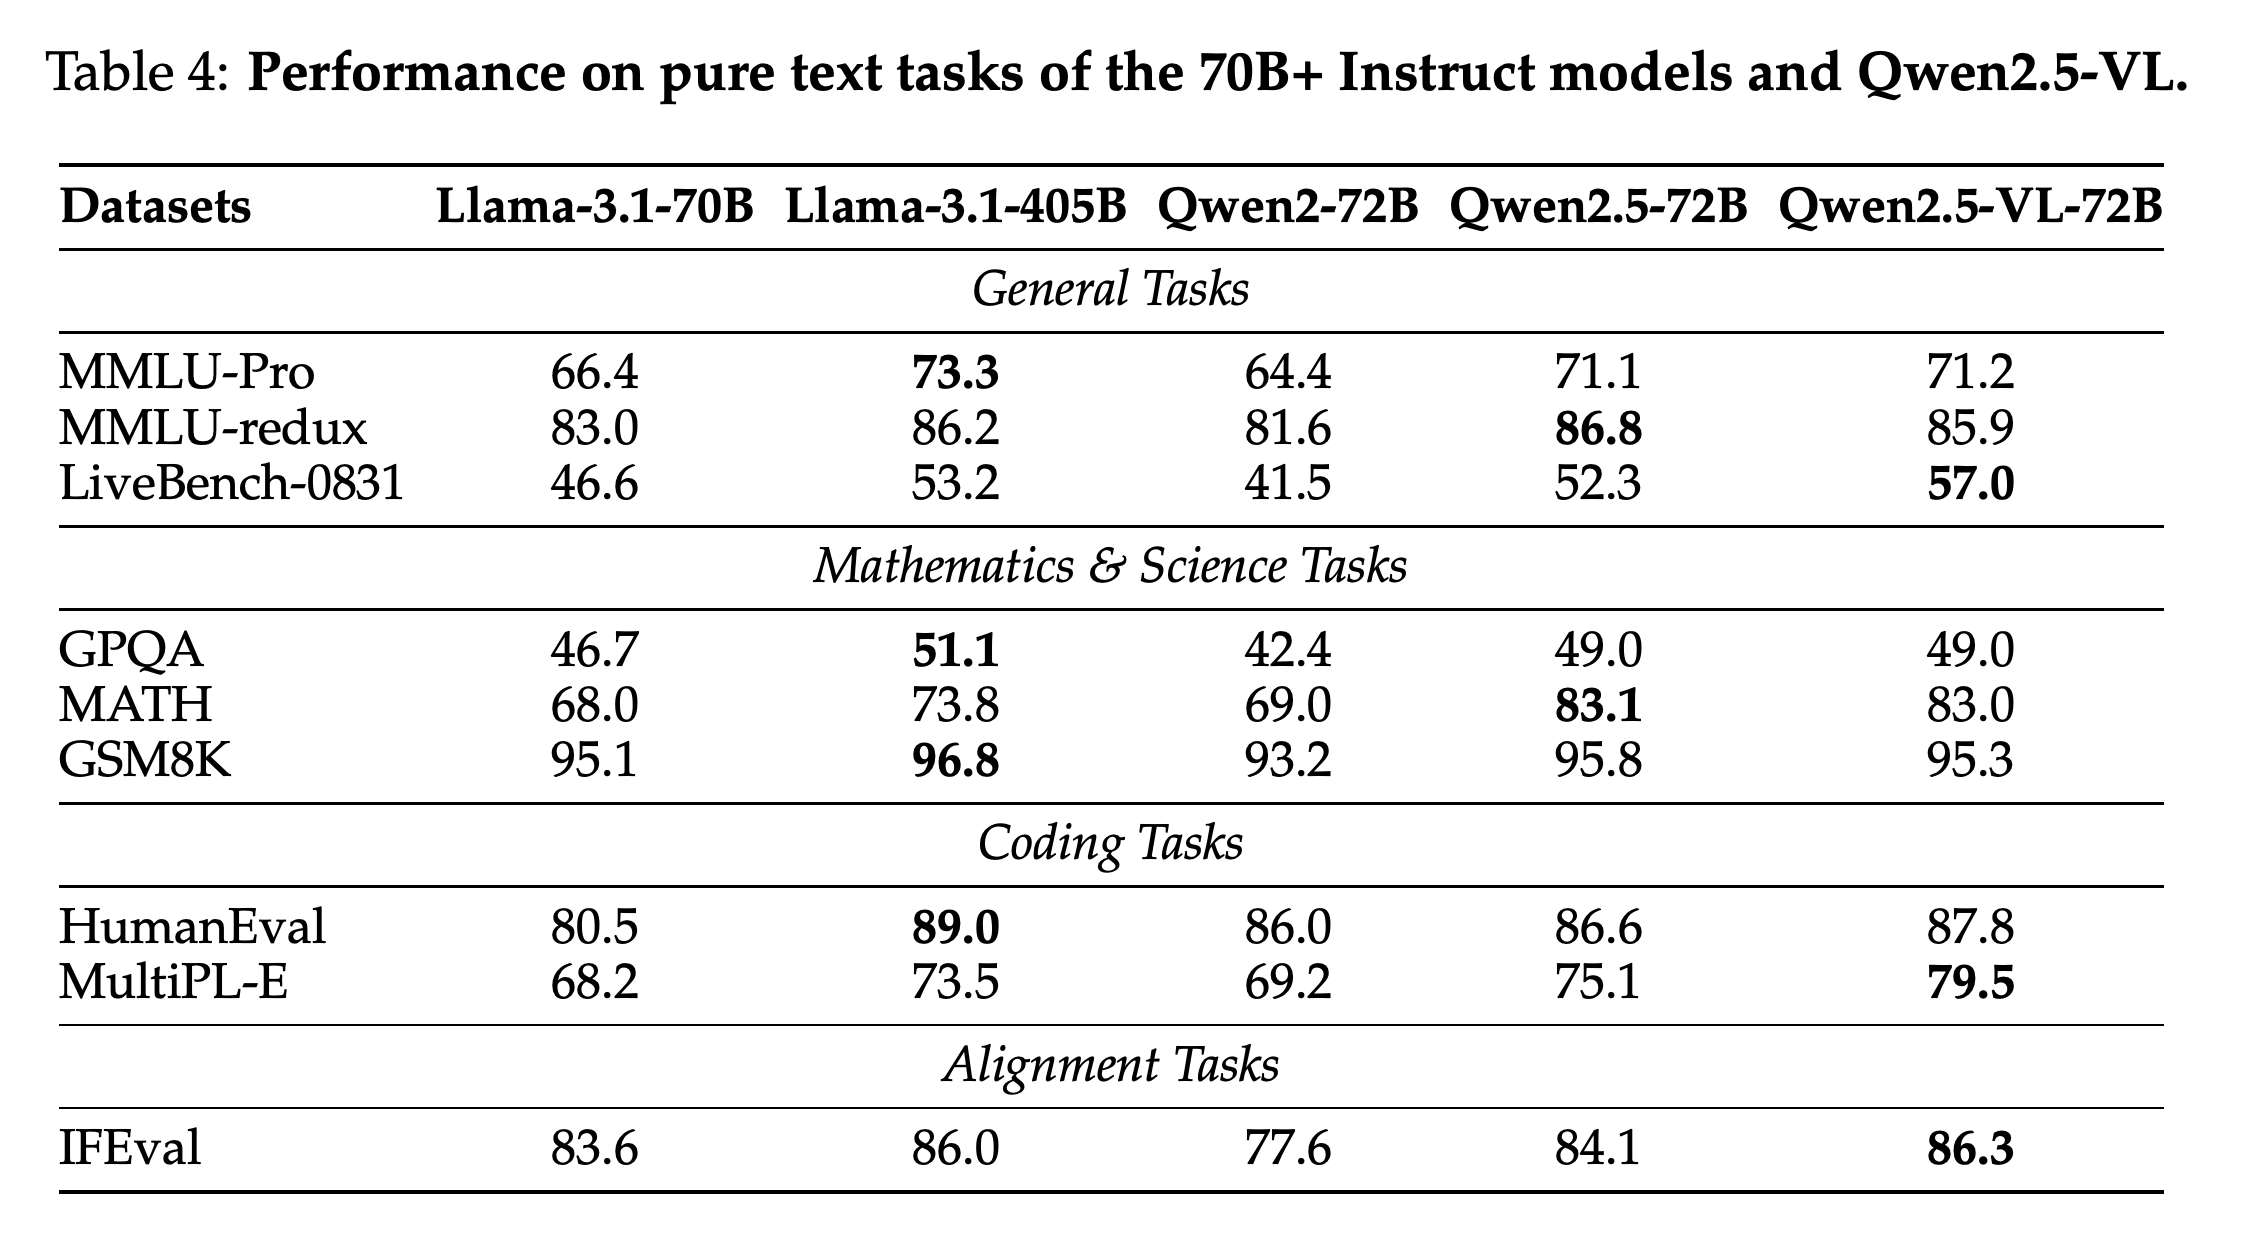
Table 4 evaluates text-only general knowledge, mathematics and science, code generation, and instruction following against 70B+ instruction models. Qwen2.5-VL-72B broadly preserves Qwen2.5-72B’s language performance: MMLU-Pro general knowledge is 71.2 versus 71.1, GPQA graduate-level question answering is 49.0 for both, and MATH mathematical problem-solving is 83.0 versus 83.1.
- It improves LiveBench-0831, a general language-model evaluation, from 52.3 to 57.0, HumanEval code generation from 86.6 to 87.8, MultiPL-E multilingual code generation from 75.1 to 79.5, and IFEval instruction following from 84.1 to 86.3.
- There are small regressions on MMLU-redux general knowledge, 85.9 versus 86.8, and GSM8K mathematics, 95.3 versus 95.8. Llama-3.1-405B leads several listed tasks, including MMLU-Pro and HumanEval.
Comparison with Qwen2.5-72B supports preservation of text capabilities after multimodal training. Gains in LiveBench-0831, MultiPL-E, and IFEval coexist with small declines in MMLU-redux, MATH, and GSM8K.
3.3 Quantitative Results
The quantitative evaluation separates general visual question answering, document understanding and OCR, spatial understanding, video understanding and grounding, and agent behavior. These task groups use different metrics and evaluation settings, so numerical scores require interpretation within each benchmark.
3.3.1 General Visual Question Answering
Qwen2.5-VL-72B scores 88.4 on MMBench-V1.1-EN test and 70.8 on MMStar, both visual understanding and reasoning evaluations, 63.2 on MME-RealWorld English for high-resolution real-world images, and 70.7 on MuirBench multi-image understanding. The corresponding InternVL2.5-78B scores are 87.4, 69.5, 62.9, and 63.5.
- The 7B and 3B models score 63.9 and 55.9 on MMStar, showing lower performance than the 72B model.
- The comparison table also records weaker results: the 72B model scores 2448 on MME, a general multimodal evaluation, versus InternVL2.5-78B’s 2494, and 55.2 on HallBench, an evaluation of hallucination and visual illusion, versus Qwen2-VL-72B’s 58.1.
3.3.2 Document Understanding and OCR
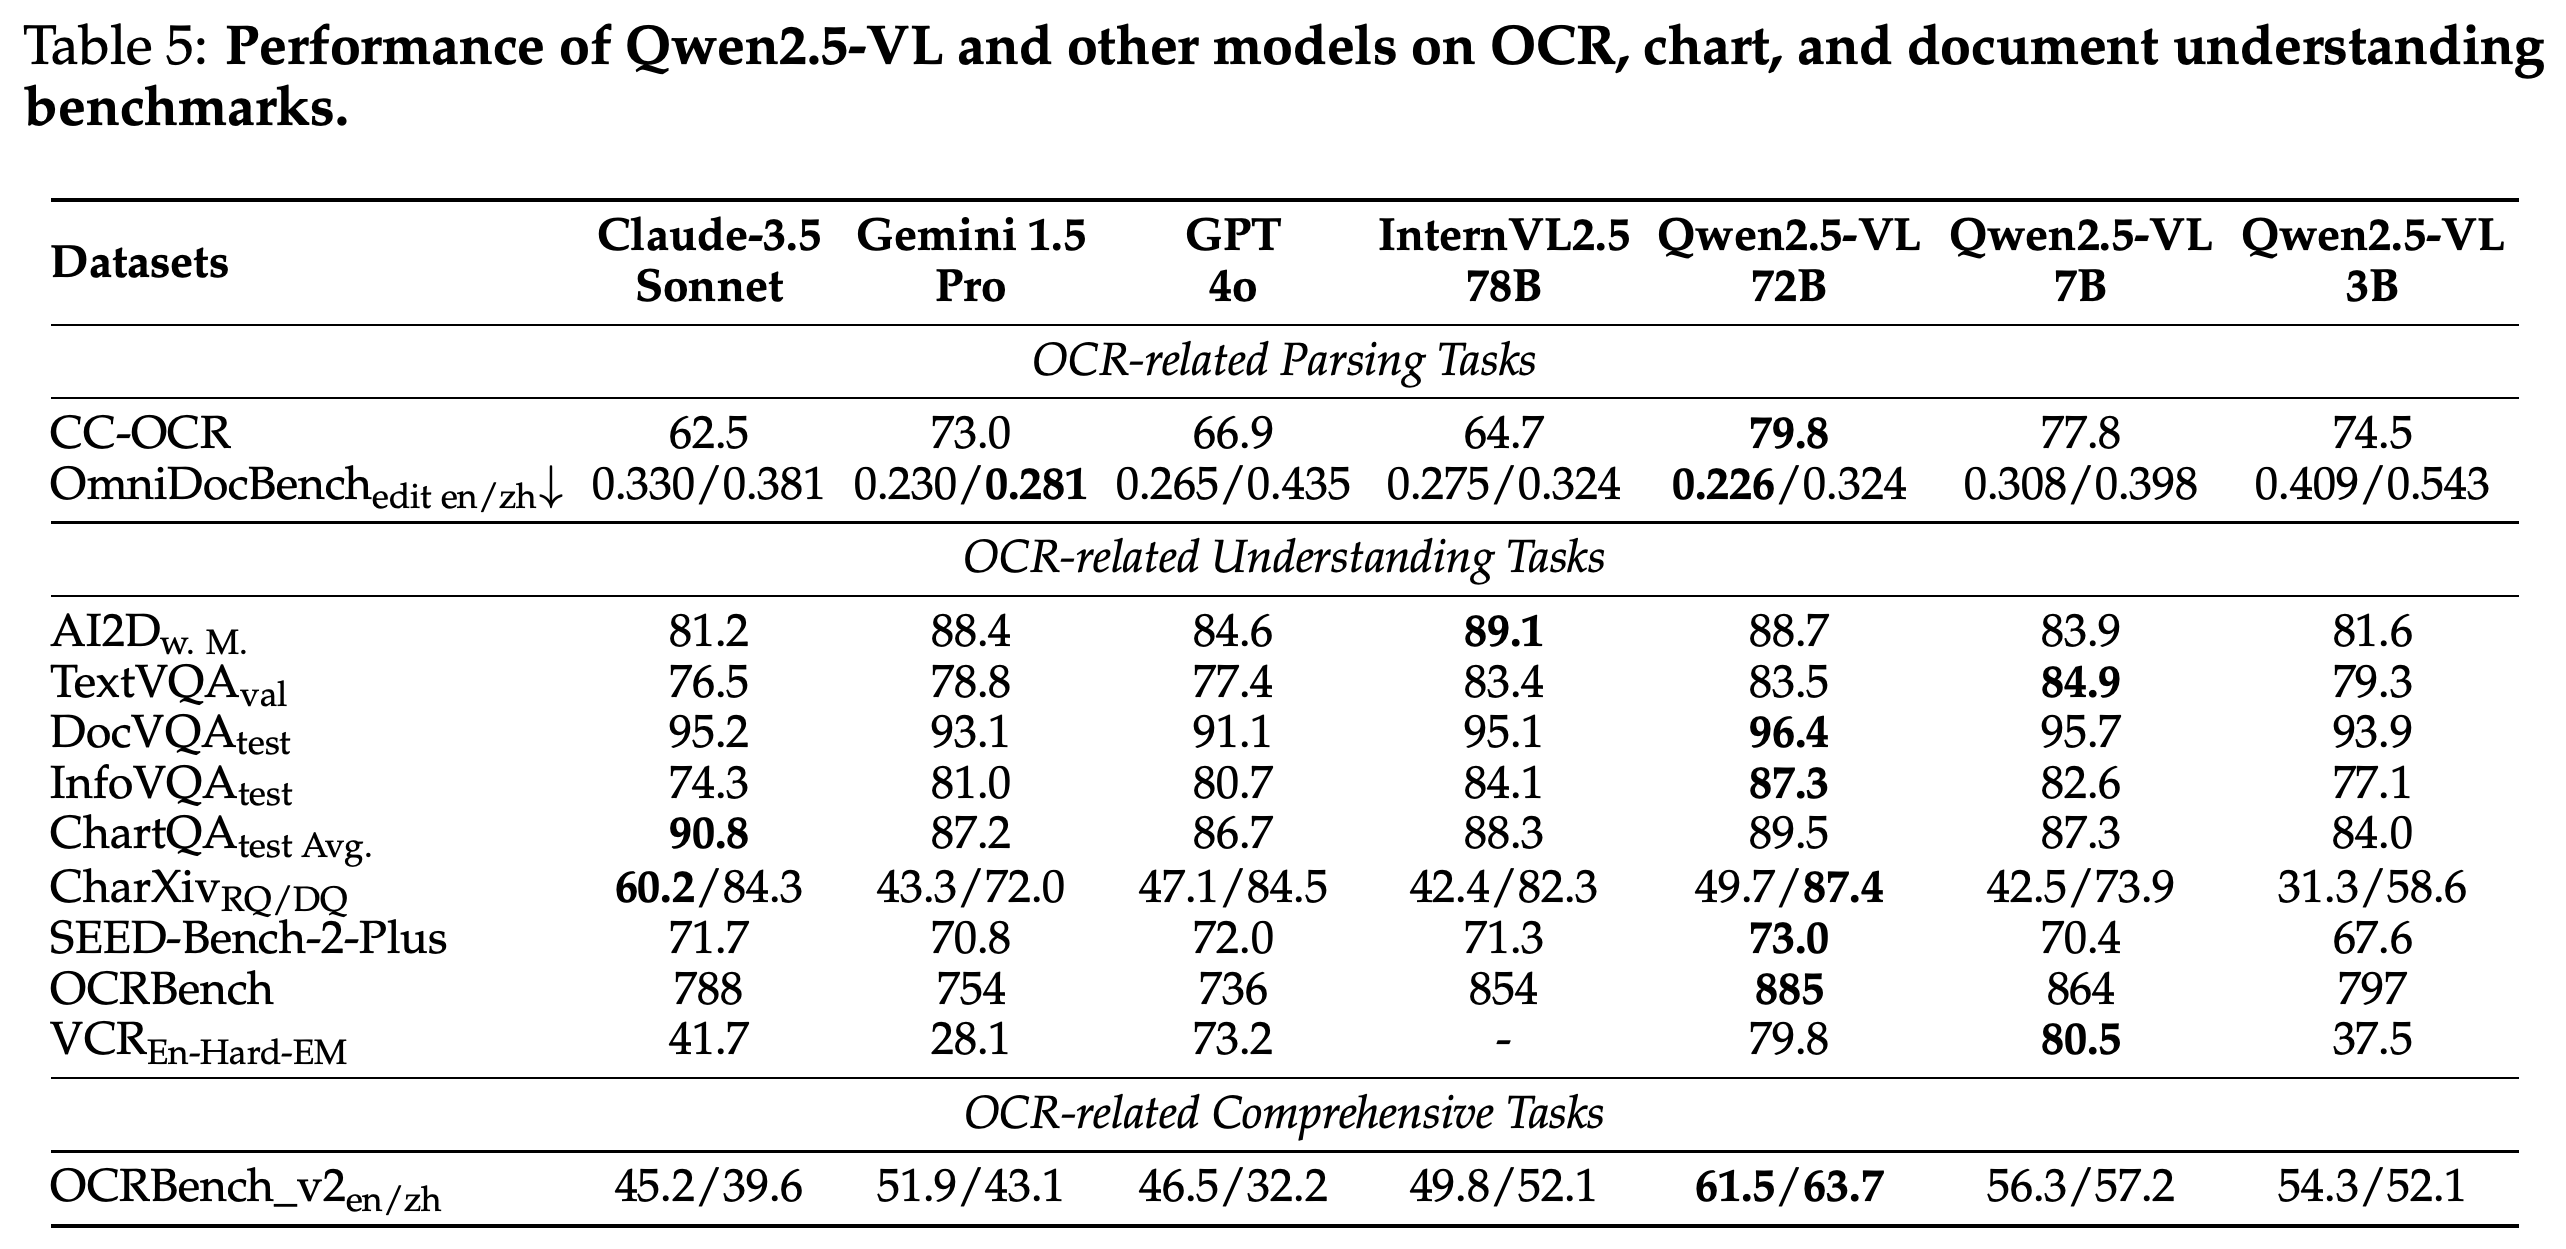
Table 5 reports Qwen2.5-VL-72B scores of 79.8 on CC-OCR, a multilingual text-recognition evaluation, 96.4 on DocVQA test, 87.3 on InfoVQA test for questions about infographics, and 885 on OCRBench, a composite text-recognition and understanding evaluation. InternVL2.5-78B scores 64.7, 95.1, 84.1, and 854, respectively.
- OCRBench_v2, which evaluates text parsing and understanding, reports English/Chinese scores of 61.5/63.7 versus Gemini 1.5 Pro’s 51.9/43.1, differences of 9.6 and 20.6 score points.
- OmniDocBench document parsing reports edit distance, a measure of output differences where lower is better: the 72B model obtains 0.226/0.324 for English/Chinese versus Gemini 1.5 Pro’s 0.230/0.281. Its English result is better, while its Chinese result is worse.
- The model does not lead every chart or diagram task. ChartQA chart question answering is 89.5 versus Claude-3.5 Sonnet’s 90.8, and AI2D diagram understanding is 88.7 versus InternVL2.5-78B’s 89.1; the 7B model also exceeds the 72B model on TextVQA scene-text question answering, 84.9 versus 83.5.
Document question answering and OCR scores compare favorably with several baselines, but the metrics require separate interpretation. Lower OmniDocBench edit distance favors the 72B model in English and Gemini 1.5 Pro in Chinese, while Claude-3.5 Sonnet retains the higher ChartQA score.
3.3.3 Spatial Understanding
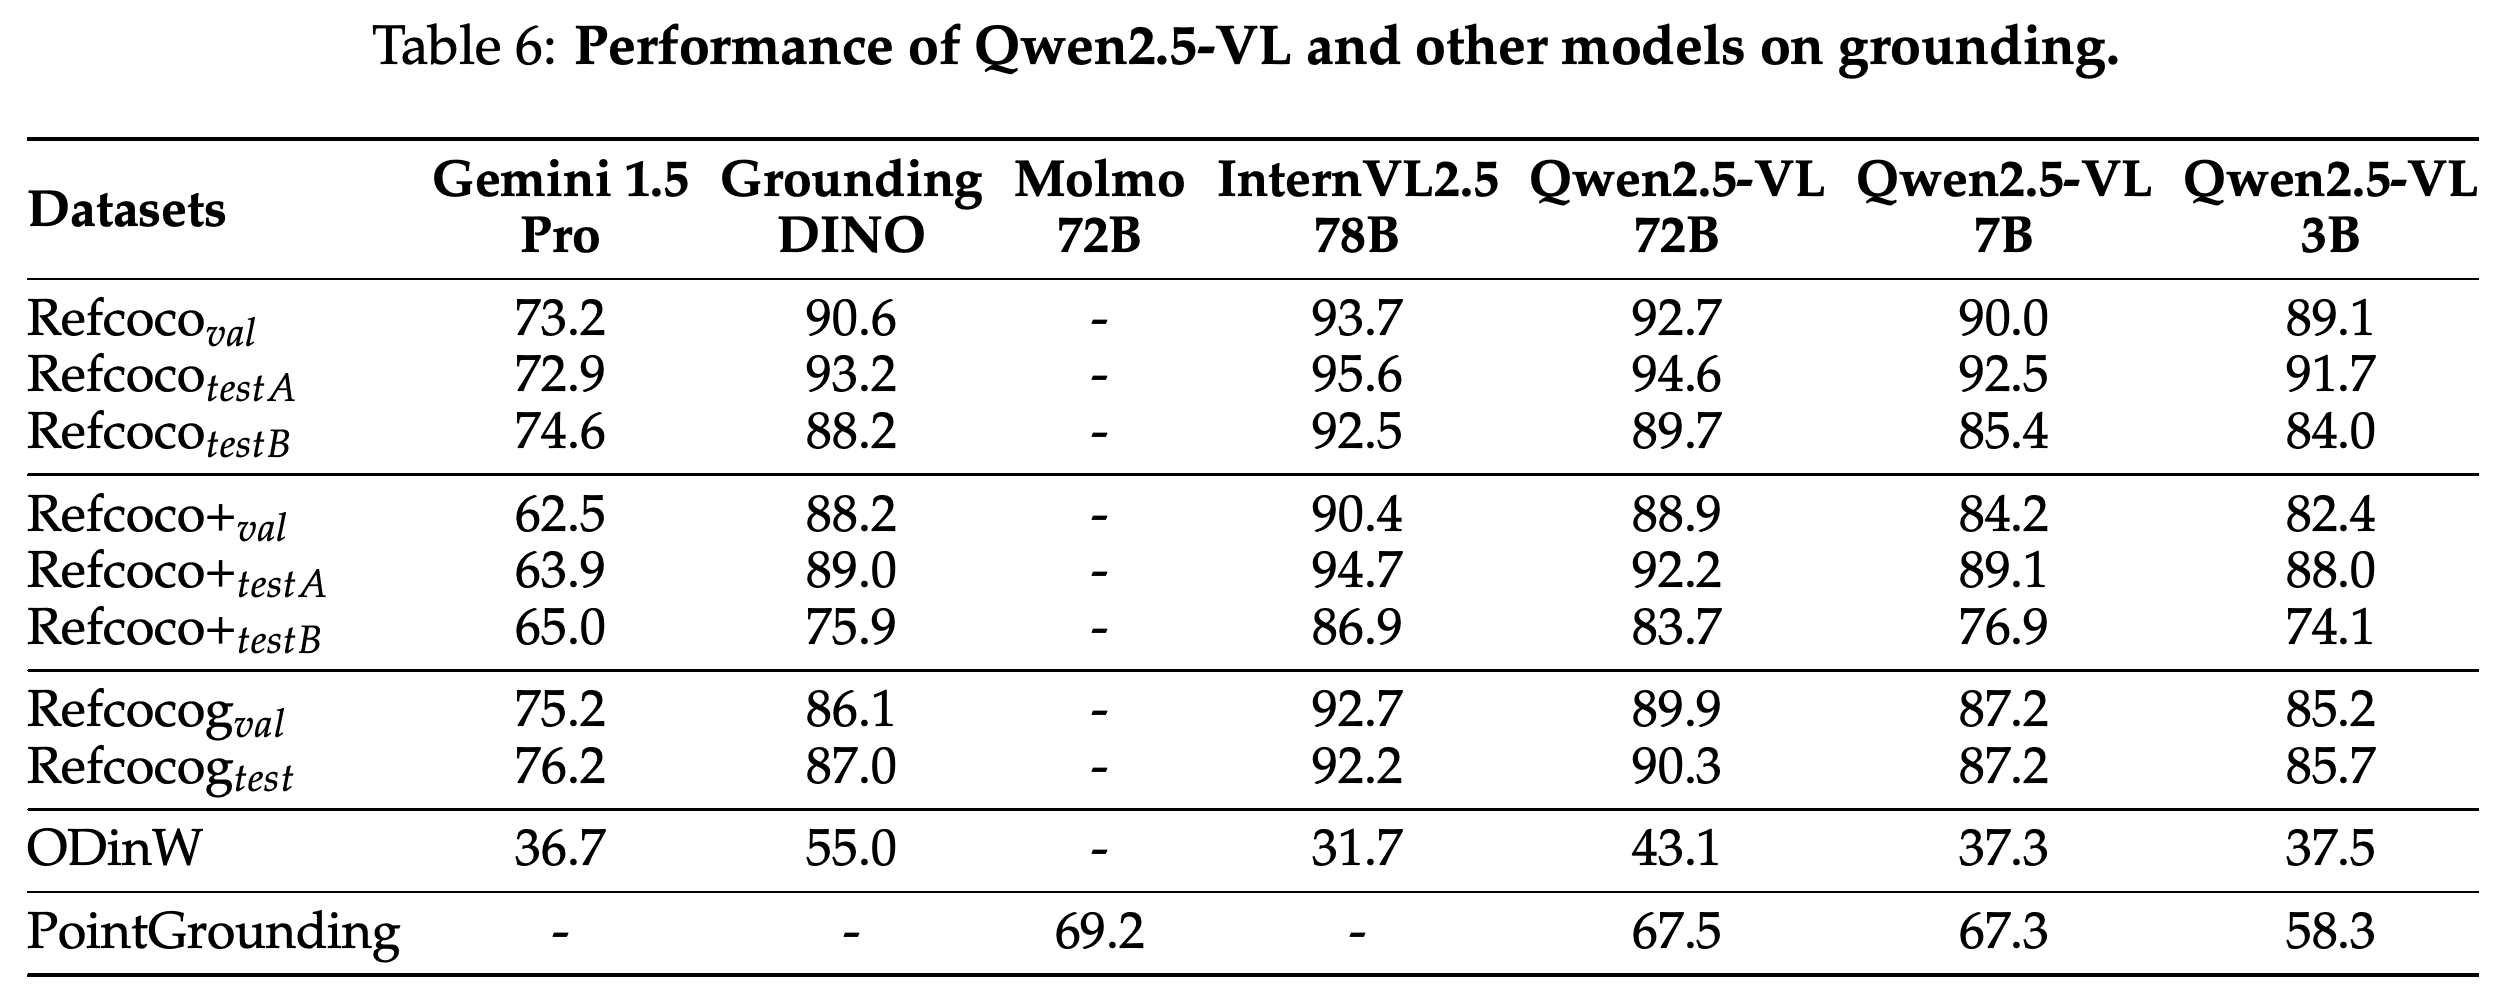
Spatial evaluation covers referring-expression box localization, which locates objects described in language, open-vocabulary detection—detecting categories specified in language—point localization, and counting. Qwen2.5-VL-72B achieves 43.1 mean average precision, the detection metric reported for ODinW-13, versus 31.7 for InternVL2.5-78B and 55.0 for the specialist detector Grounding DINO.
- Table 6 shows that InternVL2.5-78B exceeds Qwen2.5-VL-72B on every listed Refcoco, Refcoco+, and Refcocog referring-expression split. On the self-curated PointGrounding point-localization benchmark, Qwen2.5-VL-72B scores 67.5 versus Molmo-72B’s 69.2.
- Table 7 reports 93.6 accuracy on CountBench, an object-counting evaluation, using a “detect then count”-style prompt, exceeding Molmo-72B’s 91.2, Claude-3.5 Sonnet’s 89.7, and GPT-4o’s 87.9.
The model improves ODinW detection over InternVL2.5-78B but remains below Grounding DINO. InternVL2.5-78B leads all listed referring-expression splits, and Molmo-72B leads the point-grounding comparison, limiting the accompanying claim of broadly leading grounding performance.
3.3.4 Video Understanding and Grounding
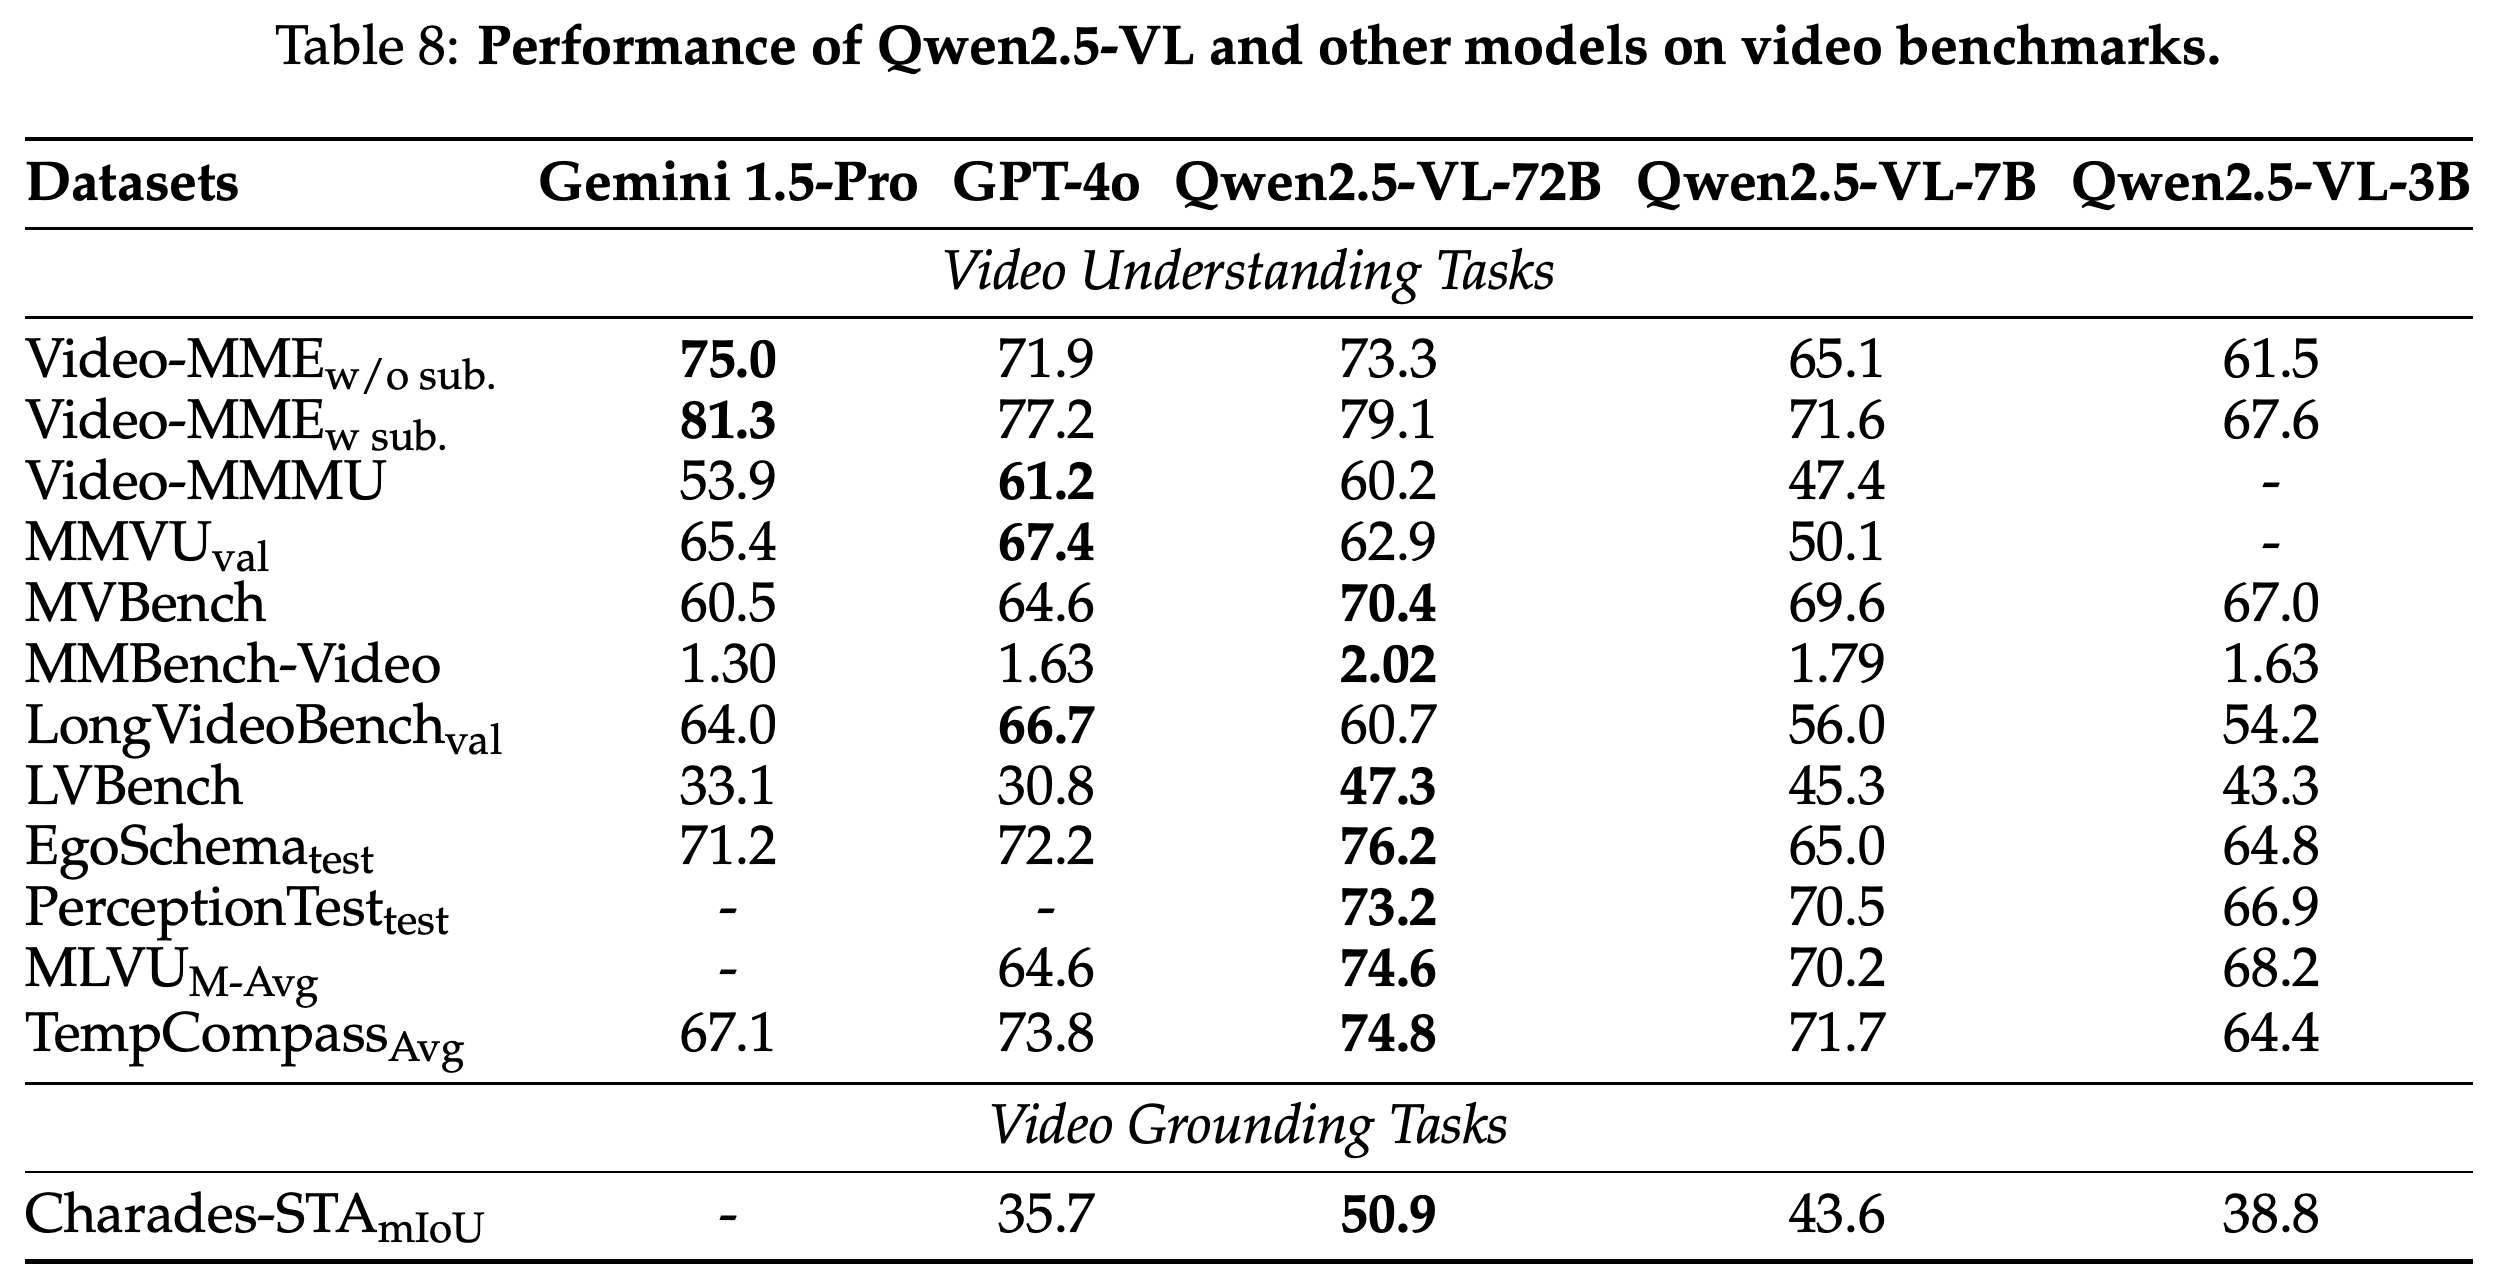
Video benchmarks span clips lasting seconds through videos lasting hours; evaluation caps each video at 768 analyzed frames and 24,576 video tokens. Qwen2.5-VL-72B scores 47.3 on LVBench and 74.6 on MLVU M-Avg, both long-video understanding evaluations, versus GPT-4o’s 30.8 and 64.6.
- On Charades-STA temporal grounding, which locates an event’s time interval, the model achieves 50.9 mean intersection over union, a measure of overlap between predicted and reference intervals, versus GPT-4o’s 35.7.
- On Video-MME video understanding, scores are 73.3 without subtitles and 79.1 with subtitles, above GPT-4o’s 71.9 and 77.2 but below Gemini 1.5 Pro’s 75.0 and 81.3.
- Long-video gains vary by benchmark: LongVideoBench validation, another long-video understanding evaluation, is 60.7 versus GPT-4o’s 66.7. The token and frame limits qualify the report’s hour-scale video comparisons.
Gains over GPT-4o include LVBench and Charades-STA, while Gemini 1.5 Pro leads Video-MME and GPT-4o leads LongVideoBench. Improved temporal localization and selected long-video scores coexist with weaker results on other video evaluations.
3.3.5 Agent
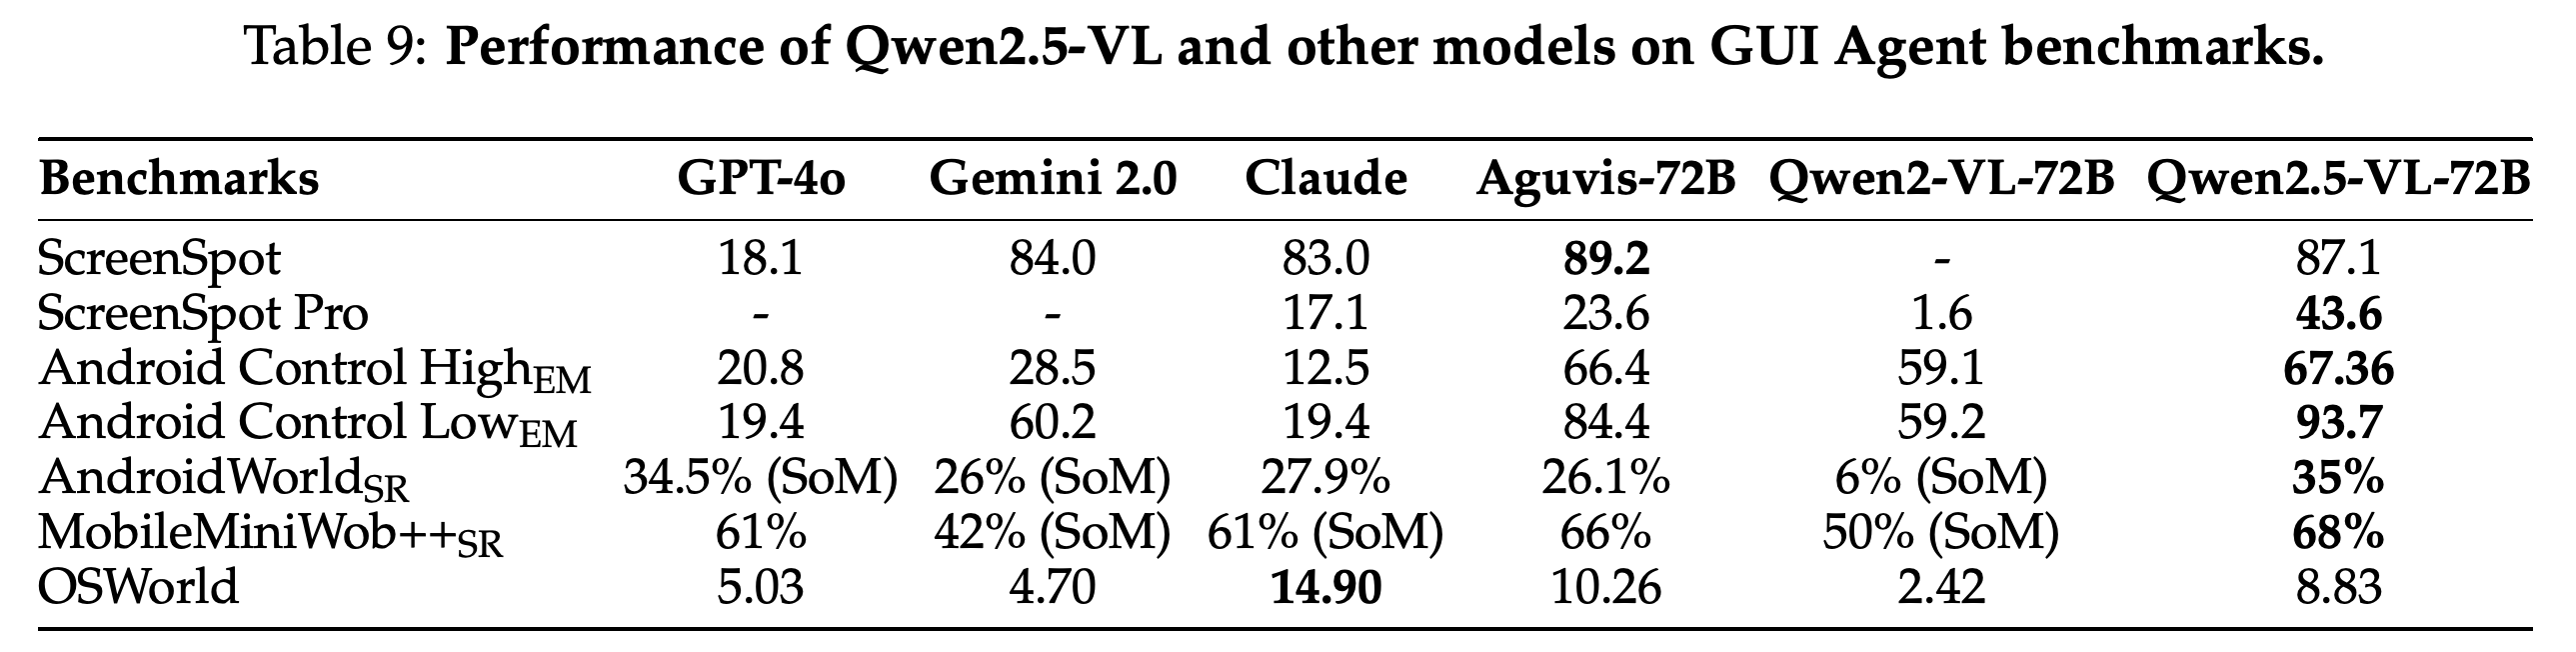
Agent evaluation separates graphical user interface (GUI) element localization, offline action prediction, and online task execution. Qwen2.5-VL-72B achieves 43.6% accuracy on ScreenSpot Pro, a high-resolution interface-localization benchmark, versus Aguvis-72B’s 23.6% and Qwen2-VL-72B’s 1.6%, while ordinary ScreenSpot localization is 87.1% versus Aguvis-72B’s 89.2%.
- On Android Control offline action prediction, High and Low exact-match scores are 67.36 and 93.7, compared with Aguvis-72B’s 66.4 and 84.4.
- Online success rates are 35% on AndroidWorld mobile tasks and 68% on MobileMiniWob++ interface tasks. Some comparison systems receive Set-of-Mark (SoM), auxiliary visual marks identifying interface elements, while Qwen2.5-VL operates without those marks.
- On OSWorld computer task execution, the score is 8.83 versus Claude’s 14.90 and Aguvis-72B’s 10.26. The desktop results are weaker than the model’s leading mobile success rates and ScreenSpot Pro localization result.
ScreenSpot Pro and Android Control show large improvements over Qwen2-VL-72B, but OSWorld remains below Claude and Aguvis-72B. Online comparisons mix systems with and without auxiliary Set-of-Mark inputs, which affects how directly their success rates can be compared.
4 Conclusion
The conclusion presents Qwen2.5-VL as a general-purpose model family combining detailed visual perception, document parsing, spatial localization, video understanding, and interactive behavior while retaining text capabilities. The benchmark tables substantiate gains in several of these areas, alongside task-specific losses that qualify the conclusion’s broad performance claims.
5 Authors
The report is attributed to Qwen Team, Alibaba Group. Its Authors section separately lists Core Contributors and Contributors, with the latter list explicitly marked as alphabetical.
Appendix
- The supplied 23-page report contains no appendix; References occupy pages 16–23. Model resources listed on the title page are https://chat.qwenlm.ai, https://huggingface.co/Qwen, https://modelscope.cn/organization/qwen, and https://github.com/QwenLM/Qwen2.5-VL.
Brief Thoughts
Document extraction and interface localization are supported by concrete benchmark gains, making them reasonable starting points for application testing. Chinese document edit distance, referring-expression localization, LongVideoBench, and OSWorld identify tasks where competing systems perform better. Architecture, data scale, filtering, and post-training change together. Without controlled ablations, the report cannot establish how much each change contributes. Window attention reduces attention work in most encoder layers, but the report supplies no dedicated latency, memory, or throughput comparison. Deployment efficiency has less direct empirical support than benchmark accuracy. Agent comparisons include different auxiliary-mark conditions, and the evaluation tables provide no uncertainty estimates or repeated-run variability. Small score differences therefore provide weaker comparative evidence than the larger document and localization gaps.