


The CoT Encyclopedia: Analyzing, Predicting, and Controlling how a Reasoning Model will Think | Summary
15 May 2025 | Paper Review Reasoning LLM Evaluation Model MergingContents
This article explains the key points of The CoT Encyclopedia: Analyzing, Predicting, and Controlling how a Reasoning Model will Think.
- 2025-05-15 (arXiv)
- Lee, Seongyun, Kim, Seungone, Seo, Minju, Jo, Yongrae, Go, Dongyoung, Hwang, Hyeonbin, Park, Jinho, Yue, Xiang, Welleck, Sean, Neubig, Graham, et al.
- KAIST AI, Carnegie Mellon University, LG AI Research, NAVER Search US, Cornell University
- Paper
Summary
- The paper studies how to describe, predict, and steer the strategies expressed in chain-of-thought (CoT), the intermediate reasoning steps a model generates before its final answer. On GPQA-Diamond, a reasoning benchmark, question-specific strategy instructions increase reported aggregate accuracy from 72.7% without strategy instructions to 81.0%, under an evaluation that targets initially incorrect responses and includes previously correct responses in the aggregate.
- CoT Encyclopedia extracts opposing strategy descriptions from model outputs, converts them into embeddings, numerical representations of meaning, and clusters similar descriptions. It generates rubrics, descriptions used to distinguish opposing strategies, and uses them to classify responses; human evaluators approve its overall analyses in 92% of cases, compared with 51% for analyses using predefined cognitive behaviors.
- Classifiers trained on strategies observed in successful responses select instructions for initially unsuccessful questions. Question-specific instructions outperform dataset-wide instructions across three problem-solving benchmarks and two safety benchmarks, although the experiments measure selective correction rather than applying instructions to every question.
- Controlled training experiments compare multiple-choice (MC) questions, which provide answer options, with free-form (FF) questions, which require answers without options. Format changes produce larger measured strategy shifts than domain changes in the headline analysis, and model merging, linear interpolation between trained model weights, changes strategy distributions without additional training.
- The evidence depends on GPT-4o as an automated evaluator and a human study of 100 responses that assesses perceived reasonableness. Inconsistencies in the domain-effect table and mismatches in qualitative examples require caution when interpreting the strongest claims about training format and analysis quality.
1 Introduction
The CoT Encyclopedia: Analyzing, Predicting, and Controlling how a Reasoning Model will Think studies which strategies reasoning models express, how those strategies vary across tasks and models, and whether instructions can improve outcomes. Existing analyses often detect fixed behaviors such as backtracking, revisiting earlier decisions, or subgoal setting, dividing a problem into intermediate objectives; the paper argues that these categories constrain discovery.
- Its alternative derives categories from generated responses and connects the resulting profiles to correctness, safety, training data, and model weight interpolation.
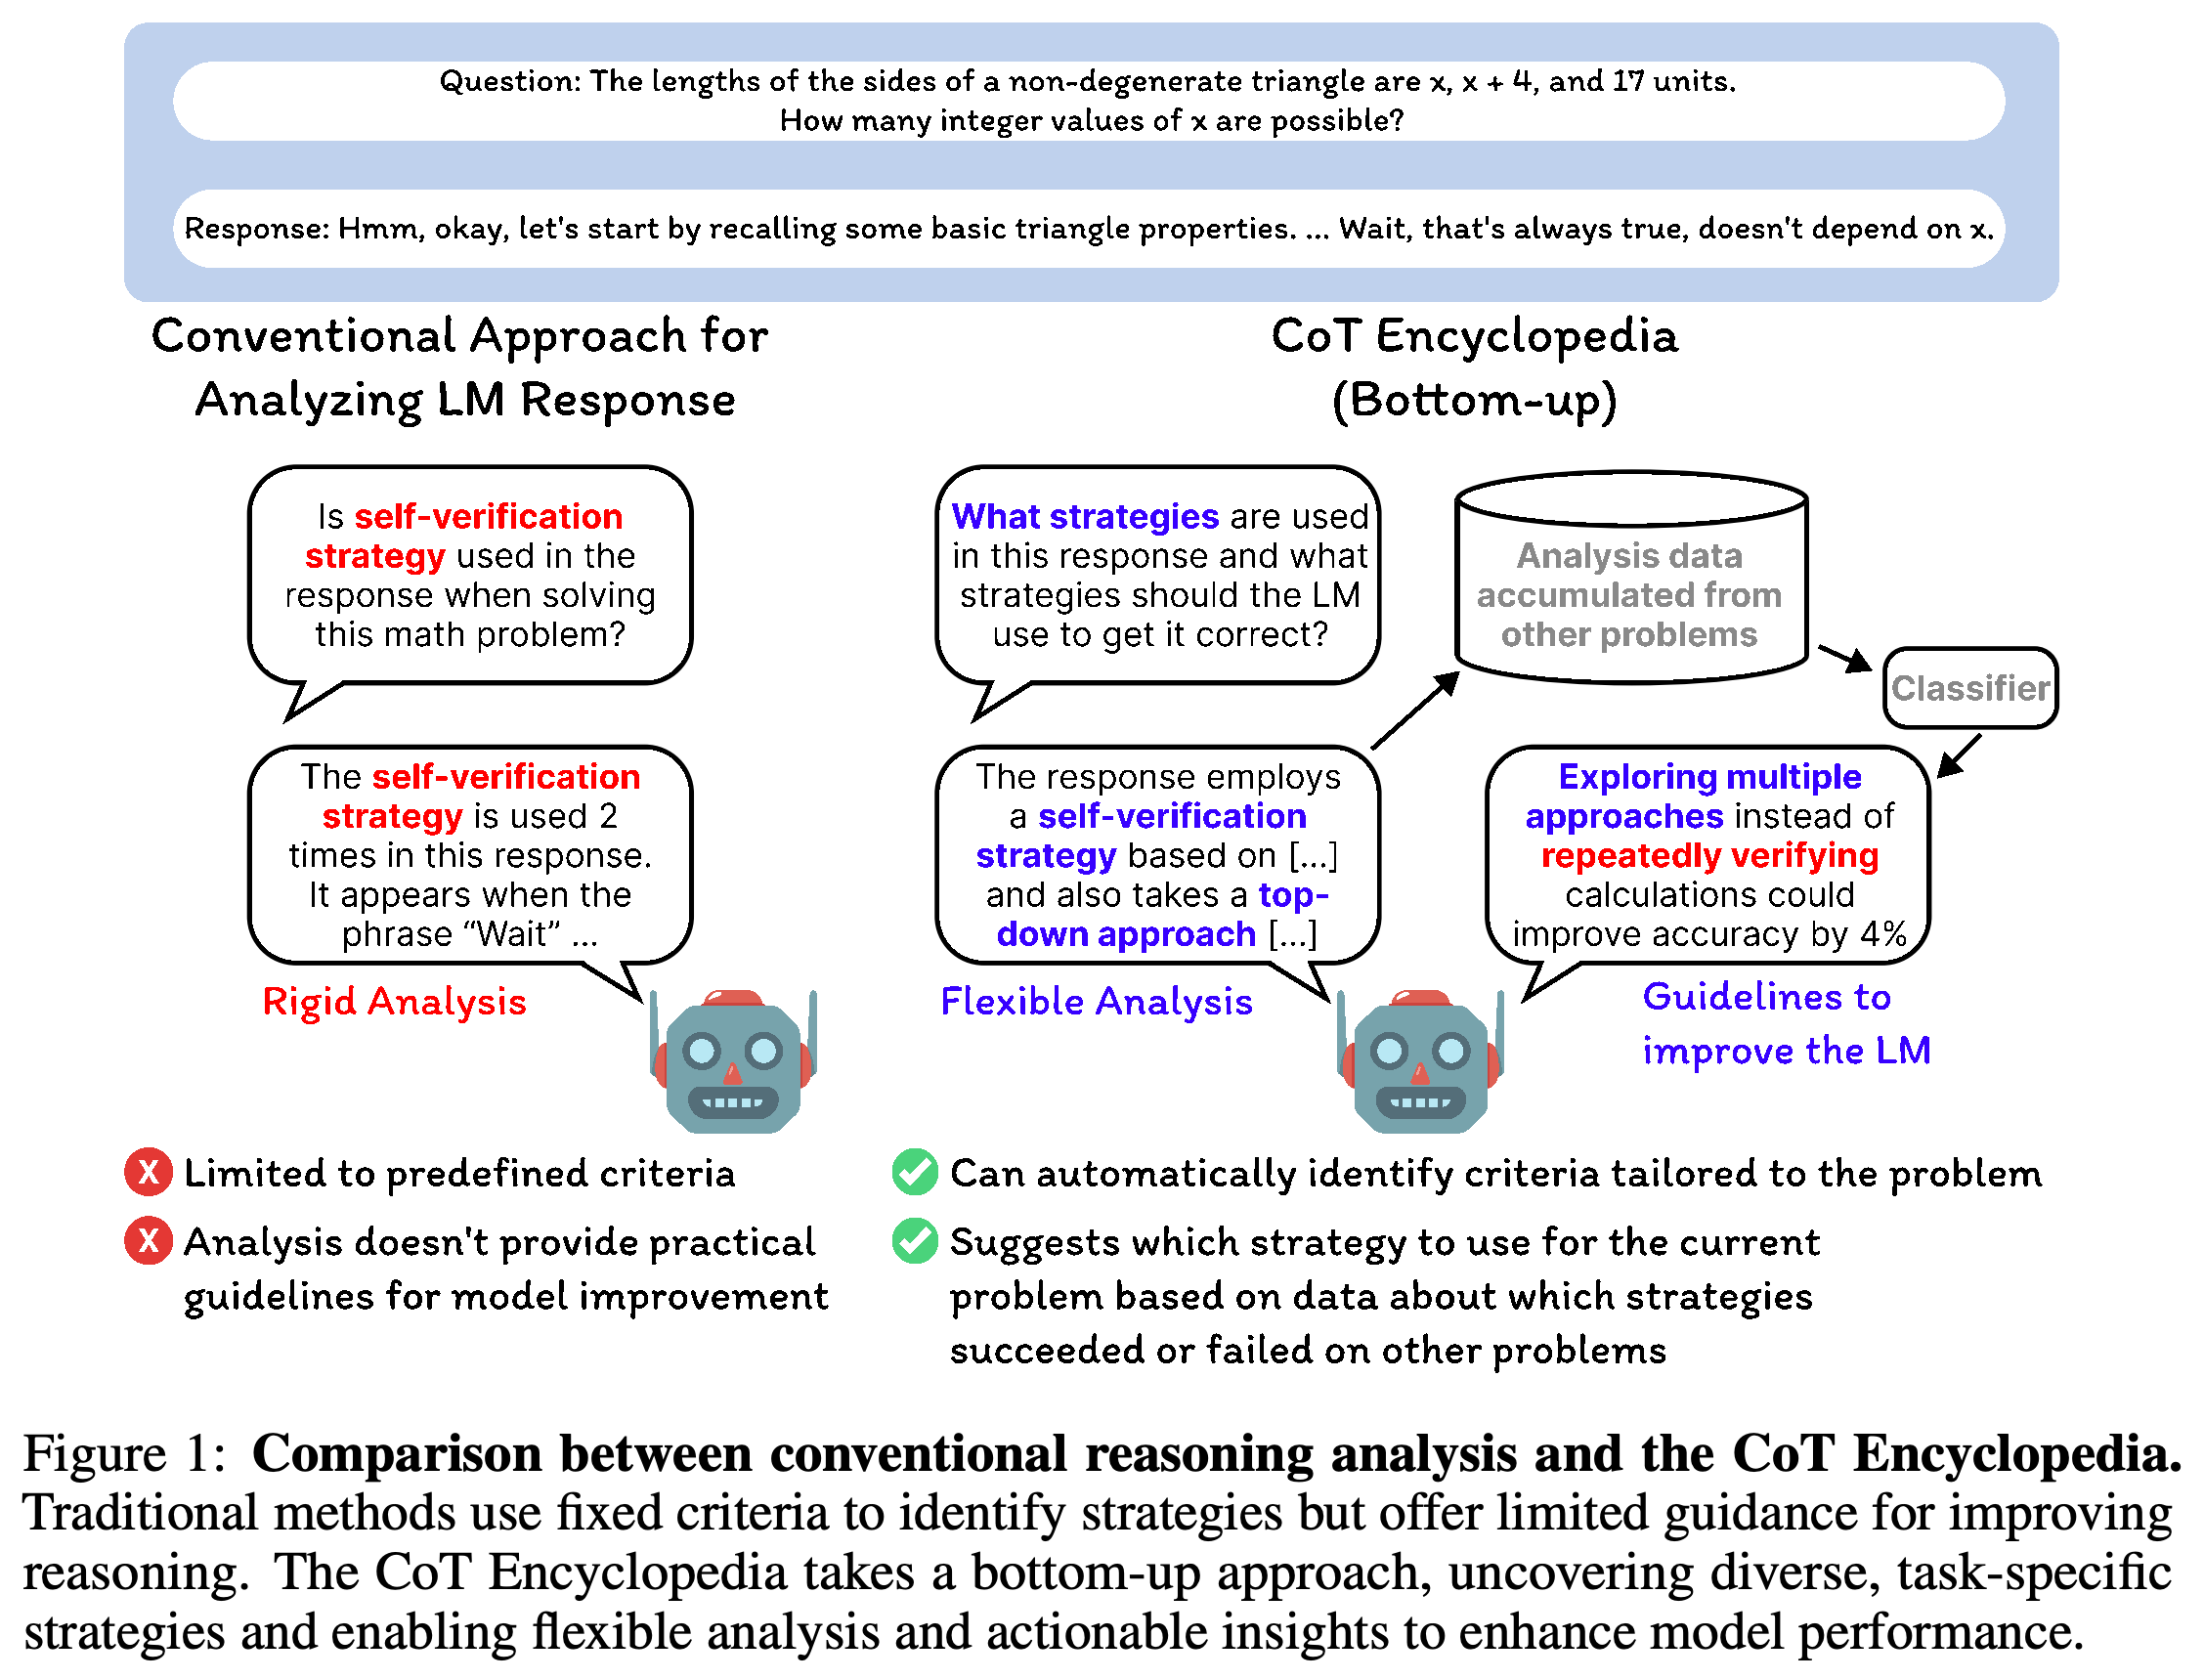
- Figure 1 illustrates the transition from detecting a predefined behavior to recommending strategies using outcomes accumulated from other questions. Its illustrated 4% improvement is a schematic example.
The diagram contrasts counting a predefined behavior with extracting several strategies and recommending an alternative using accumulated outcomes. Its 4% improvement is illustrative and should not be treated as a measured result.
2 Related Work
The related work separates methods that increase inference-time reasoning computation from methods that analyze strategies appearing in generated responses. CoT Encyclopedia connects strategy analysis to explicit instructions and controlled training comparisons.
2.1 Scaling test-time compute through long chain-of-thought generation
Prior approaches allocate additional inference steps to difficult questions, refine answers over multiple passes, or structure the search for solutions. The paper discusses self-consistency sampling, which uses diverse reasoning paths, Tree-of-Thoughts, which organizes reasoning into a tree, and least-to-most prompting, which decomposes a task into simpler problems.
2.2 Analyzing reasoning strategies of models
Previous analyses examine recurring thought patterns, predefined cognitive behaviors, sudden insights, and structured <think> mechanisms, explicit markers for reasoning text. The paper also relates strategy analysis to example selection and targeted data generation, positioning its contribution as discovering contrasting categories directly from responses.
3 The CoT Encyclopedia
CoT Encyclopedia converts long reasoning responses into a taxonomy, an organized set of strategy categories, and then into structured profiles and natural-language reports. Categories are derived from the analyzed responses, so different tasks can produce different taxonomies.
3.1 A framework for taxonomizing reasoning strategies
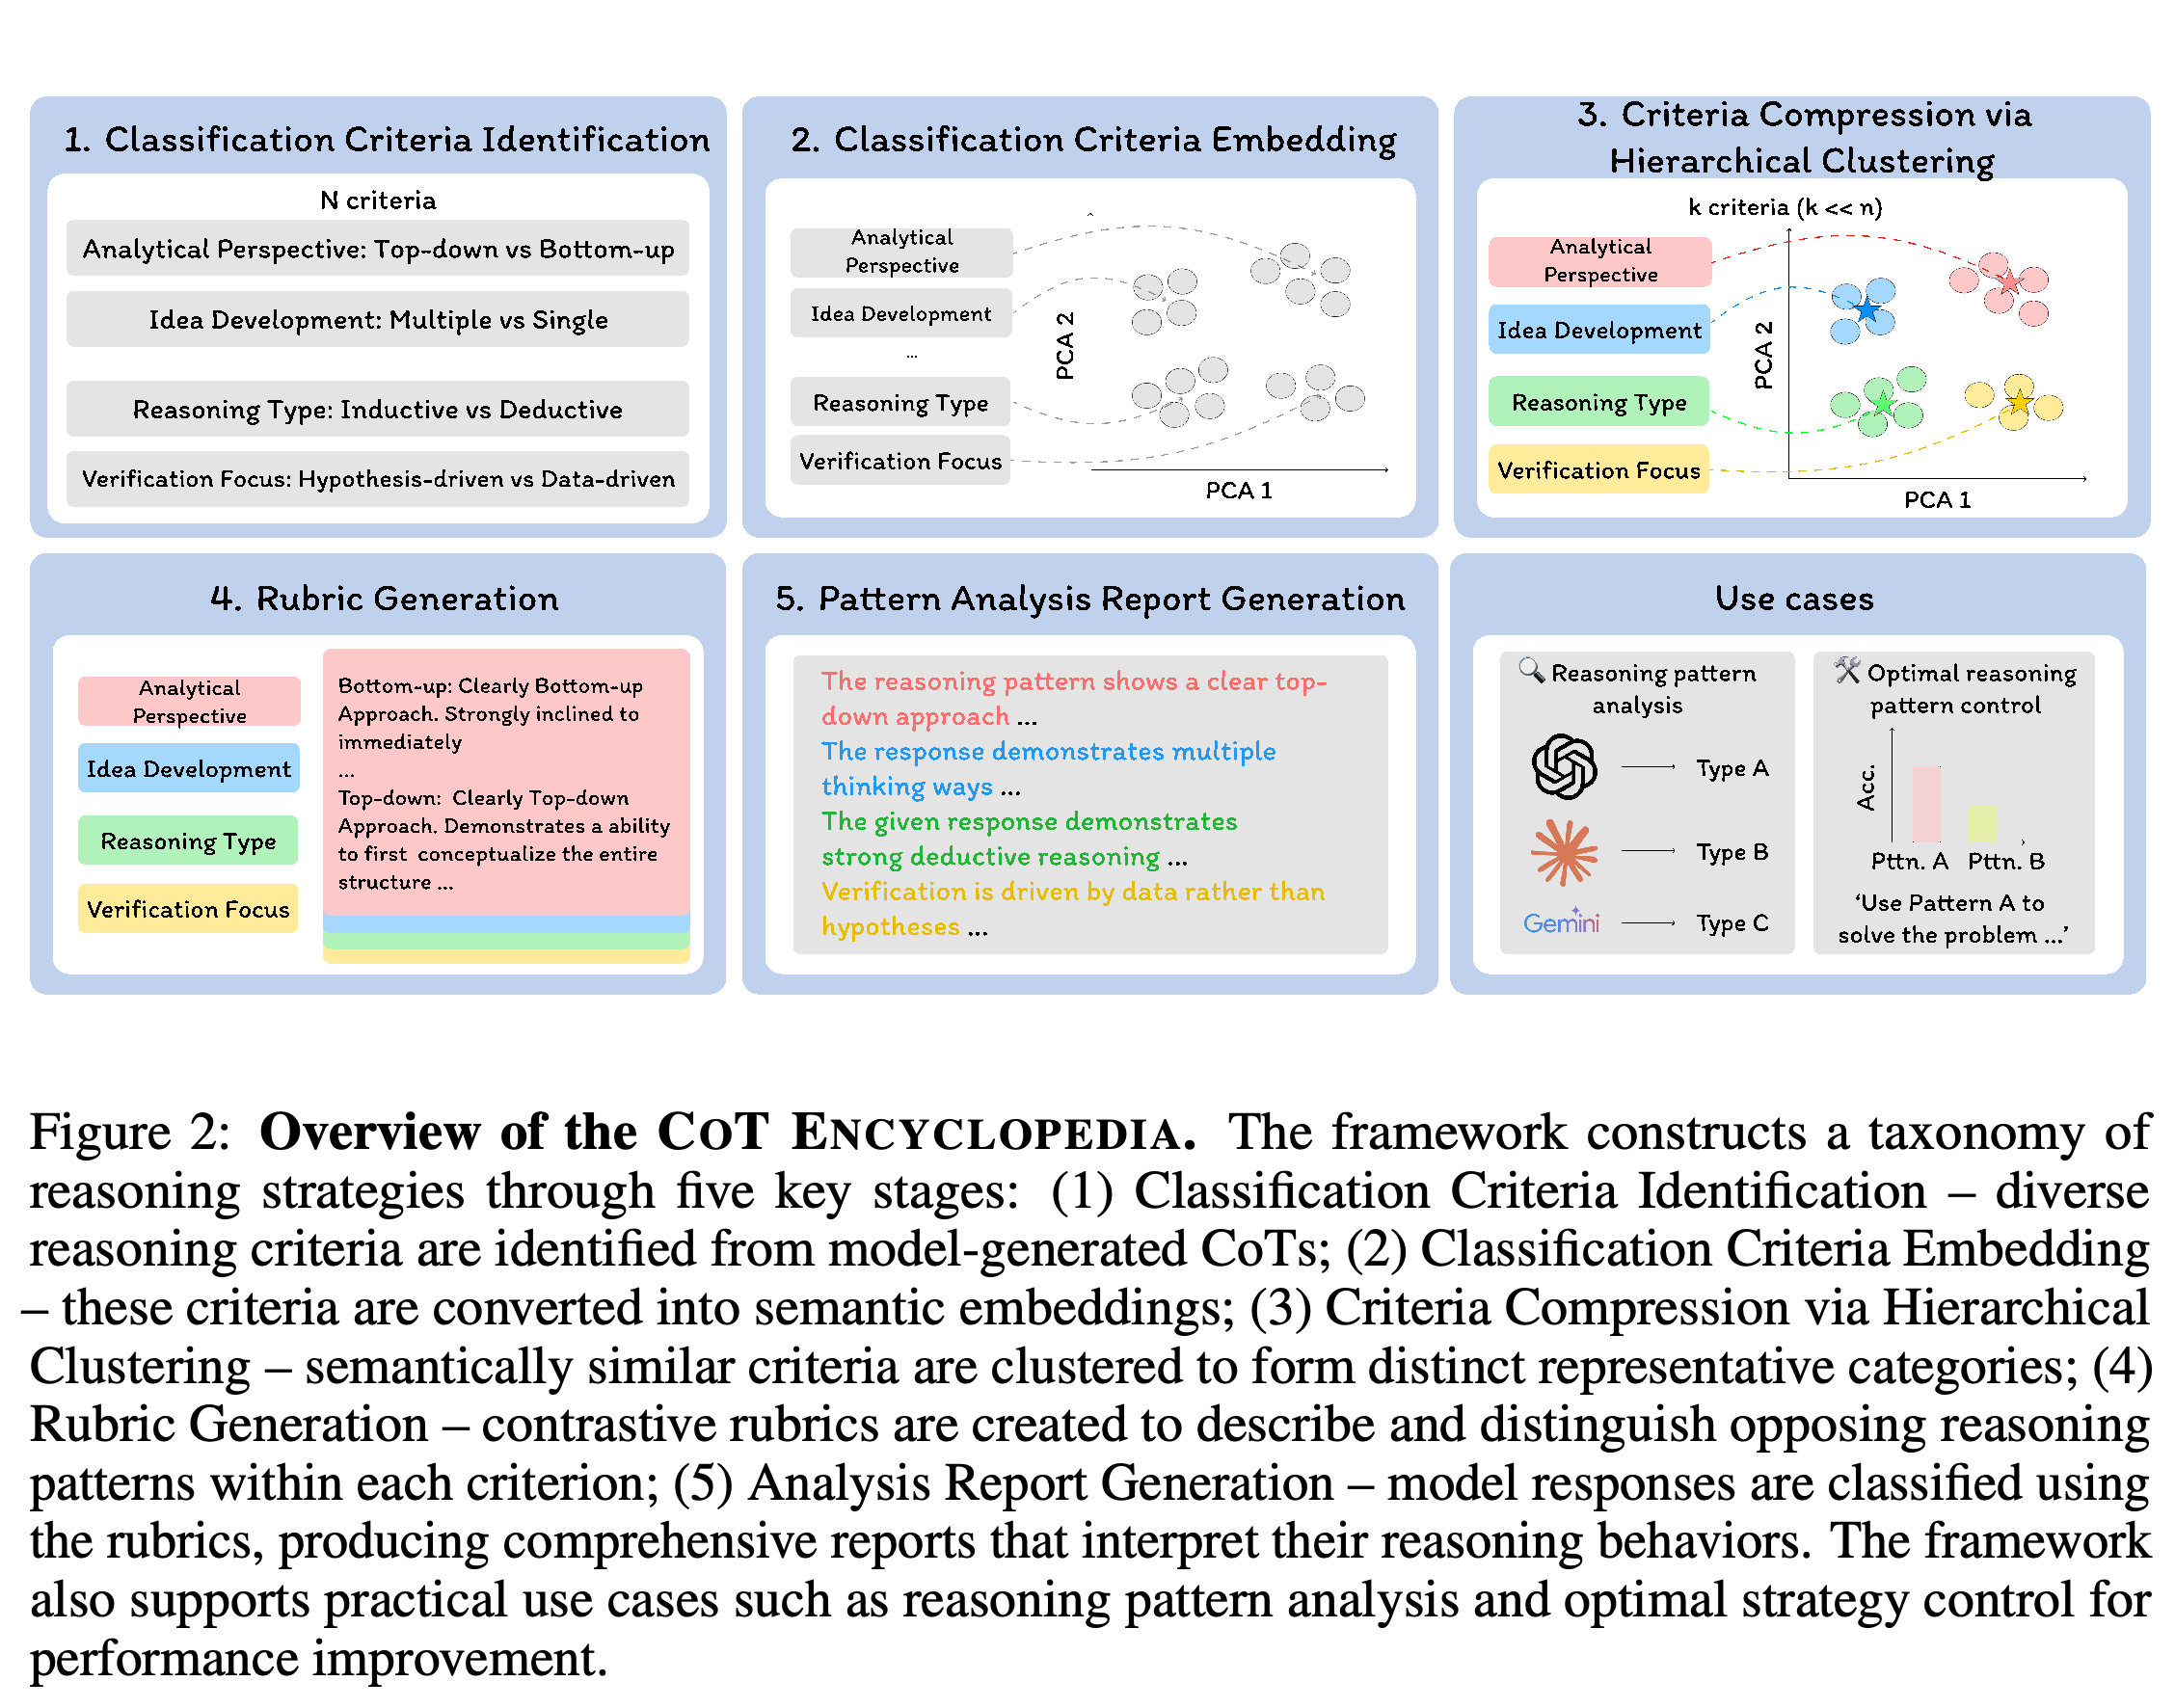
The five-stage pipeline identifies criteria with opposing strategy descriptions, embeds each criterion and its descriptions, compresses redundant criteria through clustering, generates contrastive rubrics, and classifies responses using those rubrics. Each retained criterion describes one distinction between two reasoning patterns.
- Hierarchical agglomerative clustering, which progressively groups similar criteria, uses cosine distance, a measure of directional difference between embedding vectors. Each cluster is represented by its medoid, an actual criterion selected as the cluster representative, preserving a readable description.
- Each response receives a binary label under every retained criterion, producing a strategy profile that a language model uses to compose an analysis report.
- Appendix A identifies GPT-4o as the model used for strategy identification and rubric generation, and text-embedding-3-large as the embedding model. The cluster count is selected using silhouette scores, a measure of cluster separation.
The pipeline shows how many extracted descriptions become a smaller set of readable criteria, then rubrics and response profiles. The same representation supports descriptive analysis and strategy instructions.
3.2 CoT Encyclopedia enables sharper reasoning strategy classification
The analysis uses DeepSeek-R1-Distill-Qwen-32B, s1.1-32B, and QwQ-32B responses on GPQA-Diamond, MMLU-Redux, a knowledge benchmark, and MATH-500, a mathematics benchmark. It compresses 4,057 fine-grained criteria into six dimensions: Analytical Perspective, Scope of Approach, Reasoning Type, Idea Development, Verification Focus, and Clarification Approach.
- The baseline detects verification, checking reasoning; backtracking; subgoal setting; and backward chaining, reasoning backward from a desired outcome. Chi-squared tests compare categorical distributions, and Cohen’s d measures the magnitude of distribution differences.
- The discovered criteria distinguish several model pairs more clearly than the baseline. For example, Table 4 reports a MATH-500 Clarification Approach difference with Cohen’s d = 0.44, whereas baseline behavior differences are generally much smaller.
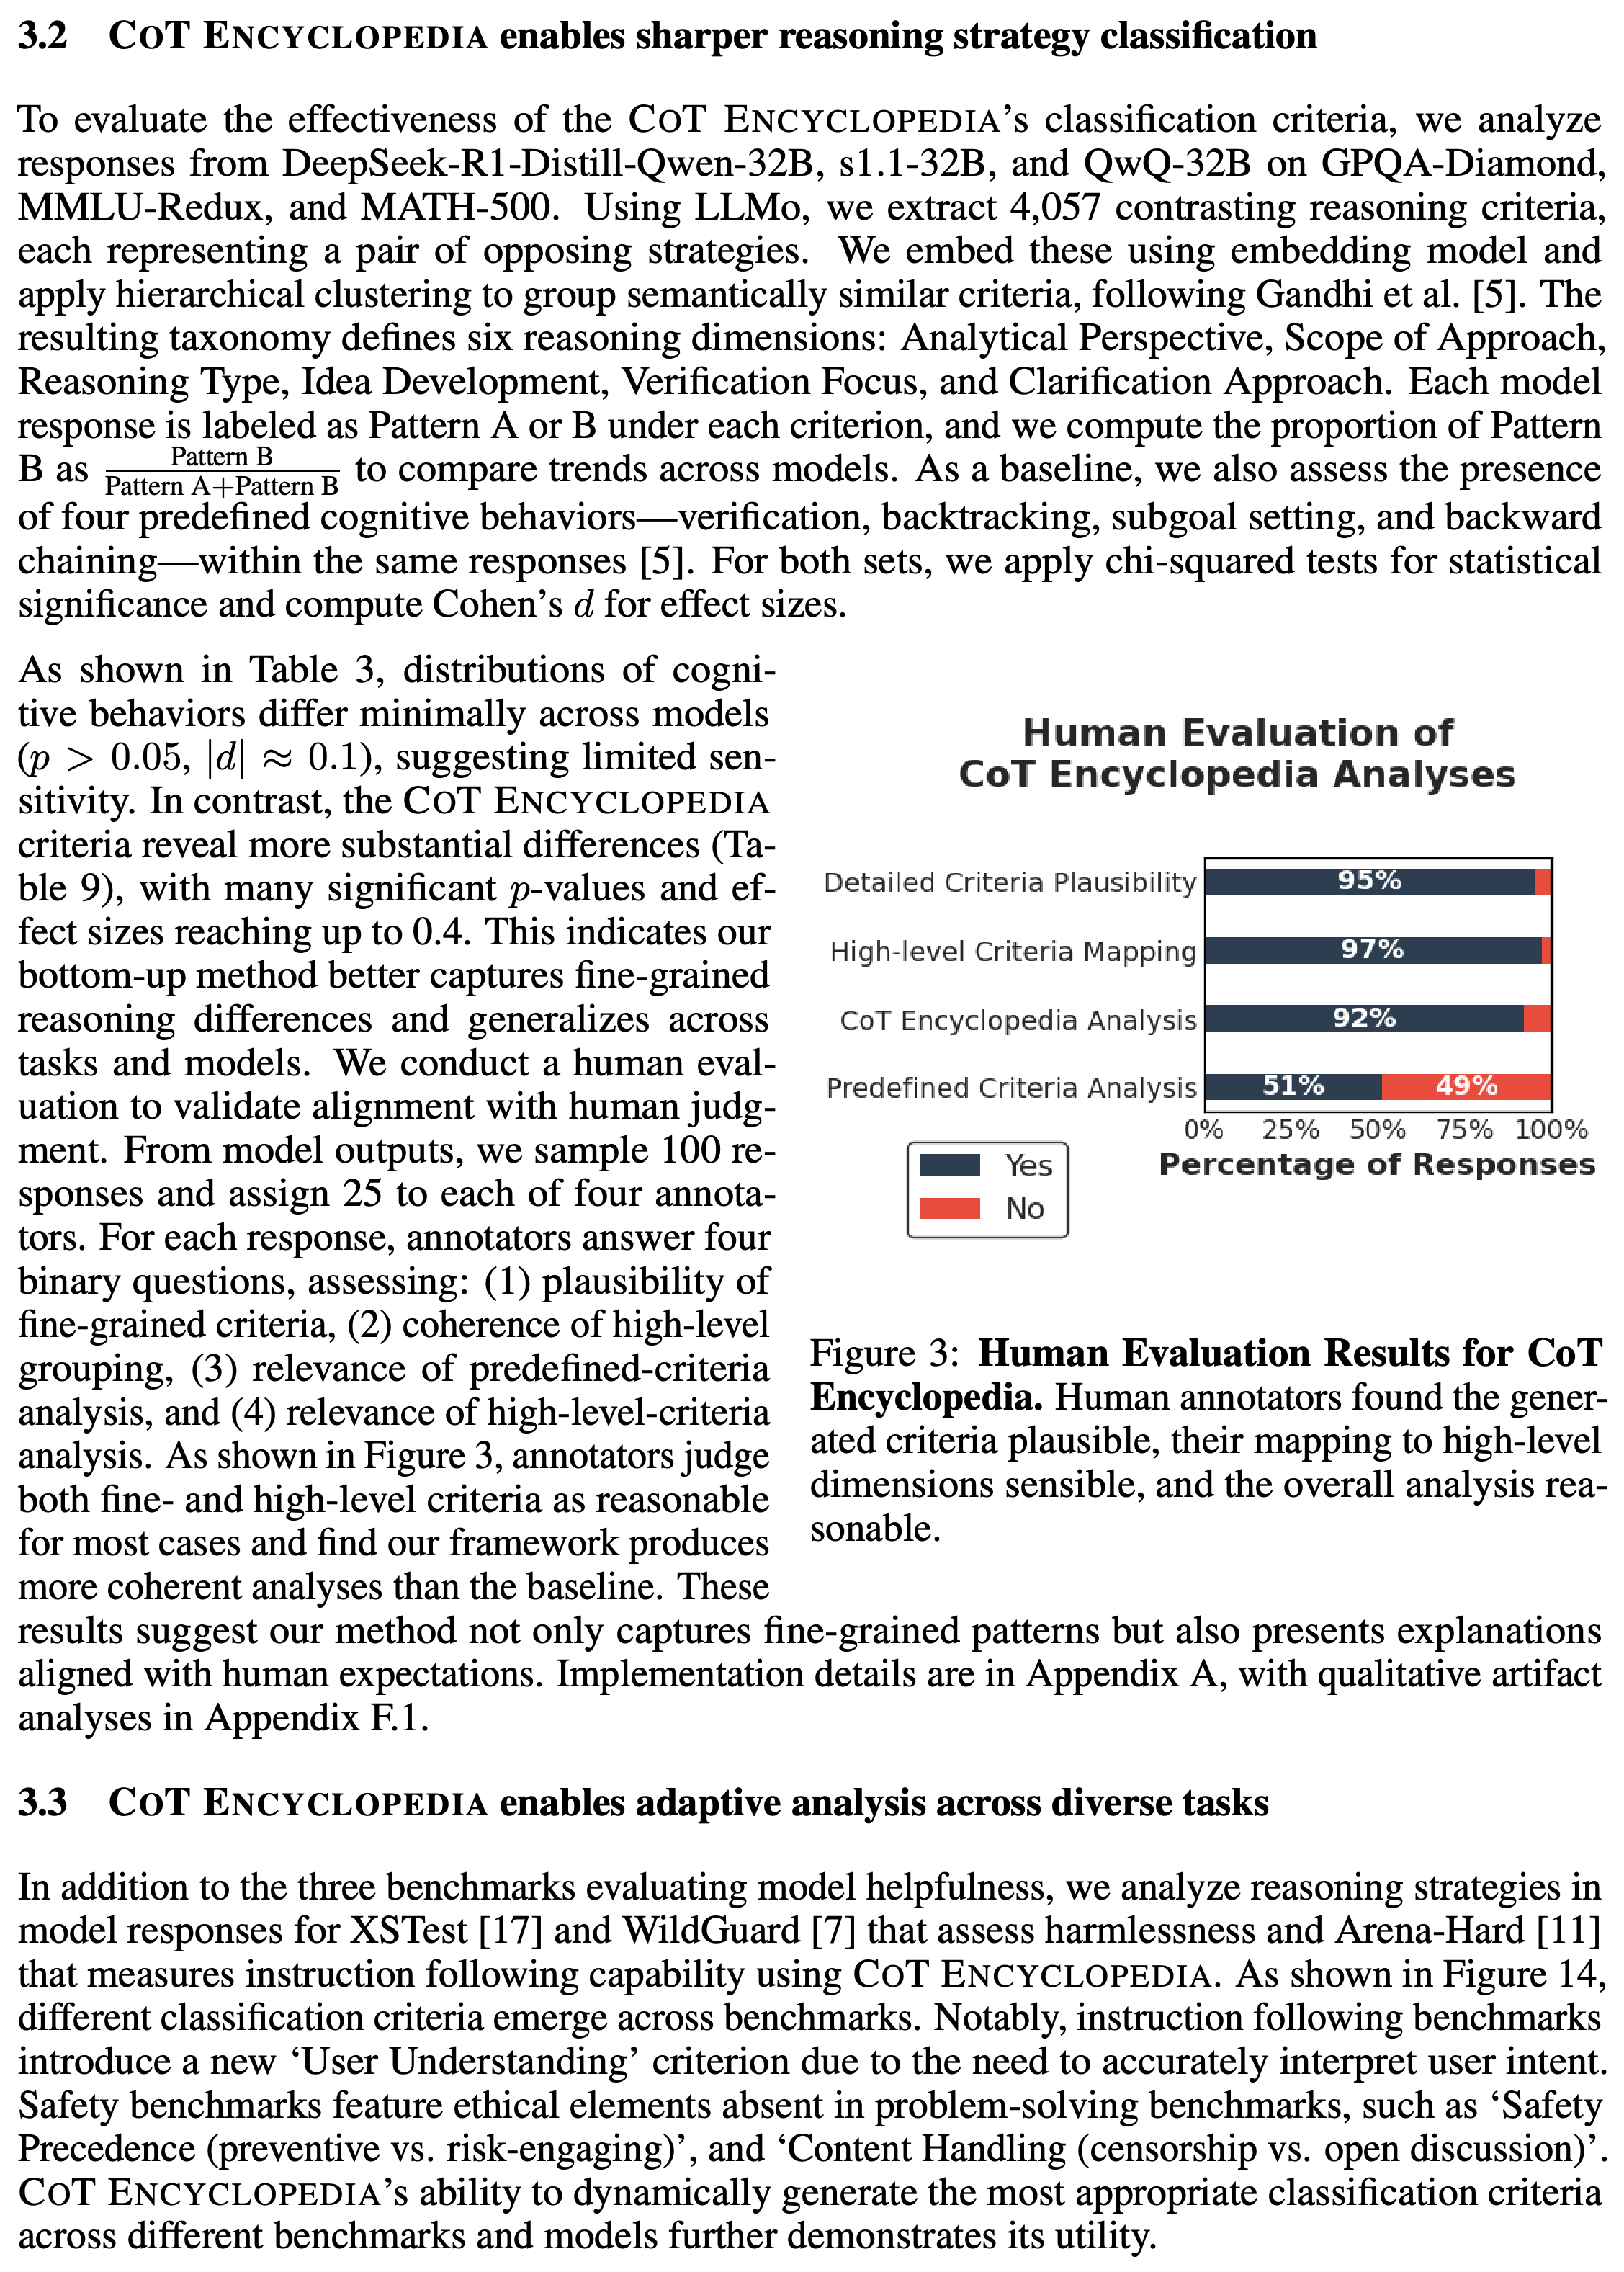
- Four annotators assess 100 responses, with 25 assigned to each annotator. Approval rates are 95% for detailed-criteria plausibility, 97% for high-level mapping, 92% for CoT Encyclopedia analysis, and 51% for predefined-criteria analysis; these measure perceived reasonableness.
Approval is 95% for detailed criteria, 97% for category mapping, and 92% for the framework’s analyses, compared with 51% for predefined-criteria analyses. These are judgments of plausibility and relevance across 100 responses, rather than verification of internal model computation.
3.3 CoT Encyclopedia enables adaptive analysis across diverse tasks
Applying the framework to XSTest and WildGuard, the paper’s safety benchmarks, and Arena-Hard, its instruction-following benchmark, produces task-specific criteria. Arena-Hard introduces User Understanding, whether a response interprets user intent, while safety analyses introduce distinctions such as preventive versus risk-engaging behavior and censorship versus open discussion.
- The benchmark-specific clusters in Figure 14 illustrate how the extracted taxonomy changes with the task. They do not establish that the criteria exhaust all relevant reasoning behaviors.
4 Enhancing model helpfulness and safety via optimal reasoning control
The control experiments ask whether strategies associated with correct or safe responses can guide subsequent generation. They first identify promising patterns at the dataset level and then predict patterns for individual questions.
4.1 Exploring optimal reasoning strategies for helpfulness and harmlessness
The authors estimate the probability of correctness or safety conditional on each strategy, averaging across three models and using six problem-solving criteria and seven safety criteria. They target initially incorrect or unsafe responses under no instruction, suboptimal instructions, random instructions, or dataset-wide optimal instructions.
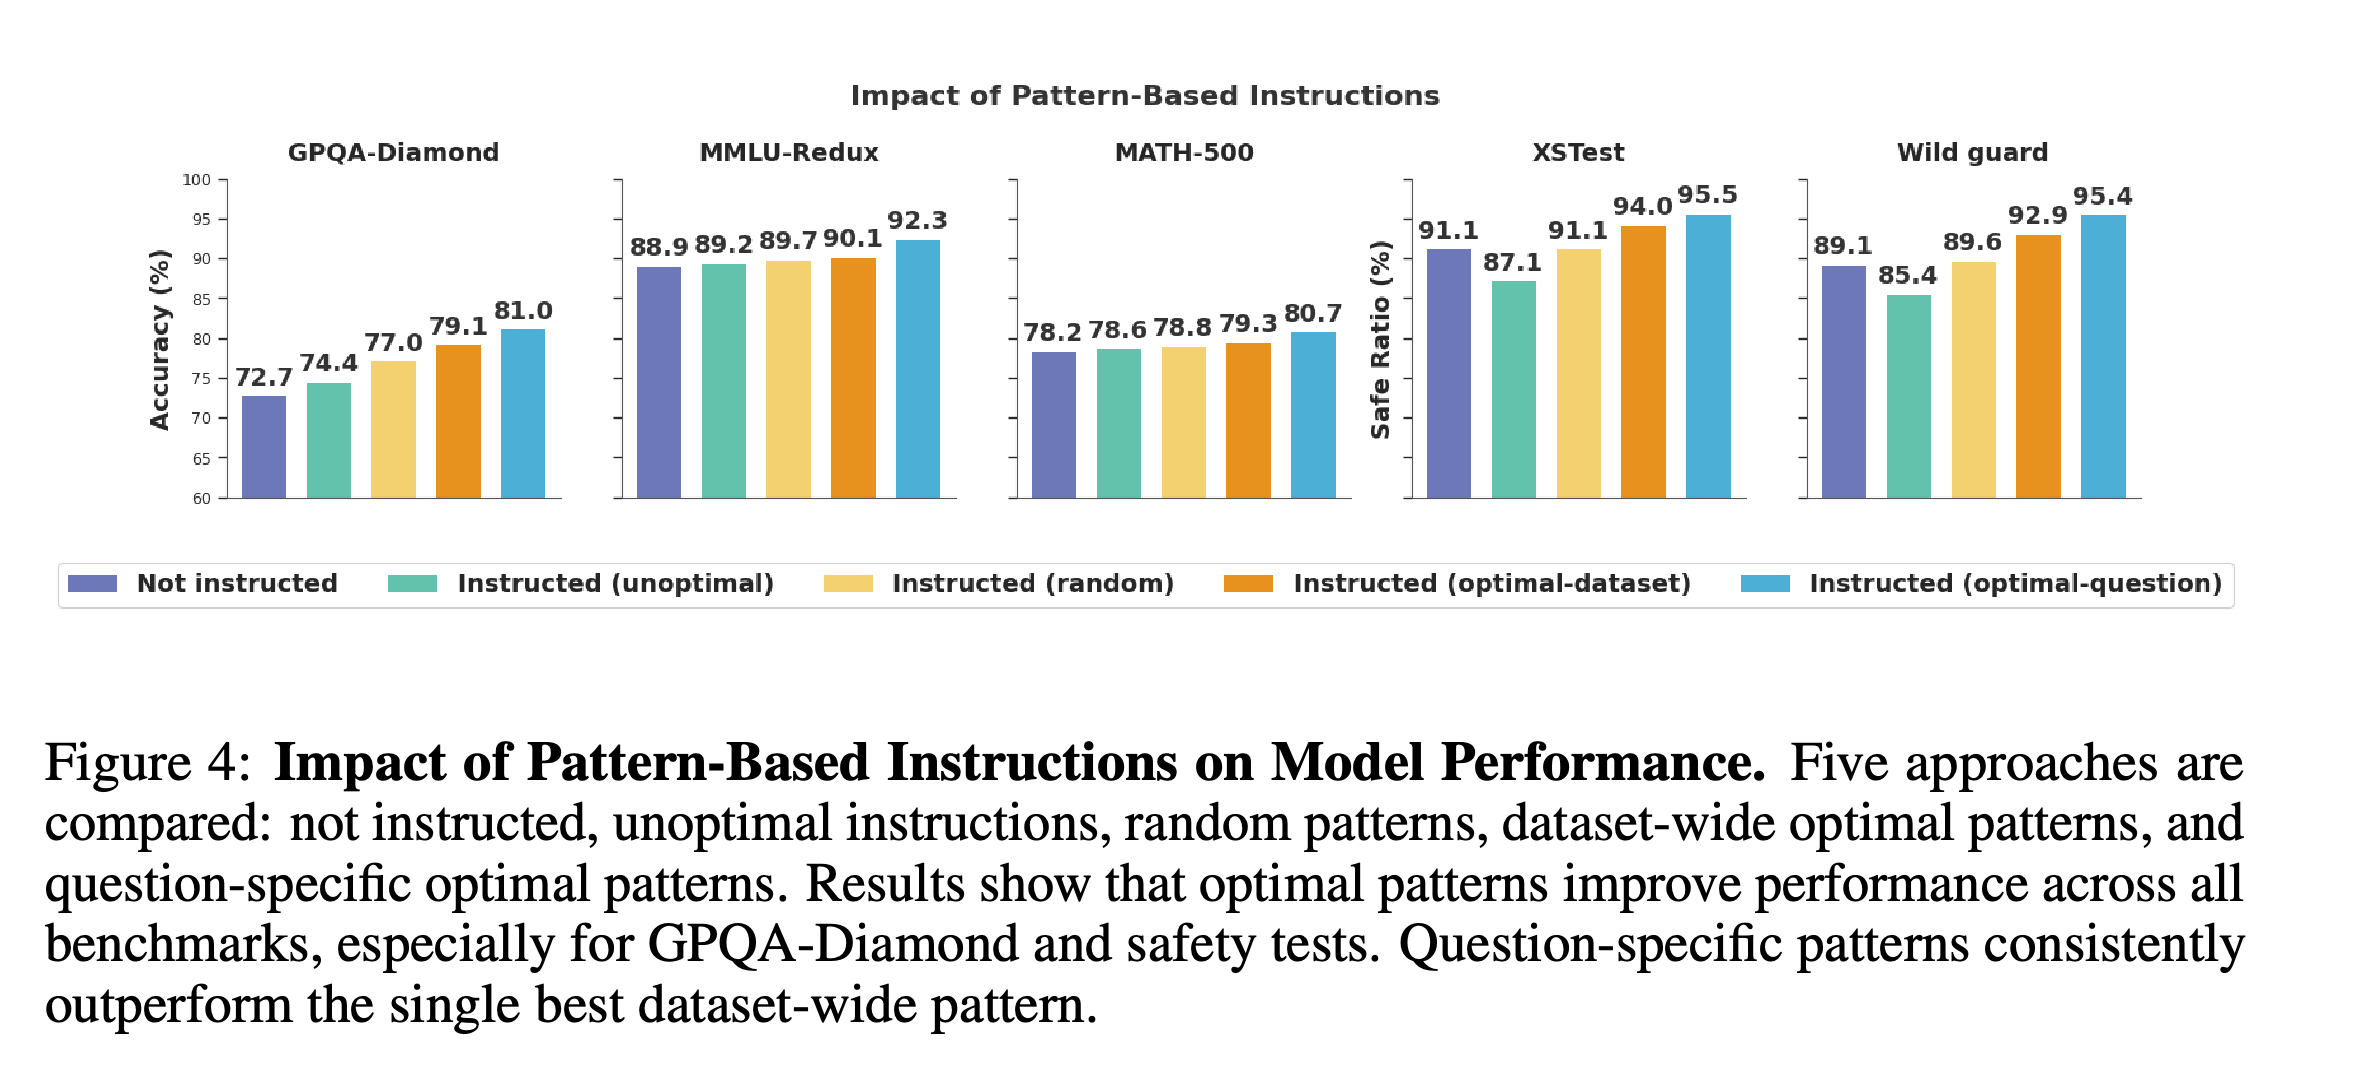
- Dataset-wide optimal instructions raise reported aggregate GPQA-Diamond accuracy from 72.7% to 79.1%, XSTest safe-response ratio from 91.1% to 94.0%, and WildGuard safe-response ratio from 89.1% to 92.9%. These aggregates include previously successful responses and successful corrections.
- The no-instruction condition provides a baseline, while random and suboptimal instructions help assess whether strategy selection matters. Figure 11 separately reports results focused on initially unsuccessful responses.
- Safety is the proportion labeled safe by LLaMA-Guard-3 8B, an automated response evaluator. This metric does not separately establish whether benign requests receive useful answers.
4.2 Similar inputs, Similar thoughts: How models approach related problems
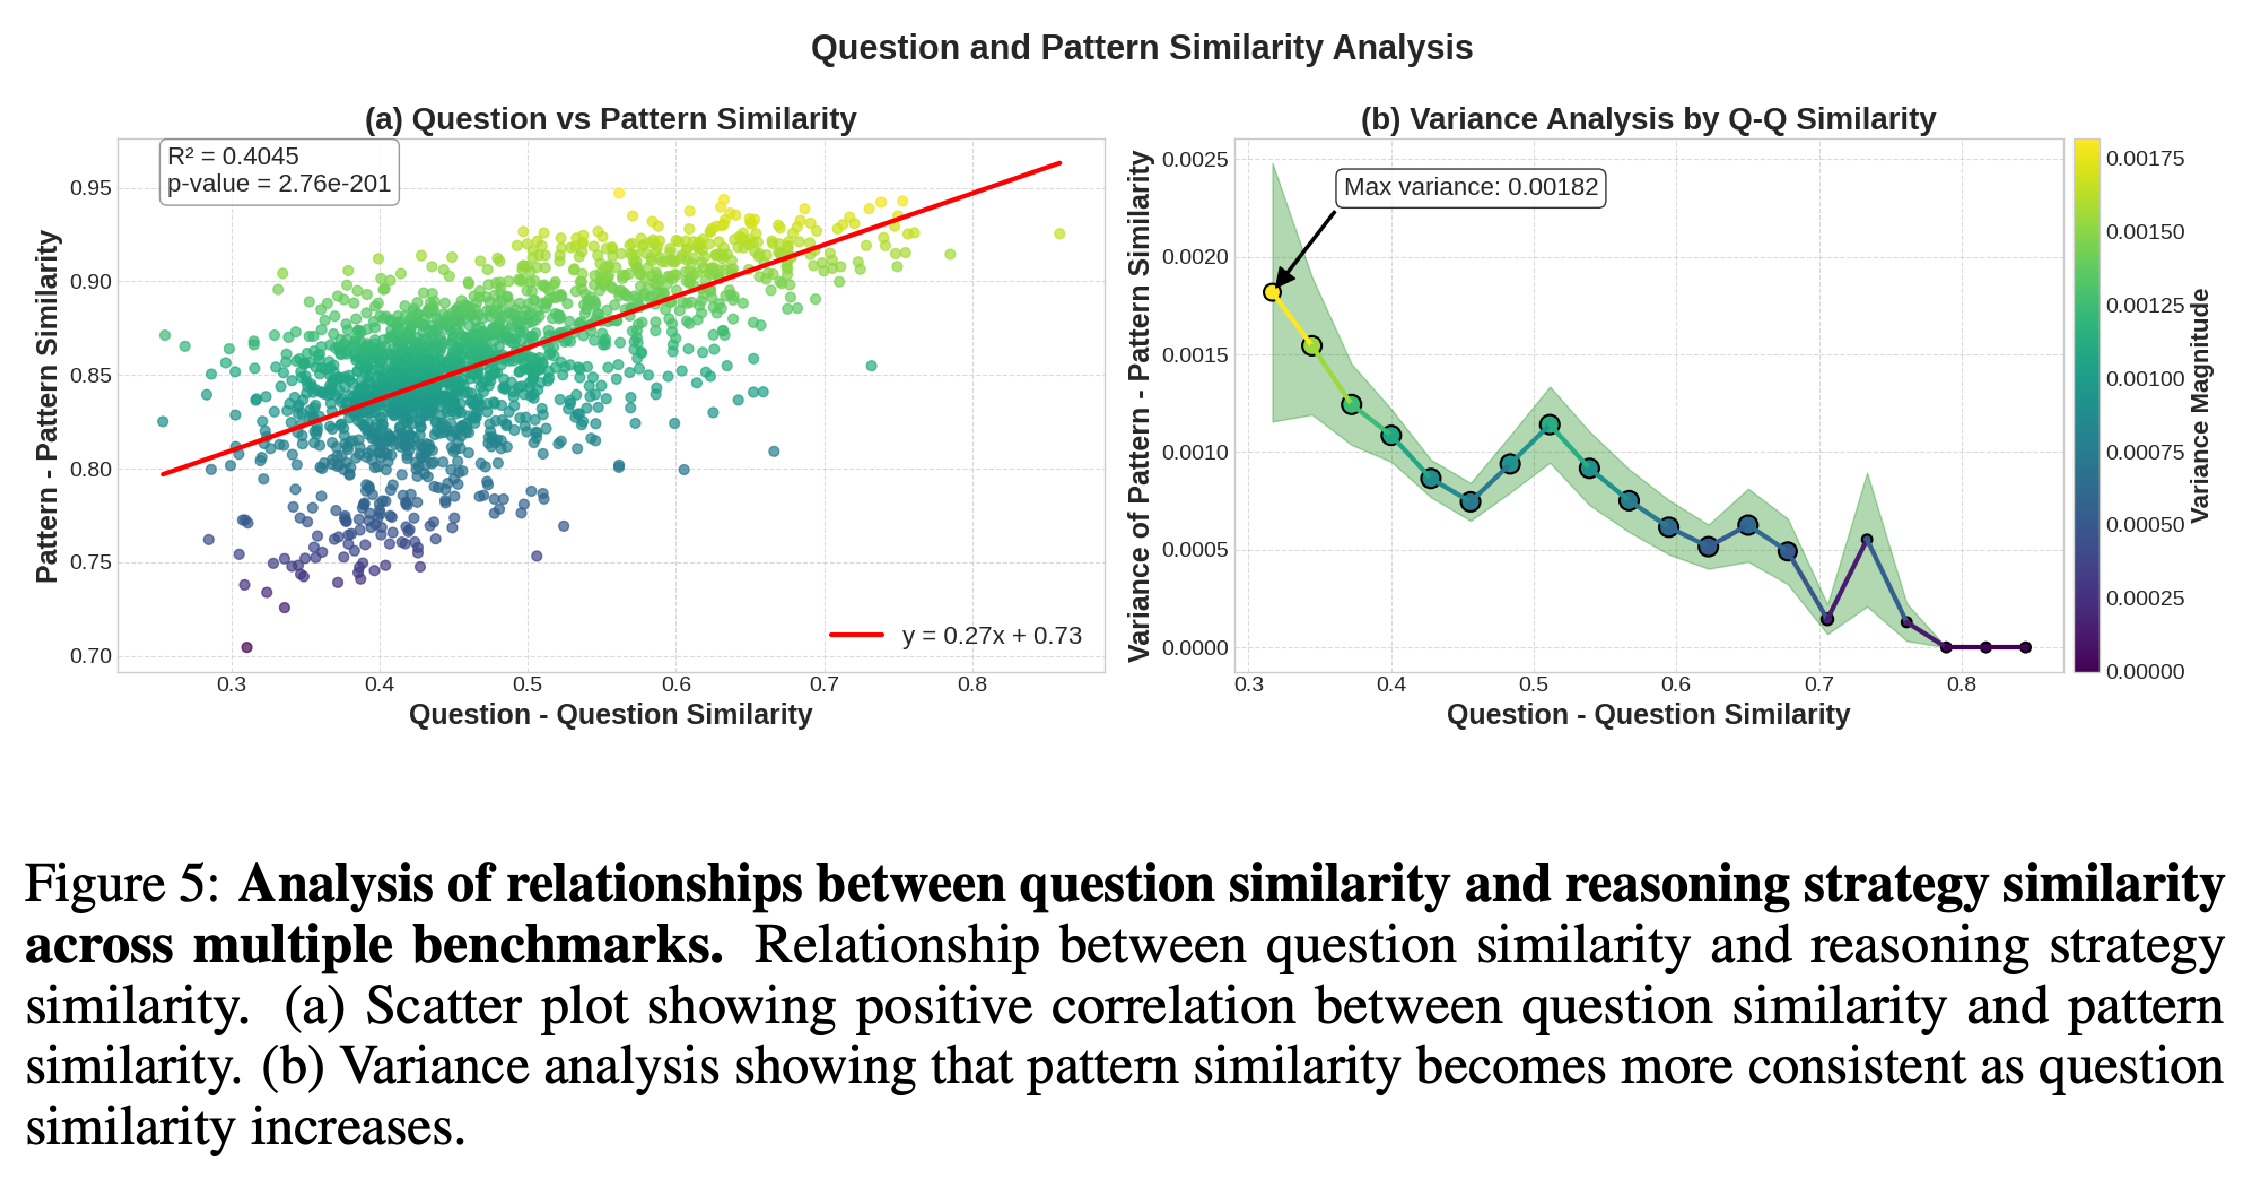
Using correct responses from three models on the three problem-solving benchmarks, the paper regresses strategy similarity against question similarity in embedding space. Figure 5 reports \(R^2 = 0.4045\), the proportion of variation explained by the fitted relationship, with strategy similarity becoming less variable as question similarity increases.
- This association motivates predicting strategies from questions. It does not establish that an observed strategy caused the original answer to be correct.
4.3 Predicting question-specific optimal reasoning strategies
Binary classifiers, one per criterion, learn from questions initially answered correctly and predict strategy instructions for initially incorrect questions. The paper considers in-domain evaluation, training and testing on the same benchmark, and cross-domain evaluation, training on two benchmarks and testing on a third.
- Question-specific instructions yield aggregate accuracies of 81.0%, 92.3%, and 80.7% on GPQA-Diamond, MMLU-Redux, and MATH-500, respectively. The corresponding no-instruction values are 72.7%, 88.9%, and 78.2%, giving increases of 8.3, 3.4, and 2.5 percentage points.
- XSTest and WildGuard reach safe-response ratios of 95.5% and 95.4%, compared with 91.1% and 89.1% without strategy instructions.
- Figure 13 reports higher scores for trained classifiers than GPT-4o zero-shot prompting, which supplies no examples, or four-shot prompting, which supplies four examples. Its safety panels are labeled Safe Response Ratio despite the question-to-pattern prediction framing, leaving the metric interpretation ambiguous.
Question-specific instructions give the highest reported aggregate score on all five benchmarks. GPQA-Diamond increases from 72.7% to 81.0%; the aggregate includes previously successful responses and corrections of initially unsuccessful responses.
The positive fitted relationship has R² = 0.4045, while the second panel shows declining variance in strategy similarity as questions become more similar. This motivates predicting strategies from questions without establishing that an associated strategy causes success.
5 Analyzing pathways to reasoning strategies: Data selection and interpolation
The training experiments investigate how data presentation and subject matter affect strategies expressed after training. A separate experiment linearly combines the weights of models trained on different formats to test whether their strategy distributions can be interpolated.
5.1 Format matters more than domain in shaping reasoning strategies
The authors train 7B DeepSeek-R1-Distill models with Reinforcement Learning with Verifiable Rewards (RLVR), training that rewards answers whose correctness can be checked. Format comparisons use NuminaMath, a mathematics dataset, in its original free-form version and a synthetic five-choice version; domain comparisons hold multiple-choice presentation constant while comparing mathematical and knowledge/common-sense data.
- All training datasets contain 100k examples. Knowledge/common-sense sources include OpenBookQA, QASC, SciQ, CommonsenseQA, ARC-Challenge, and MCQA 68k.
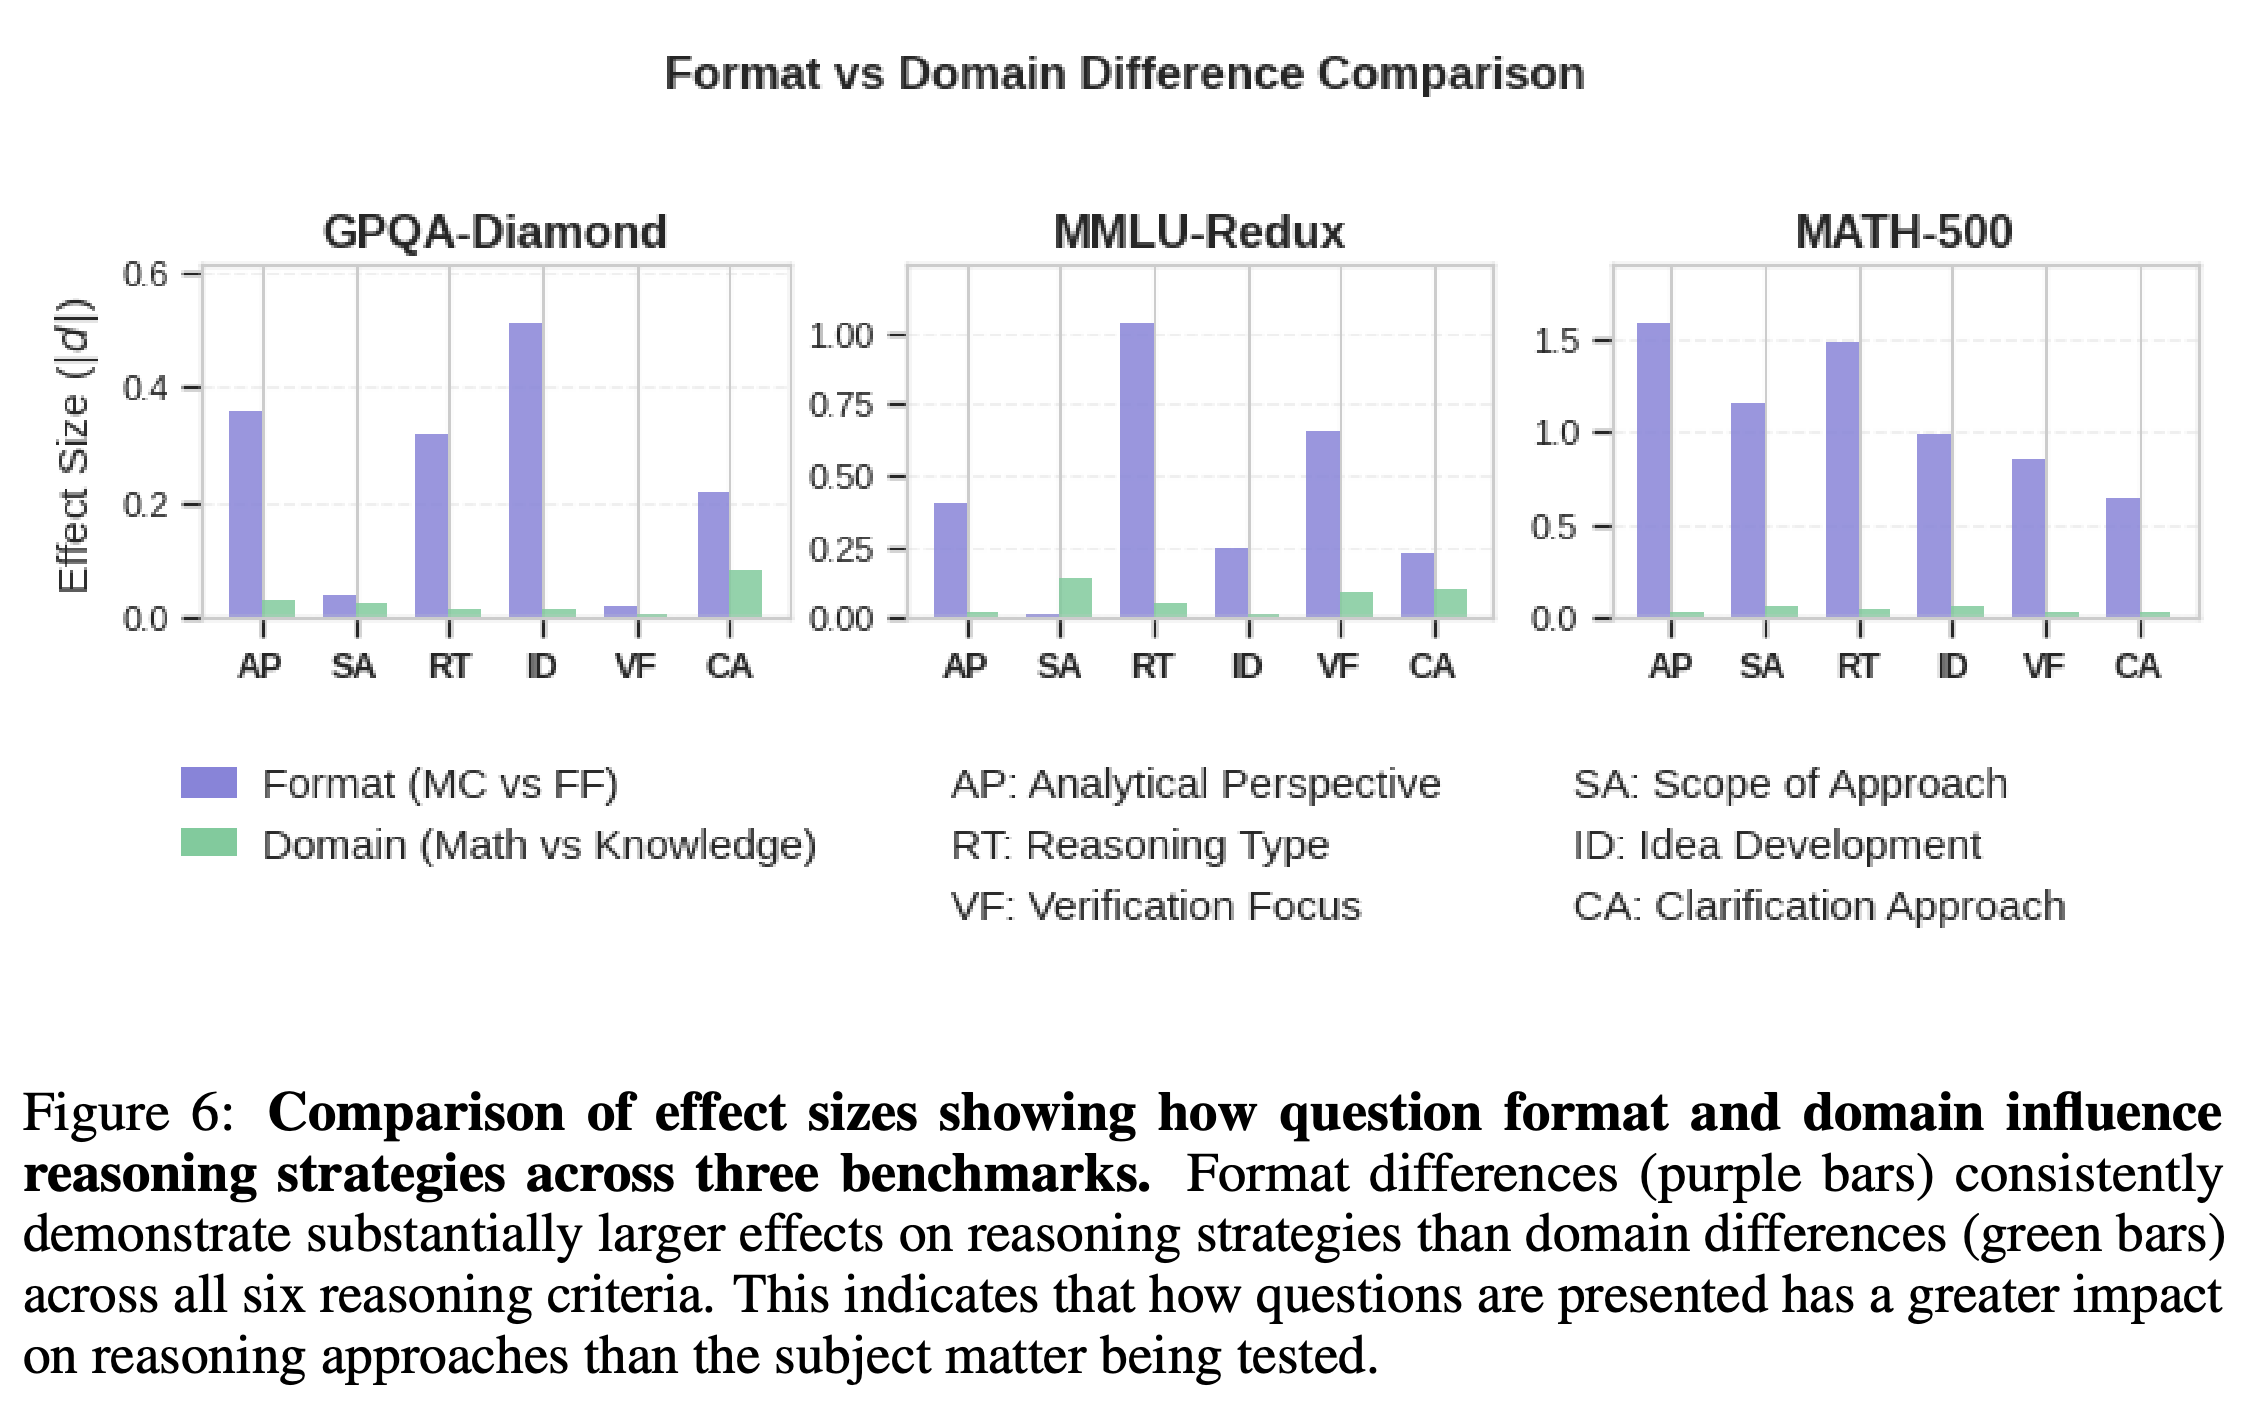
- Figure 6 generally shows larger format effects than domain effects, and Table 10 reports a maximum format effect of Cohen’s d = 1.58 for MATH-500 Analytical Perspective.
- The claim that domain effects are consistently below 0.2 conflicts with Table 11, which lists MATH-500 effects of 0.37 and 0.44. That table also marks five comparisons significant, whereas its caption states four out of 18; the domain-effect results require reconciliation.
The plotted format effects generally exceed domain effects, especially on MATH-500. Table 11 nevertheless reports domain effects of 0.37 and 0.44 that conflict with the small domain bars and the claim that all domain effects remain below 0.2.
5.2 Impact of training data format on model reasoning behavior
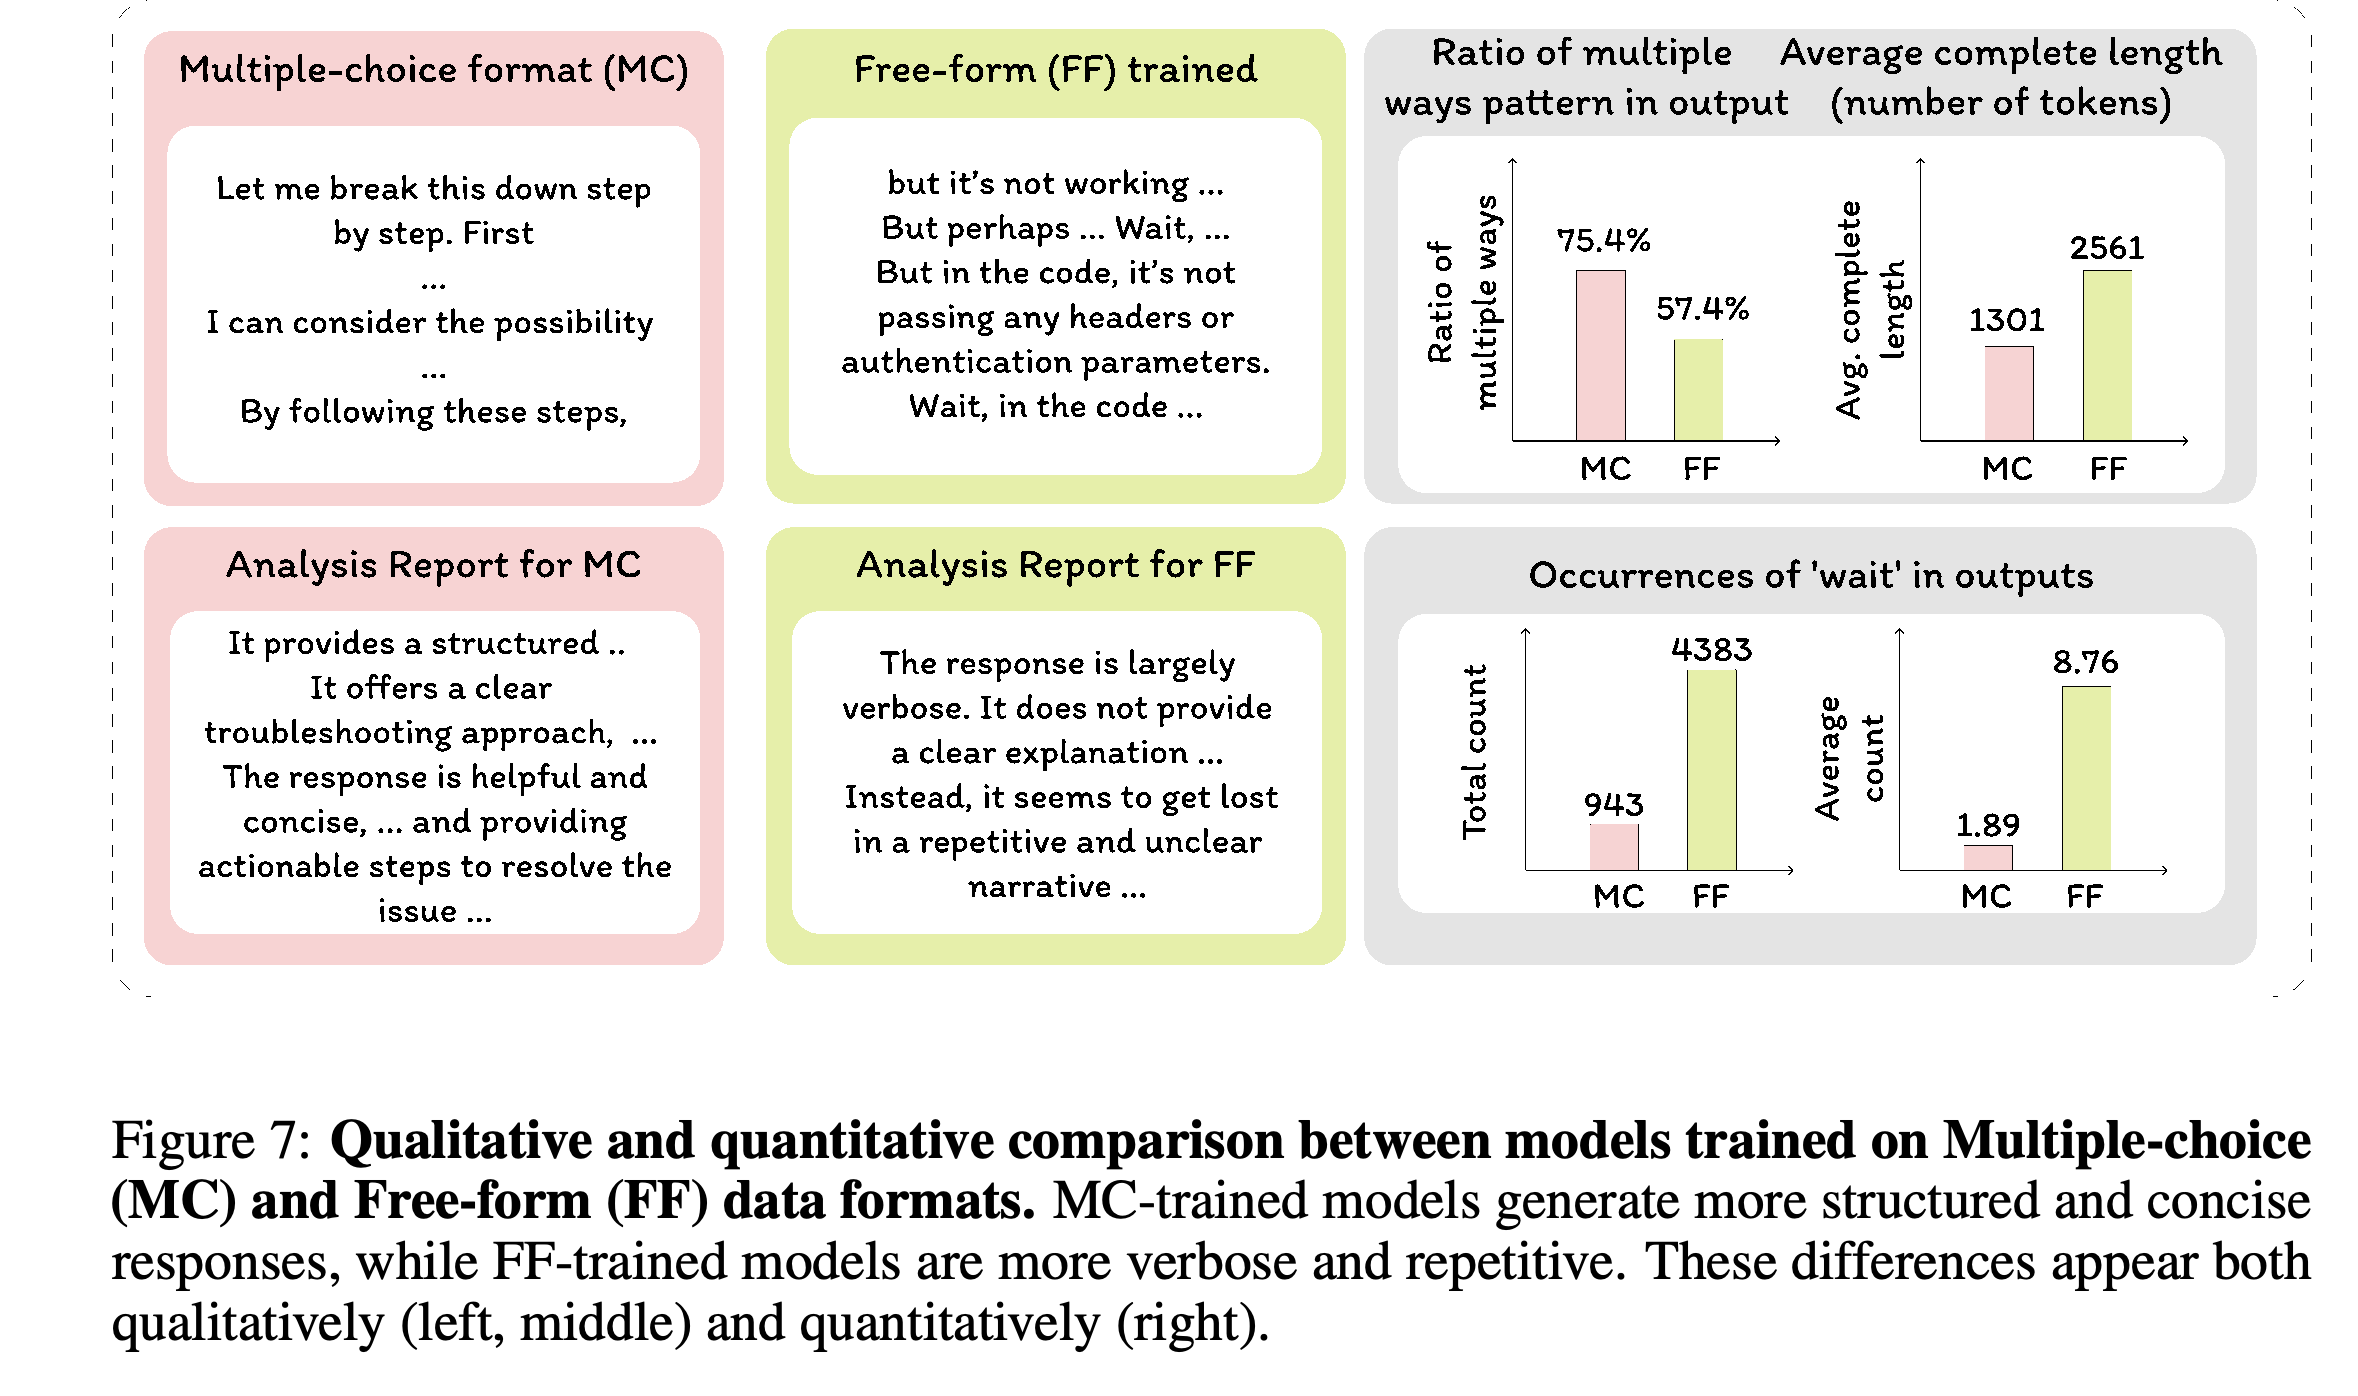
On Arena-Hard, the MC-trained model produces shorter responses and more often explores multiple approaches, while the FF-trained model more often repeats verification within a single line of reasoning. The paper compares these behaviors to breadth-first exploration, considering multiple paths early, and depth-first exploration, pursuing one path with repeated checks.
- Figure 7 reports multiple-approach proportions of 75.4% for MC and 57.4% for FF, average completion lengths of 1301 and 2561 tokens, and average occurrences of ‘wait’ of 1.89 and 8.76.
- These measurements support differences in output structure and repetition. The proposed explanation that answer cues induce these styles is an interpretation of the format comparison, rather than a separately tested mechanism.
- The qualitative reports favor the MC model’s structure, but their style judgments do not establish answer correctness.
The MC model averages 1301 completion tokens and 1.89 occurrences of 'wait', compared with 2561 tokens and 8.76 occurrences for FF. Multiple-approach proportions of 75.4% and 57.4% provide another measured output difference; the accompanying reports add qualitative judgments.
5.3 Interpolating desired reasoning strategies through model merging
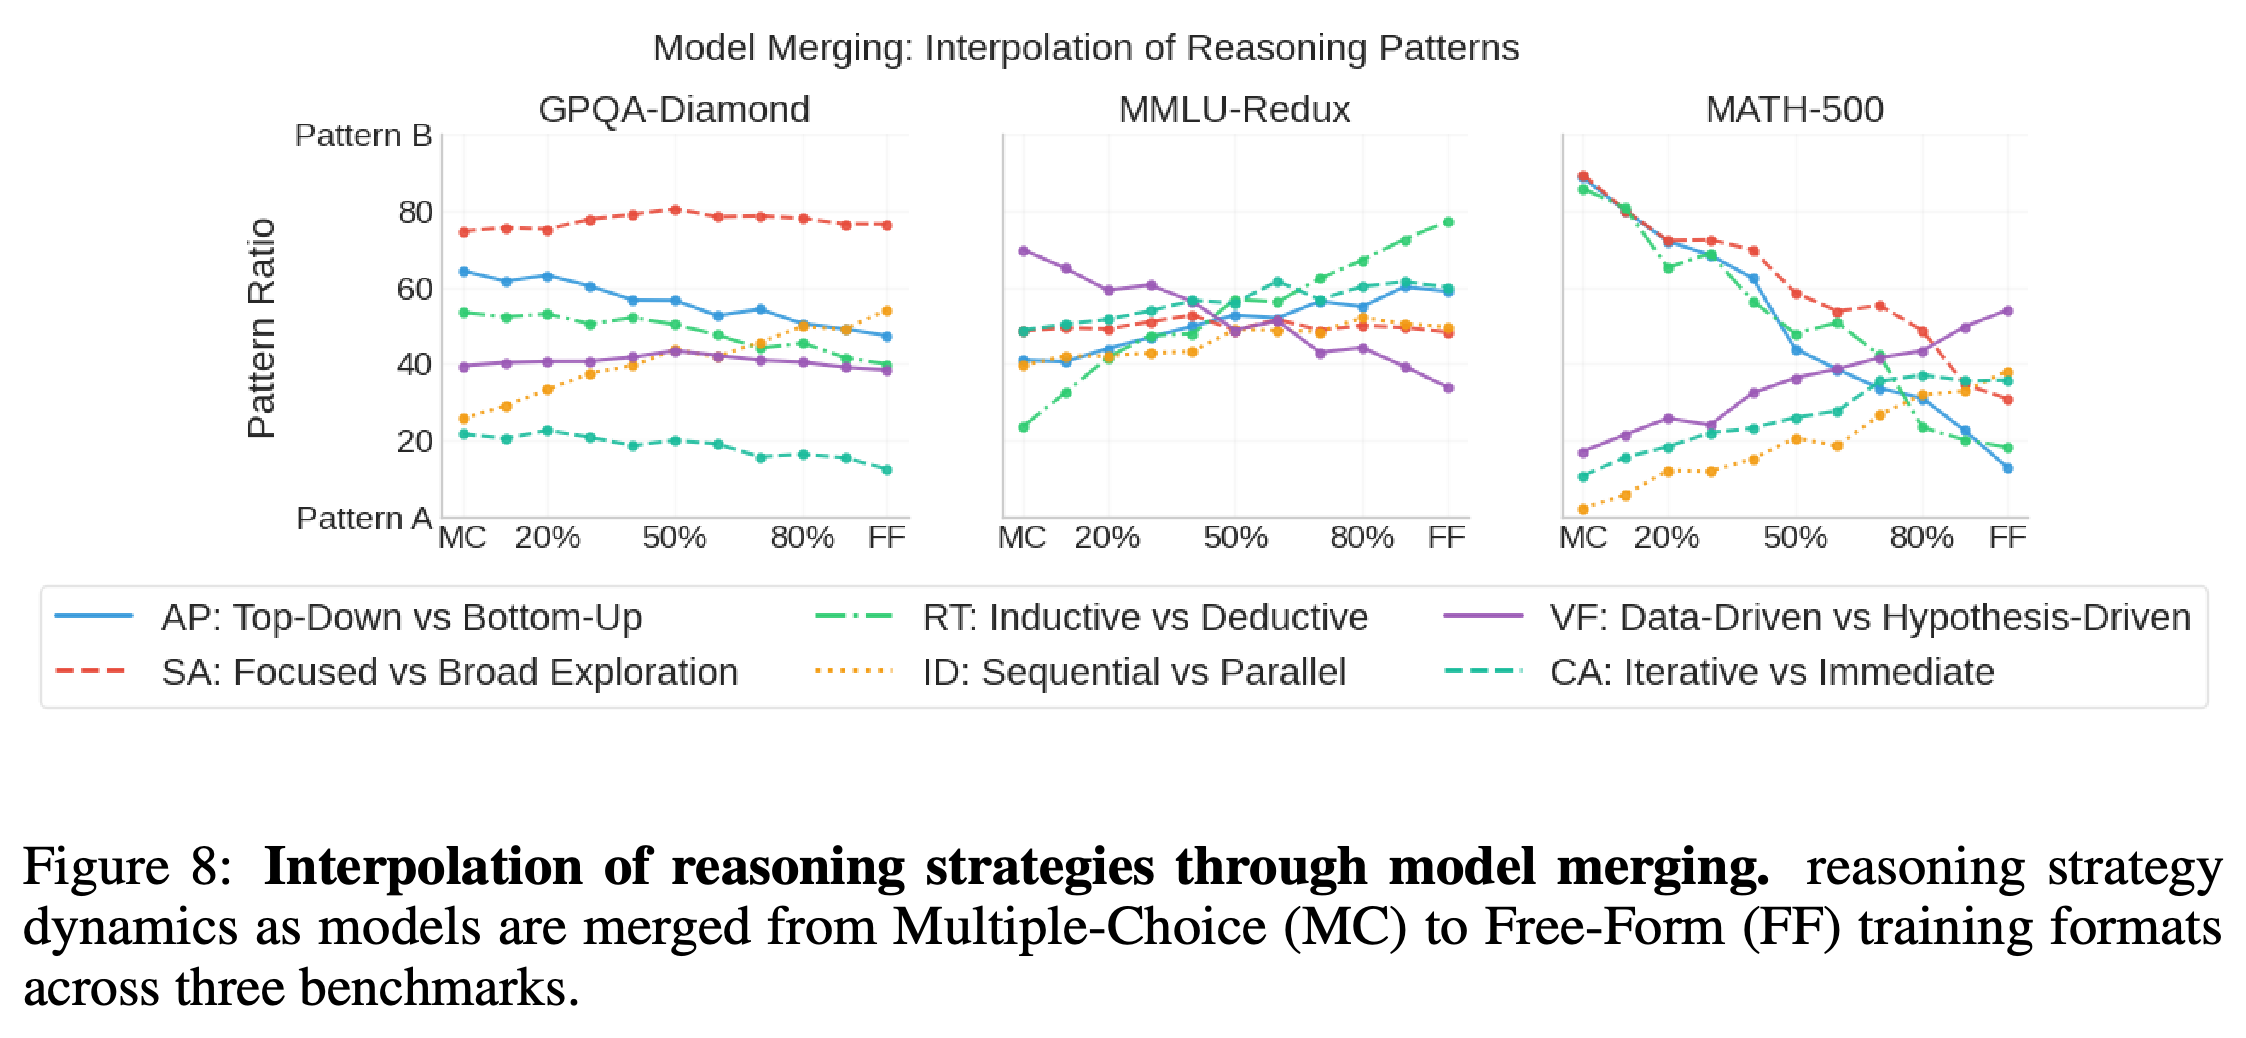
Linear model merging changes strategy proportions as the mixture moves from the MC model toward the FF model. GPQA-Diamond changes are relatively moderate, MMLU-Redux exhibits several crossovers around the 50% merging ratio, and MATH-500 shows the largest transitions.
- For MATH-500, the paper describes the Bottom-Up Analytical Perspective proportion decreasing from nearly 85% to approximately 15% across the interpolation. This criterion contrasts beginning from details with beginning from an overall structure.
- Figure 8 demonstrates changes in measured strategy distributions without additional training. It does not report improved accuracy or safety for intermediate mixtures, and several trajectories are non-monotonic.
Changing the weight mixture shifts several strategy proportions, with the largest transitions on MATH-500 and more complex trajectories on MMLU-Redux. The figure measures behavioral profiles and reports no accuracy or safety improvement for merged models.
6 Conclusion
The paper concludes that a taxonomy derived from generated responses can support strategy analysis, selective correction through instructions, and investigation of training-data effects. Its experiments also show that model weight interpolation can vary measured strategy profiles; broader deployment benefits remain untested under these benchmark conditions.
Appendix
- A Implementation details, A.1 CoT Encyclopedia details: GPT-4o extracts criteria and generates rubrics, while text-embedding-3-large embeds them. Criteria are derived from test-set responses on GPQA-Diamond, MMLU-Redux, and MATH-500; silhouette-based cluster selection produces six clusters represented by medoids.
- A.2 Statistical test details, A.3 Human evaluation details: Distribution comparisons use chi-squared tests with a 0.05 significance threshold and Cohen’s d for effect magnitude. Four evaluators use Argilla, an annotation platform, to answer four binary questions about criteria and reports; the study assigns 25 responses to each evaluator and reports no agreement measure on shared examples.
- A.4 Benchmark evaluation details: Generation uses vLLM, an inference library, with temperature 0.6, top p 0.95, and a maximum of 32768 tokens. Temperature and top p control sampling variability and the candidate-token probability mass. Answers are parsed from generated reasoning and checked with Math-Verify, an answer-verification library; LLaMA-Guard-3 8B labels responses safe or unsafe, and the safe proportion is reported.
- A.5 Training details: Training uses GRPO, an algorithm that compares rewards among multiple outputs for the same input, through the Open-R1 training library. The objective combines a clipped policy update with a KL-divergence penalty, a measure of deviation from a reference model; the reward is 1 for a correct answer and 0 otherwise, with no separate formatting reward. Settings include maximum completion length 2048, 3 generations, batch size 72, bfloat16 numerical precision, flash attention 2 as the attention implementation, 1 epoch, and warmup ratio 0.1; the learning rate is printed as 2.0e05, so its intended value is uncertain.
- A.6 Computing resources: Training the 7B model on 100,000 samples uses eight NVIDIA H100 80GB GPUs and 576 GPU hours. Inference over 3,698 samples uses sixteen NVIDIA A100 40GB GPUs and 384 GPU hours; the CPU is an AMD EPYC 7763 64-Core Processor.
- B Further Analyses, B.1 Fine-grained benchmark-specific criteria analysis: Separate clustering for each benchmark yields related problem-solving categories and distinct instruction-following categories, including User Understanding. B.2 Ablation study on representative embedding selection compares medoid, frequency, density, and silhouette-based representatives; most category identities remain similar, with Clarification Approach replaced by Computation Style or Clarity on Steps in two alternatives.
- B.3 Consistency of reasoning strategies across model sizes within the same family: Distill-R1 1.5B, 7B, and 32B show similar strategy distributions on the three problem-solving benchmarks, with most pairwise absolute Cohen’s d values below 0.1. B.4 Extending reasoning strategy analysis to non-reasoning models applies the framework to Qwen-2.5-Instruct-32B and Qwen-2.5-Math-Instruct-32B, finding related criteria and several distribution differences; however, Table 13 labels its models QwQ and s1.1, making its connection to this extension ambiguous.
- C Broader Impact proposes uses in model debugging, training curricula, and interactive explanations, and argues for structural diversity in datasets. These are potential applications; the paper does not evaluate deployments in the education, healthcare, or scientific-discovery settings it mentions.
- D Limitations acknowledges possible GPT-4o evaluator bias, limited task and model coverage, and dependence on models following stylistic instructions. The human evaluation assesses whether analyses appear reasonable, leaving their correspondence to underlying model computation untested.
- E Prompts provides templates for extracting opposing criteria, generating rubrics, producing reports supported by response excerpts, evaluating multiple-choice answers, and prescribing strategies. The report template asks for evidence for both patterns and recognition of mixed signals, but the final representation still selects one pattern per criterion.
- F Qualitative Analyses, F.1 Comparative Analysis of CoT Encyclopedia Outputs and Pre-defined Criteria compares the framework’s descriptive reports with backtracking labels. Table 14 analyzes a moving-medium physics response, while Table 15 pairs a synthesis question about limonene with a response discussing an unrelated spectroscopy problem; this mismatch limits the latter example’s evidential value.
- F.2 Divergent reasoning strategies from Multiple-Choice vs. Free-Form Training Data compares Arena-Hard responses on toy-allocation fairness and an sshd error, a message from a secure remote-login server. The reports praise the MC model’s structure, but its troubleshooting response introduces blockchain claims absent from the question, while the FF response invents code and authentication details. These examples illustrate stylistic differences more directly than correctness or reliable diagnosis.
Brief Thoughts
The strongest practical evidence connects automatically derived descriptions of response behavior to instructions that improve selective correction. Random-instruction and no-instruction comparisons help assess the intervention, but deployment evaluation should apply strategy selection to all incoming questions and measure whether instructions damage answers that would otherwise be correct.
The training-format experiment gives a concrete reason to inspect data presentation alongside subject matter when diagnosing reasoning style. Its quantitative interpretation needs reconciliation of Figure 6 with Table 11, and the qualitative mismatches show why readable analysis reports need independent checks for relevance and factual accuracy.