


The Leaderboard Illusion | Summary
29 Apr 2025 | Paper Review LLM Evaluation Evaluation Metrics Selection BiasContents
- Summary
- 1 Introduction
- 2 Overview of Methodology
- 3 Results: Impact of Private Testing and Selective Retraction on Arena Scores
- 4 Results: Impact of Data Access Asymmetries on Arena Scores
- 5 Results: Impact of Model Deprecation on Arena Scores
- 6 Recommendations and Guidelines for Improving Leaderboards
- 7 Limitations
- 8 Related Work
- 9 Conclusion
- Appendix
- Brief Thoughts
This article explains the key points of The Leaderboard Illusion.
- 2025-04-29 (arXiv)
- Singh, Shivalika, Nan, Yiyang, Wang, Alex, D’Souza, Daniel, Kapoor, Sayash, Üstün, Ahmet, Koyejo, Sanmi, Deng, Yuntian, Longpre, Shayne, Smith, Noah A., et al.
- Cohere Labs, Cohere, Princeton University, Stanford University, University of Waterloo, Massachusetts Institute of Technology, Allen Institute for Artificial Intelligence, University of Washington
- Paper
Summary
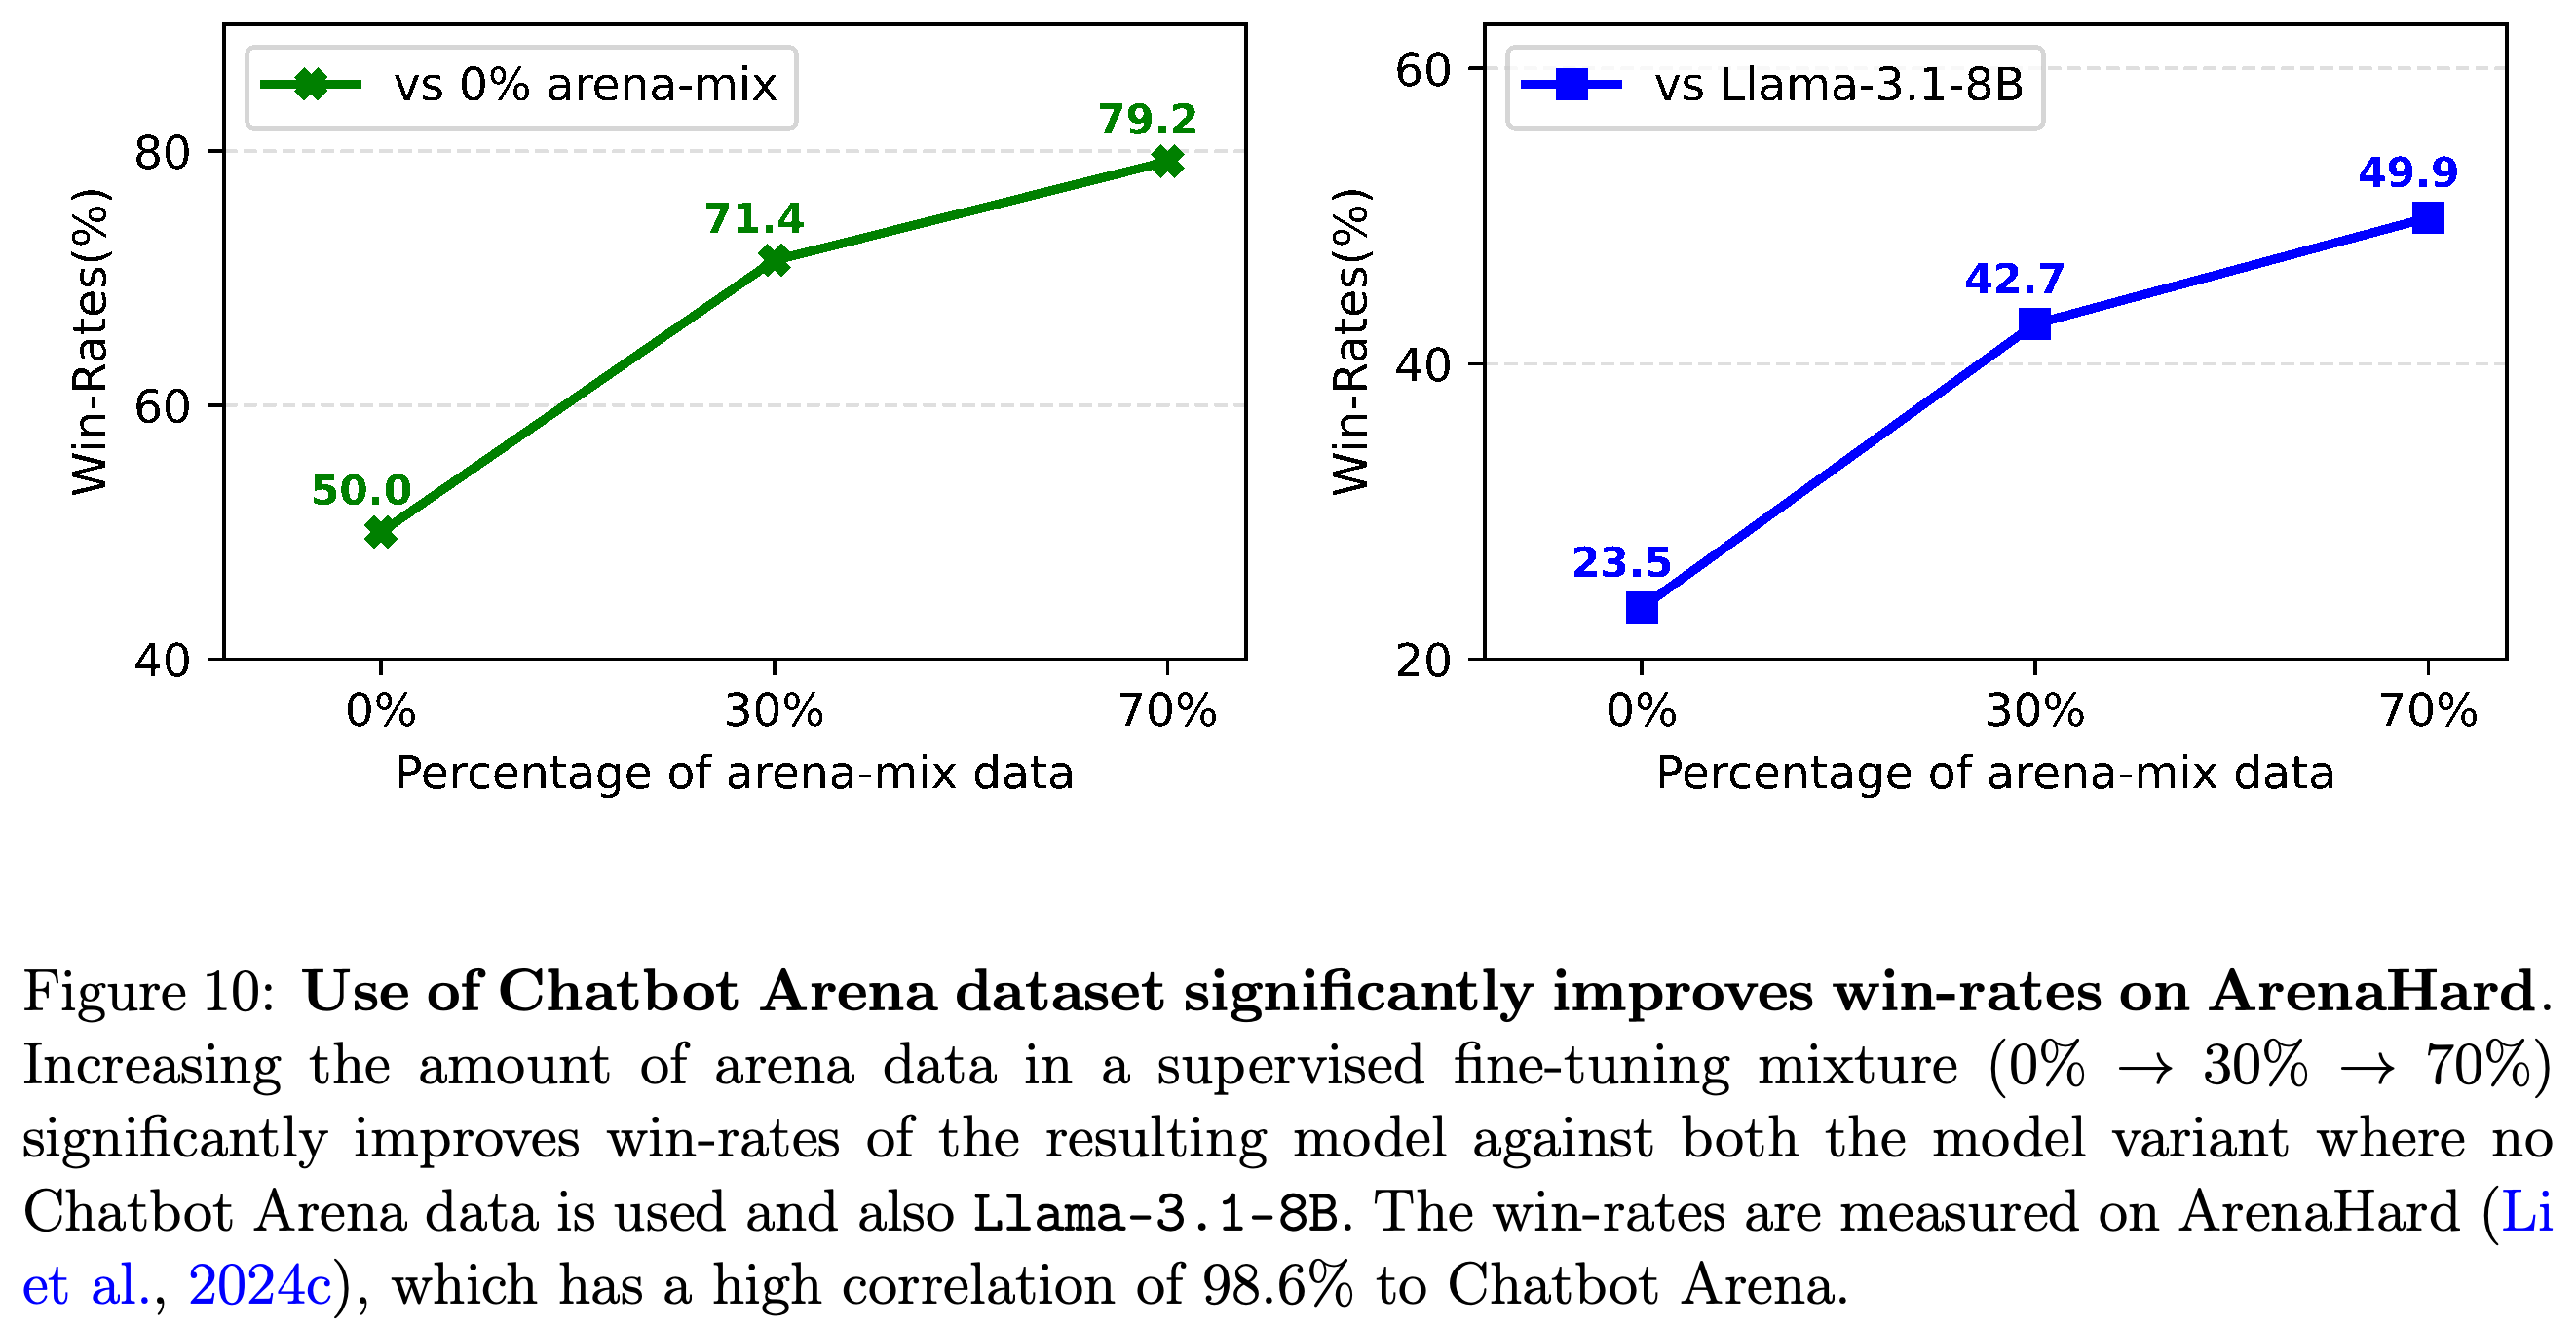
- The Leaderboard Illusion examines whether Chatbot Arena, a platform where users choose between anonymous model responses, reliably measures model quality when providers have unequal testing opportunities and access to evaluation data. With the training budget fixed, increasing the share of Arena training data from 0% to 70% raised win rates against Llama-3.1-8B-Instruct from 23.5% to 49.9% on ArenaHard, a test of 500 English prompts drawn from Arena and scored by an automated model judge, while accuracy on a separate knowledge benchmark did not improve.
- The audit combines approximately 2M battles, or pairwise model comparisons, covering 243 models from 42 providers with simulations and live submission experiments. It identifies unequal private testing opportunities, meaning evaluation before public model identification, selective publication of scores, differences in model exposure, and widespread inactivity that can affect rankings and access to user prompts.
- During January–March 2025, the authors attributed 27 private variants on the main leaderboard to Meta, 10 to Google, and 7 to Amazon. Their live experiment produced scores of 1052 and 1069 for two identical Aya-Vision-8B checkpoints, or saved model weights, illustrating how publishing only the higher observed score can create an advantage without changing the model.
- The experiments establish mechanisms through which leaderboard outcomes can change, but do not quantify their contribution to individual providers’ published scores. Provider attribution relies on model self-identification, private testing observations cover a limited period, and the authors lack complete raw Arena records and other providers’ private scores.
1 Introduction
Chatbot Arena addresses an evaluation gap: human judgments of open-ended responses can capture behavior that fixed multiple-choice tests miss. The paper argues that concentrated attention on one leaderboard also encourages optimization toward its particular users, prompts, and reporting rules.
- The introduction connects four mechanisms: private candidate selection, unequal access to prompts, adaptation to the Arena distribution, and model deprecation, meaning retirement or near-elimination from further comparisons.
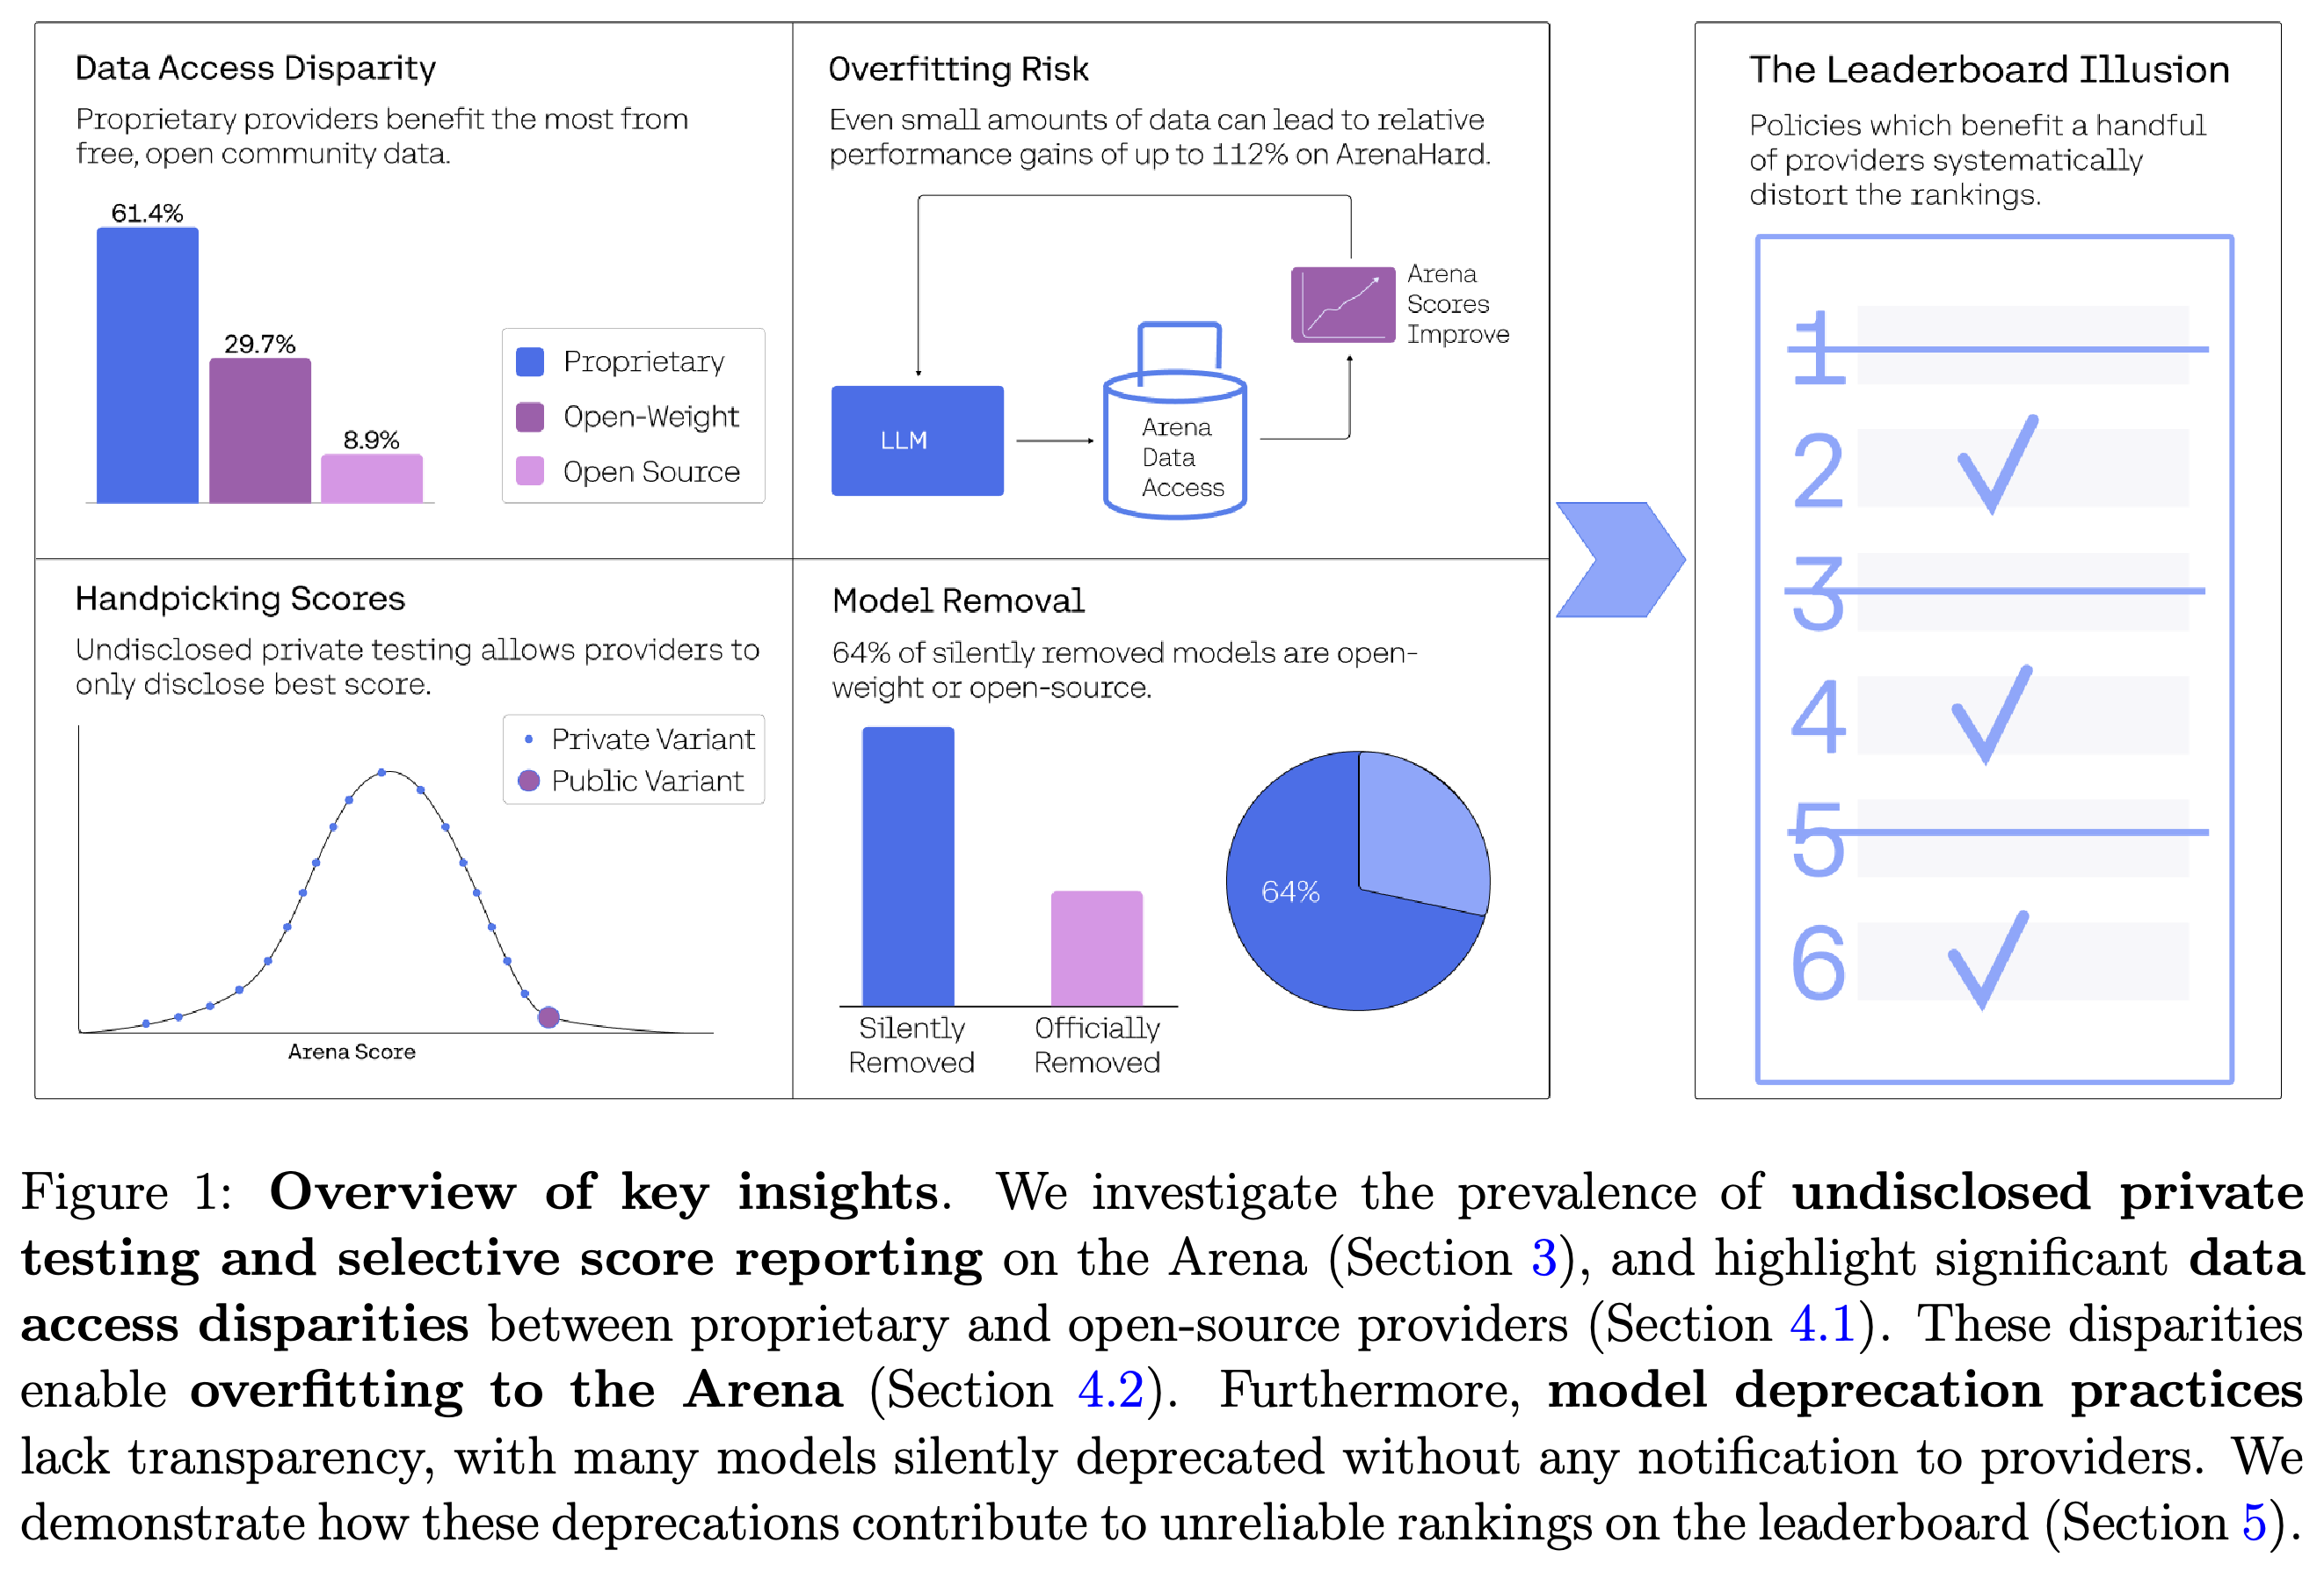
- Estimated data shares are 61.4% for proprietary models, whose weights are not publicly released, 29.7% for open-weight models, whose released weights carry the licenses grouped in Appendix F, and 8.9% for models categorized as open source under that appendix’s license mapping.
- Several authors participate in Arena through Cohere model submissions. They disclose that concerns about sampling motivated the study and that their subsequent private submissions were research experiments.
The diagram connects selective score publication, unequal data exposure, and retirement practices as mechanisms affecting rankings. Its quantitative panels summarize findings developed later; they do not estimate each mechanism’s causal contribution.
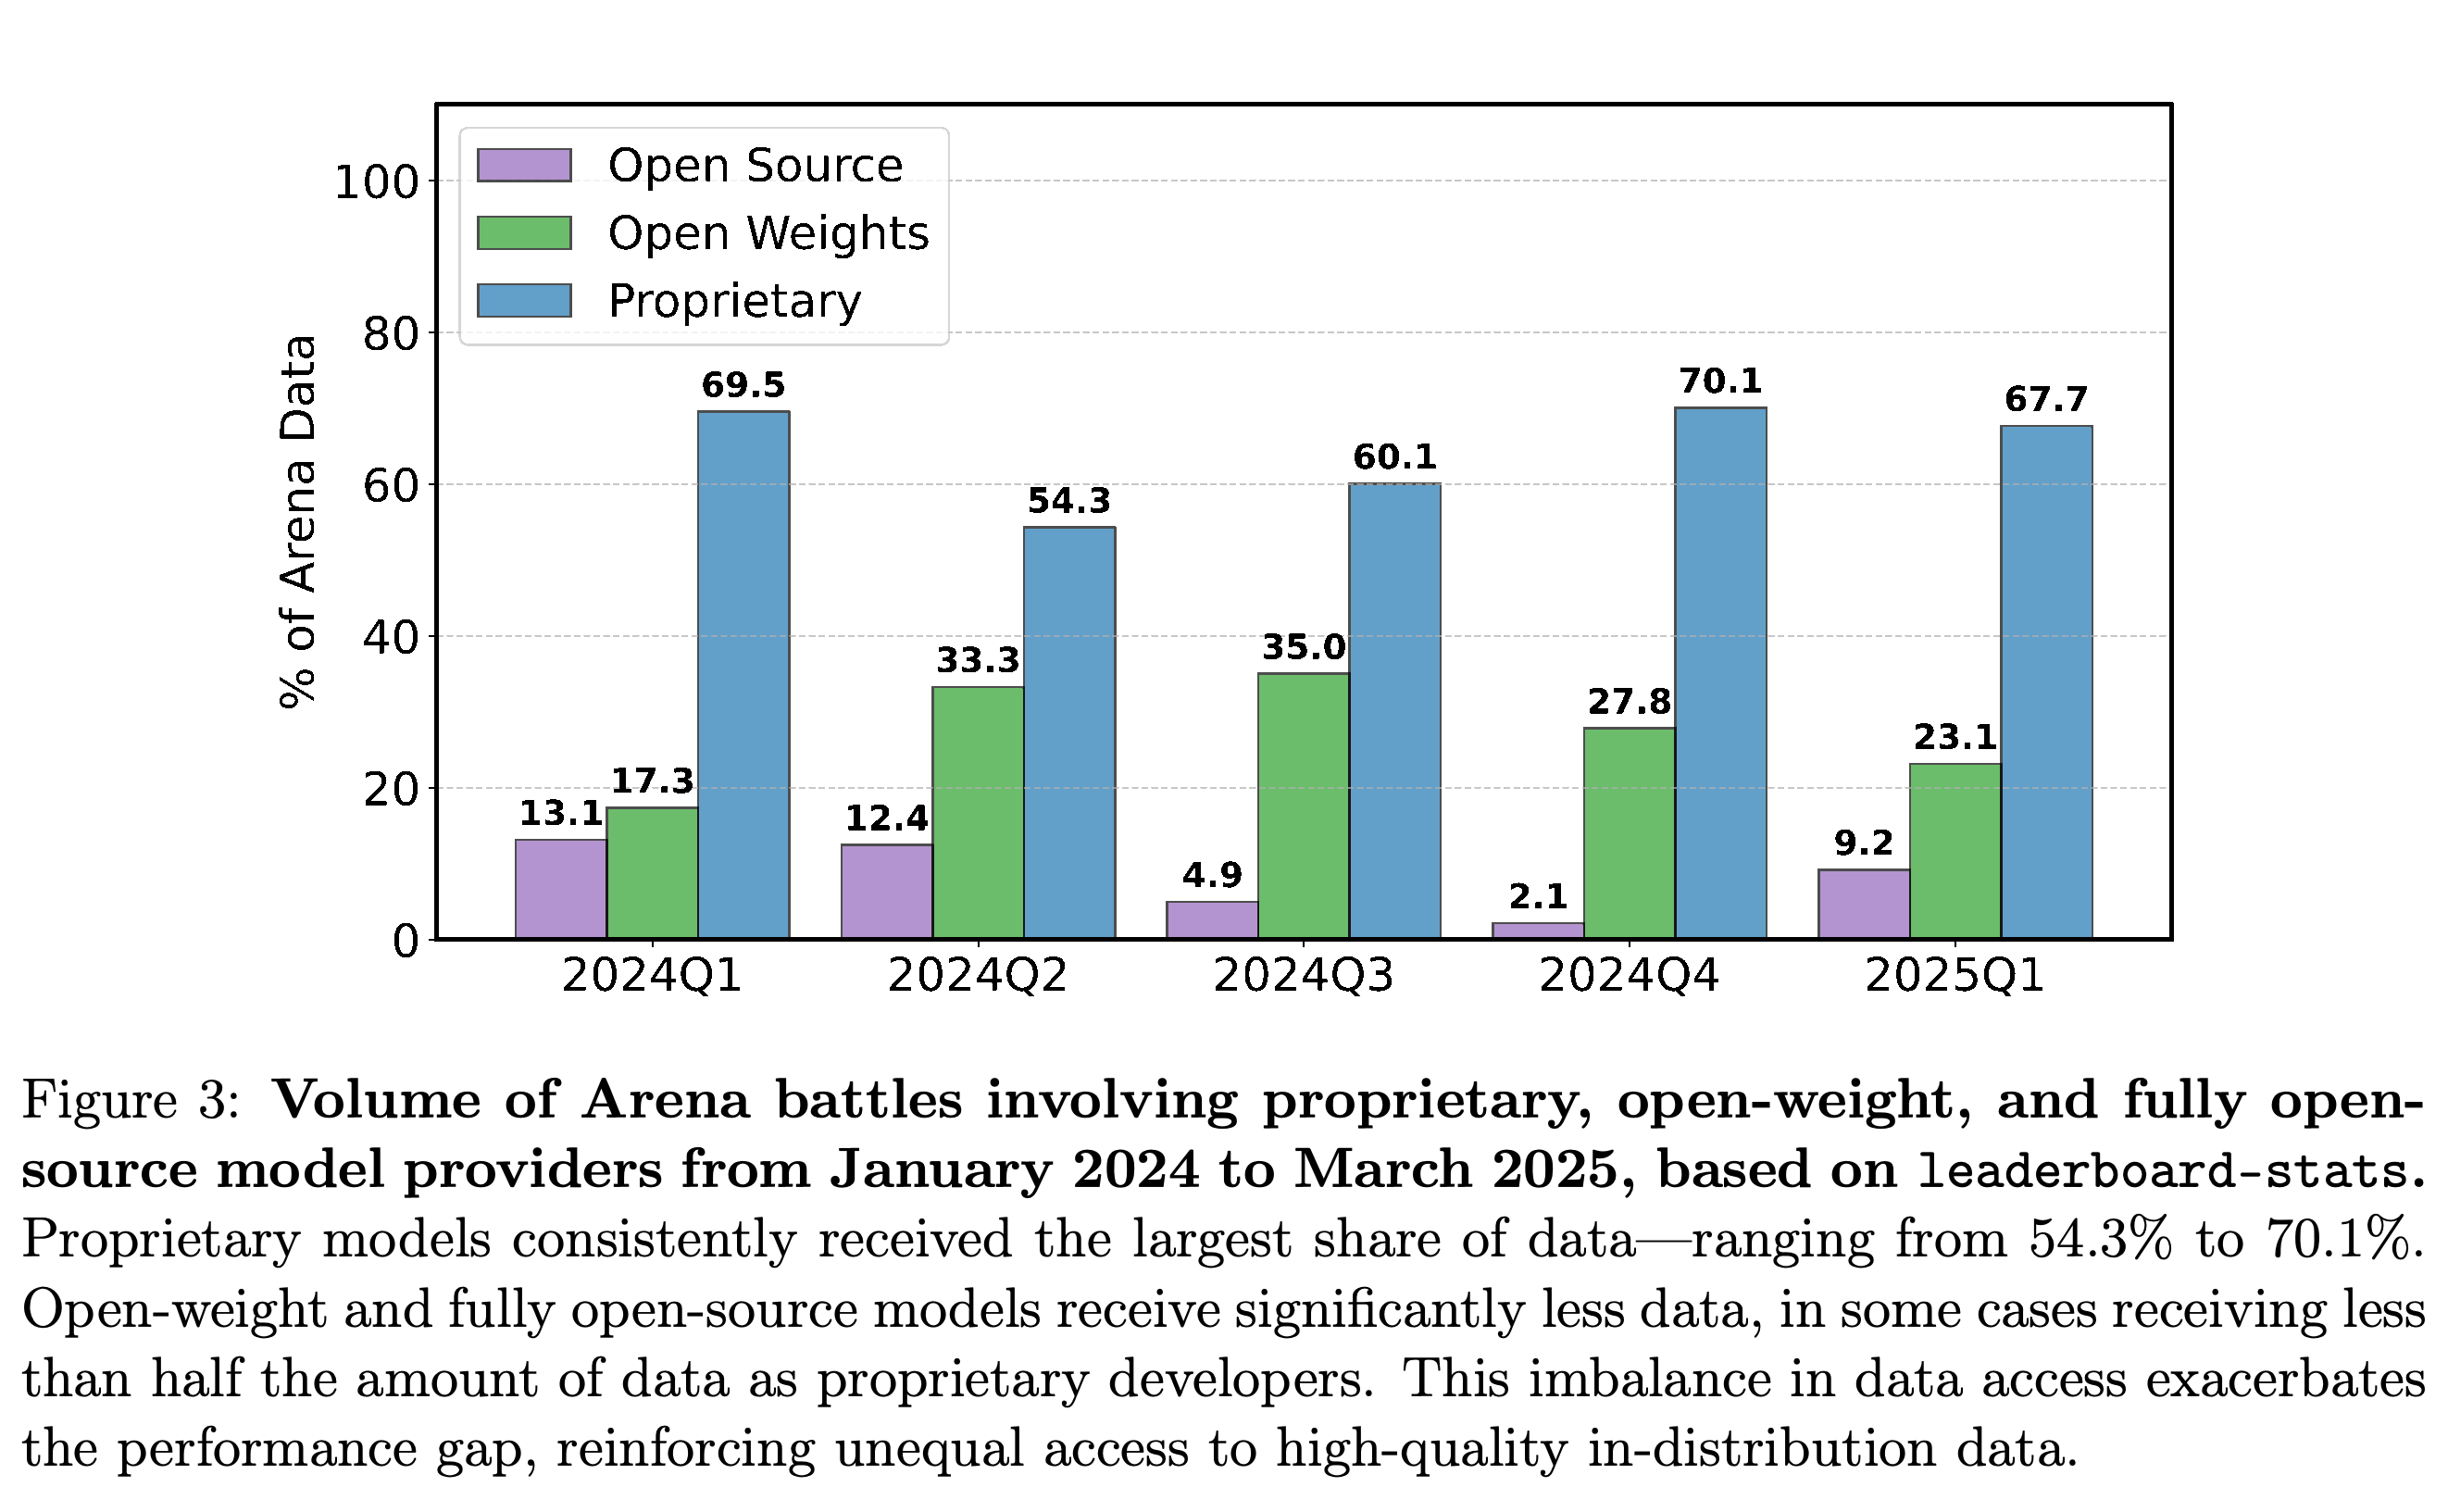
Proprietary models account for 54.3%–70.1% of quarterly exposure across the displayed period. This persistent difference supports unequal cumulative access across license groups, although exposure alone does not demonstrate subsequent training use.
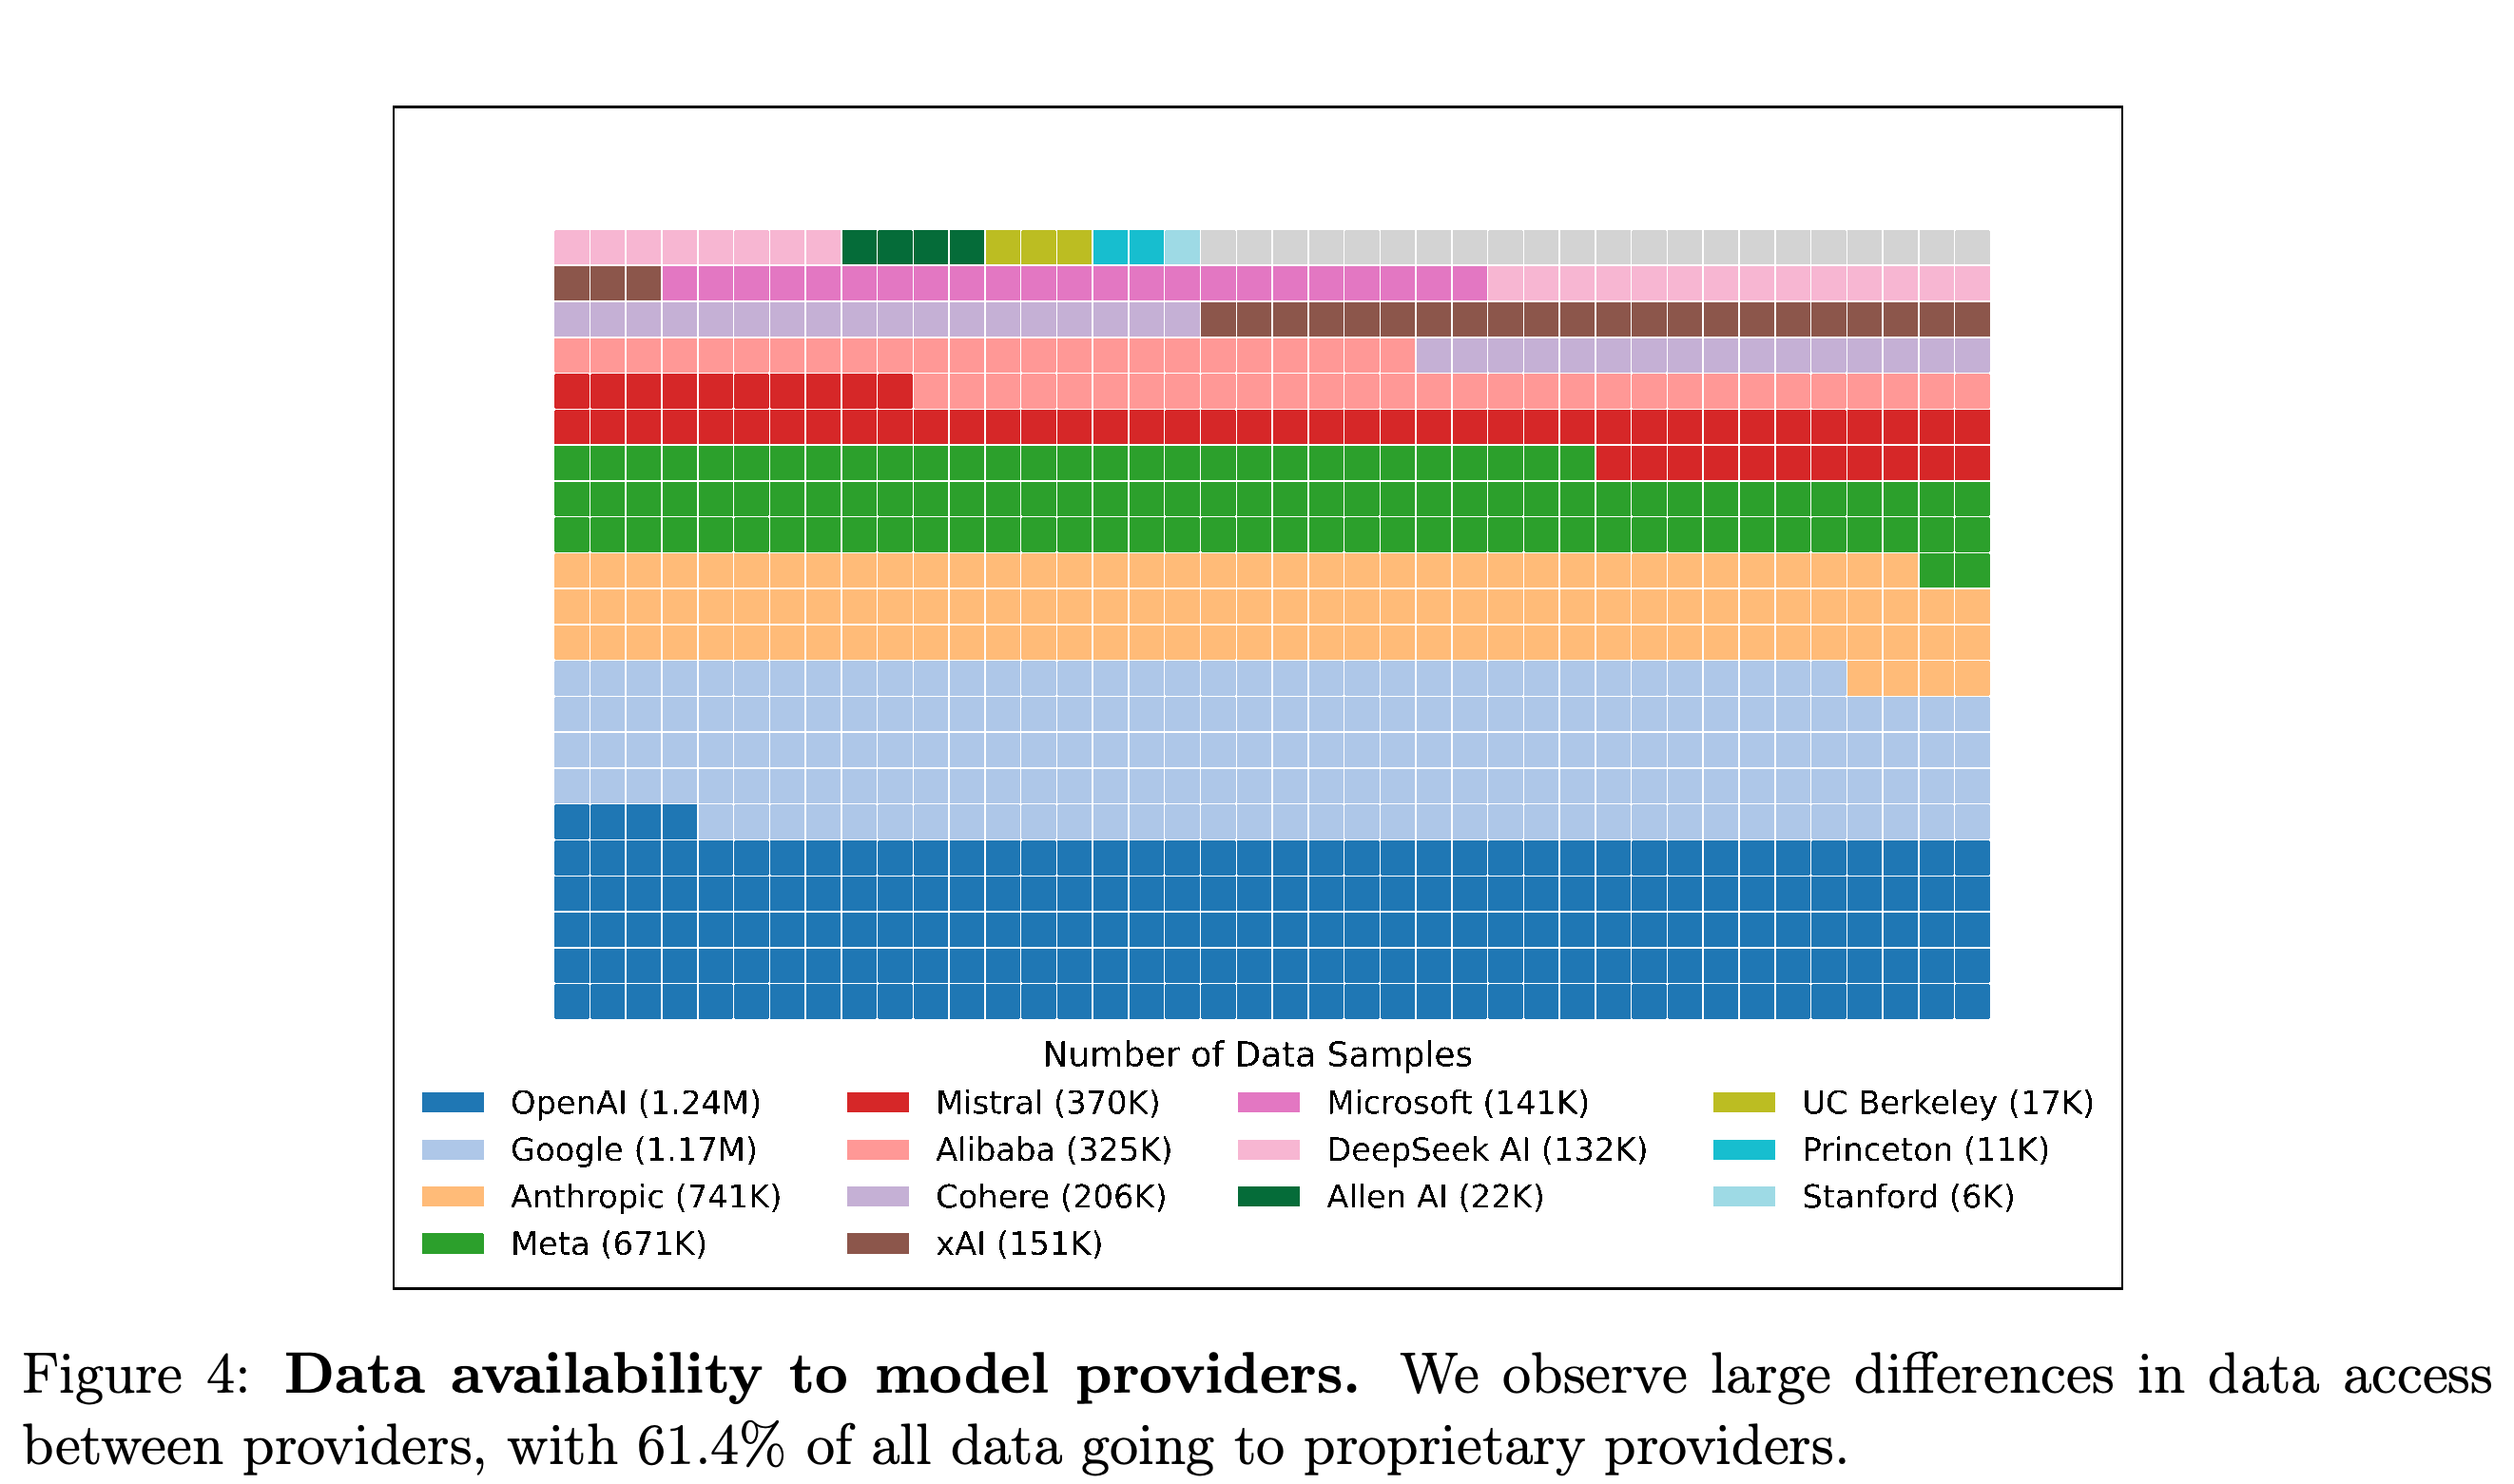
The estimated volumes include 1.24M samples for OpenAI and 1.17M for Google, compared with 22K for Allen AI, 17K for UC Berkeley, 11K for Princeton, and 6K for Stanford. Appendix G explains these as estimated API-call exposure, so they should not be read as mutually exclusive unique prompts.
2 Overview of Methodology
The methodology separates four questions: how private testing and selective disclosure affect scores, how providers acquire unequal amounts of Arena data, whether that data improves Arena-specific performance, and how retirement affects ranking reliability. It combines historical battle records, scraped observations, provider-side application programming interface (API) prompts, and historical leaderboard snapshots.
- The leaderboard analysis covers January 9, 2024–April 23, 2025 and contains 14.3K records for 243 unique models.
- Other sources have different coverage: historical battles extend back to April 2023, scraped main-leaderboard observations cover January–March 2025, and the prompt analysis uses November 2024–April 2025.
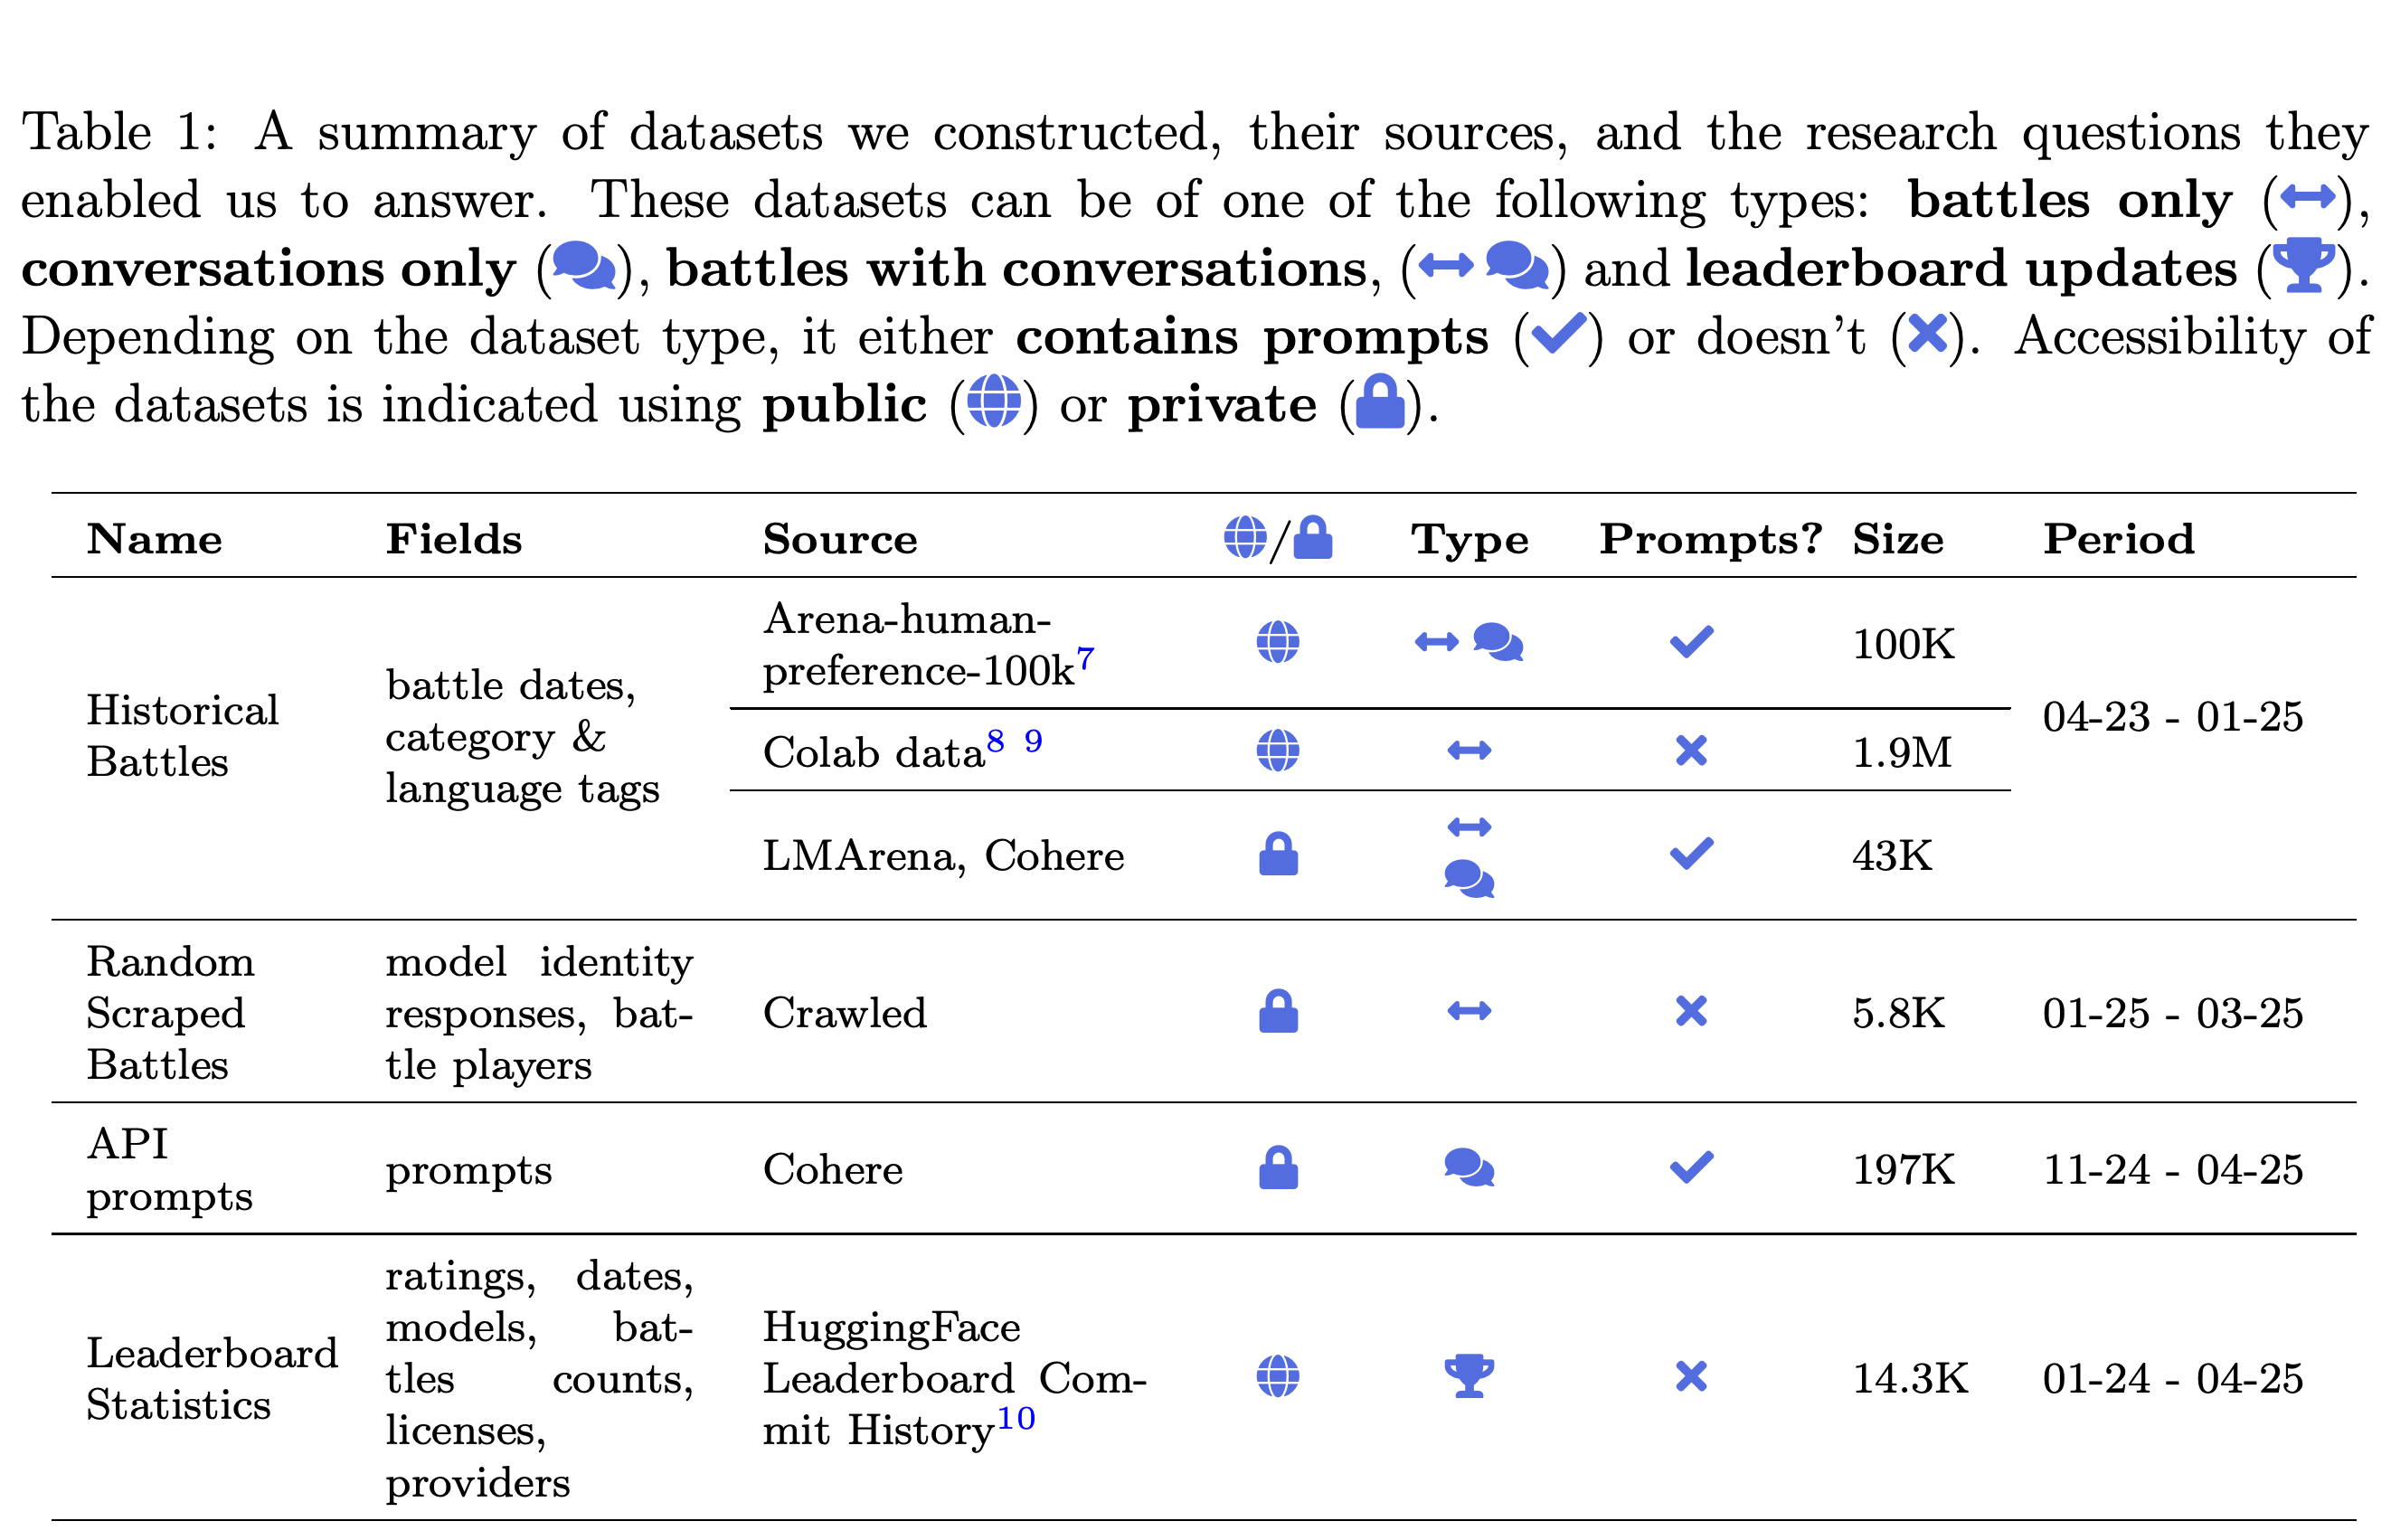
- Table 1 distinguishes records containing prompts and complete conversations from records containing only opponents, outcomes, language tags, or leaderboard statistics.
The table makes the audit’s visibility limits explicit: the largest historical source lacks prompts, whereas prompt-level repetition analysis depends on a smaller provider-side collection. Separate observation periods also explain why private-testing counts and cumulative leaderboard statistics have different scopes.
2.1 Introduction to the Arena Score
Arena Score rescales parameters from the Bradley-Terry (BT) model, a probabilistic model that estimates relative strength from pairwise outcomes. Unlike a simple average win rate, it accounts for opponent strength and supports indirect comparisons when some model pairs have never met.
- The paper emphasizes representative observations, stable evaluation conditions, and sufficient links between models through shared comparisons.
- Transitivity means that a common underlying strength ordering supports indirect comparisons; changing task mixtures can make historical comparisons inconsistent with current performance.
- Appendix B notes that Arena ranking also considers confidence intervals, which express uncertainty around estimated scores. A difference between point estimates alone does not establish a statistically resolved ordering.
3 Results: Impact of Private Testing and Selective Retraction on Arena Scores
Private testing combined with optional score retraction, or withholding a tested result from public reporting, lets a provider evaluate multiple candidates and publish only a preferred result. The paper studies this through observed private aliases, a selection-bias argument, simulated battles, and live submissions.
- Two sources of advantage require separate interpretation: selecting a genuinely stronger candidate and selecting a score that benefited from measurement noise.
- The section’s findings box states approximately 100 points from 10 variants, but the detailed discussion and Figure 7 instead report approximately 50 points from 20 non-identical variants. The latter is supported by the displayed simulation.
3.1 Preferred Providers Frequently Use Private Testing
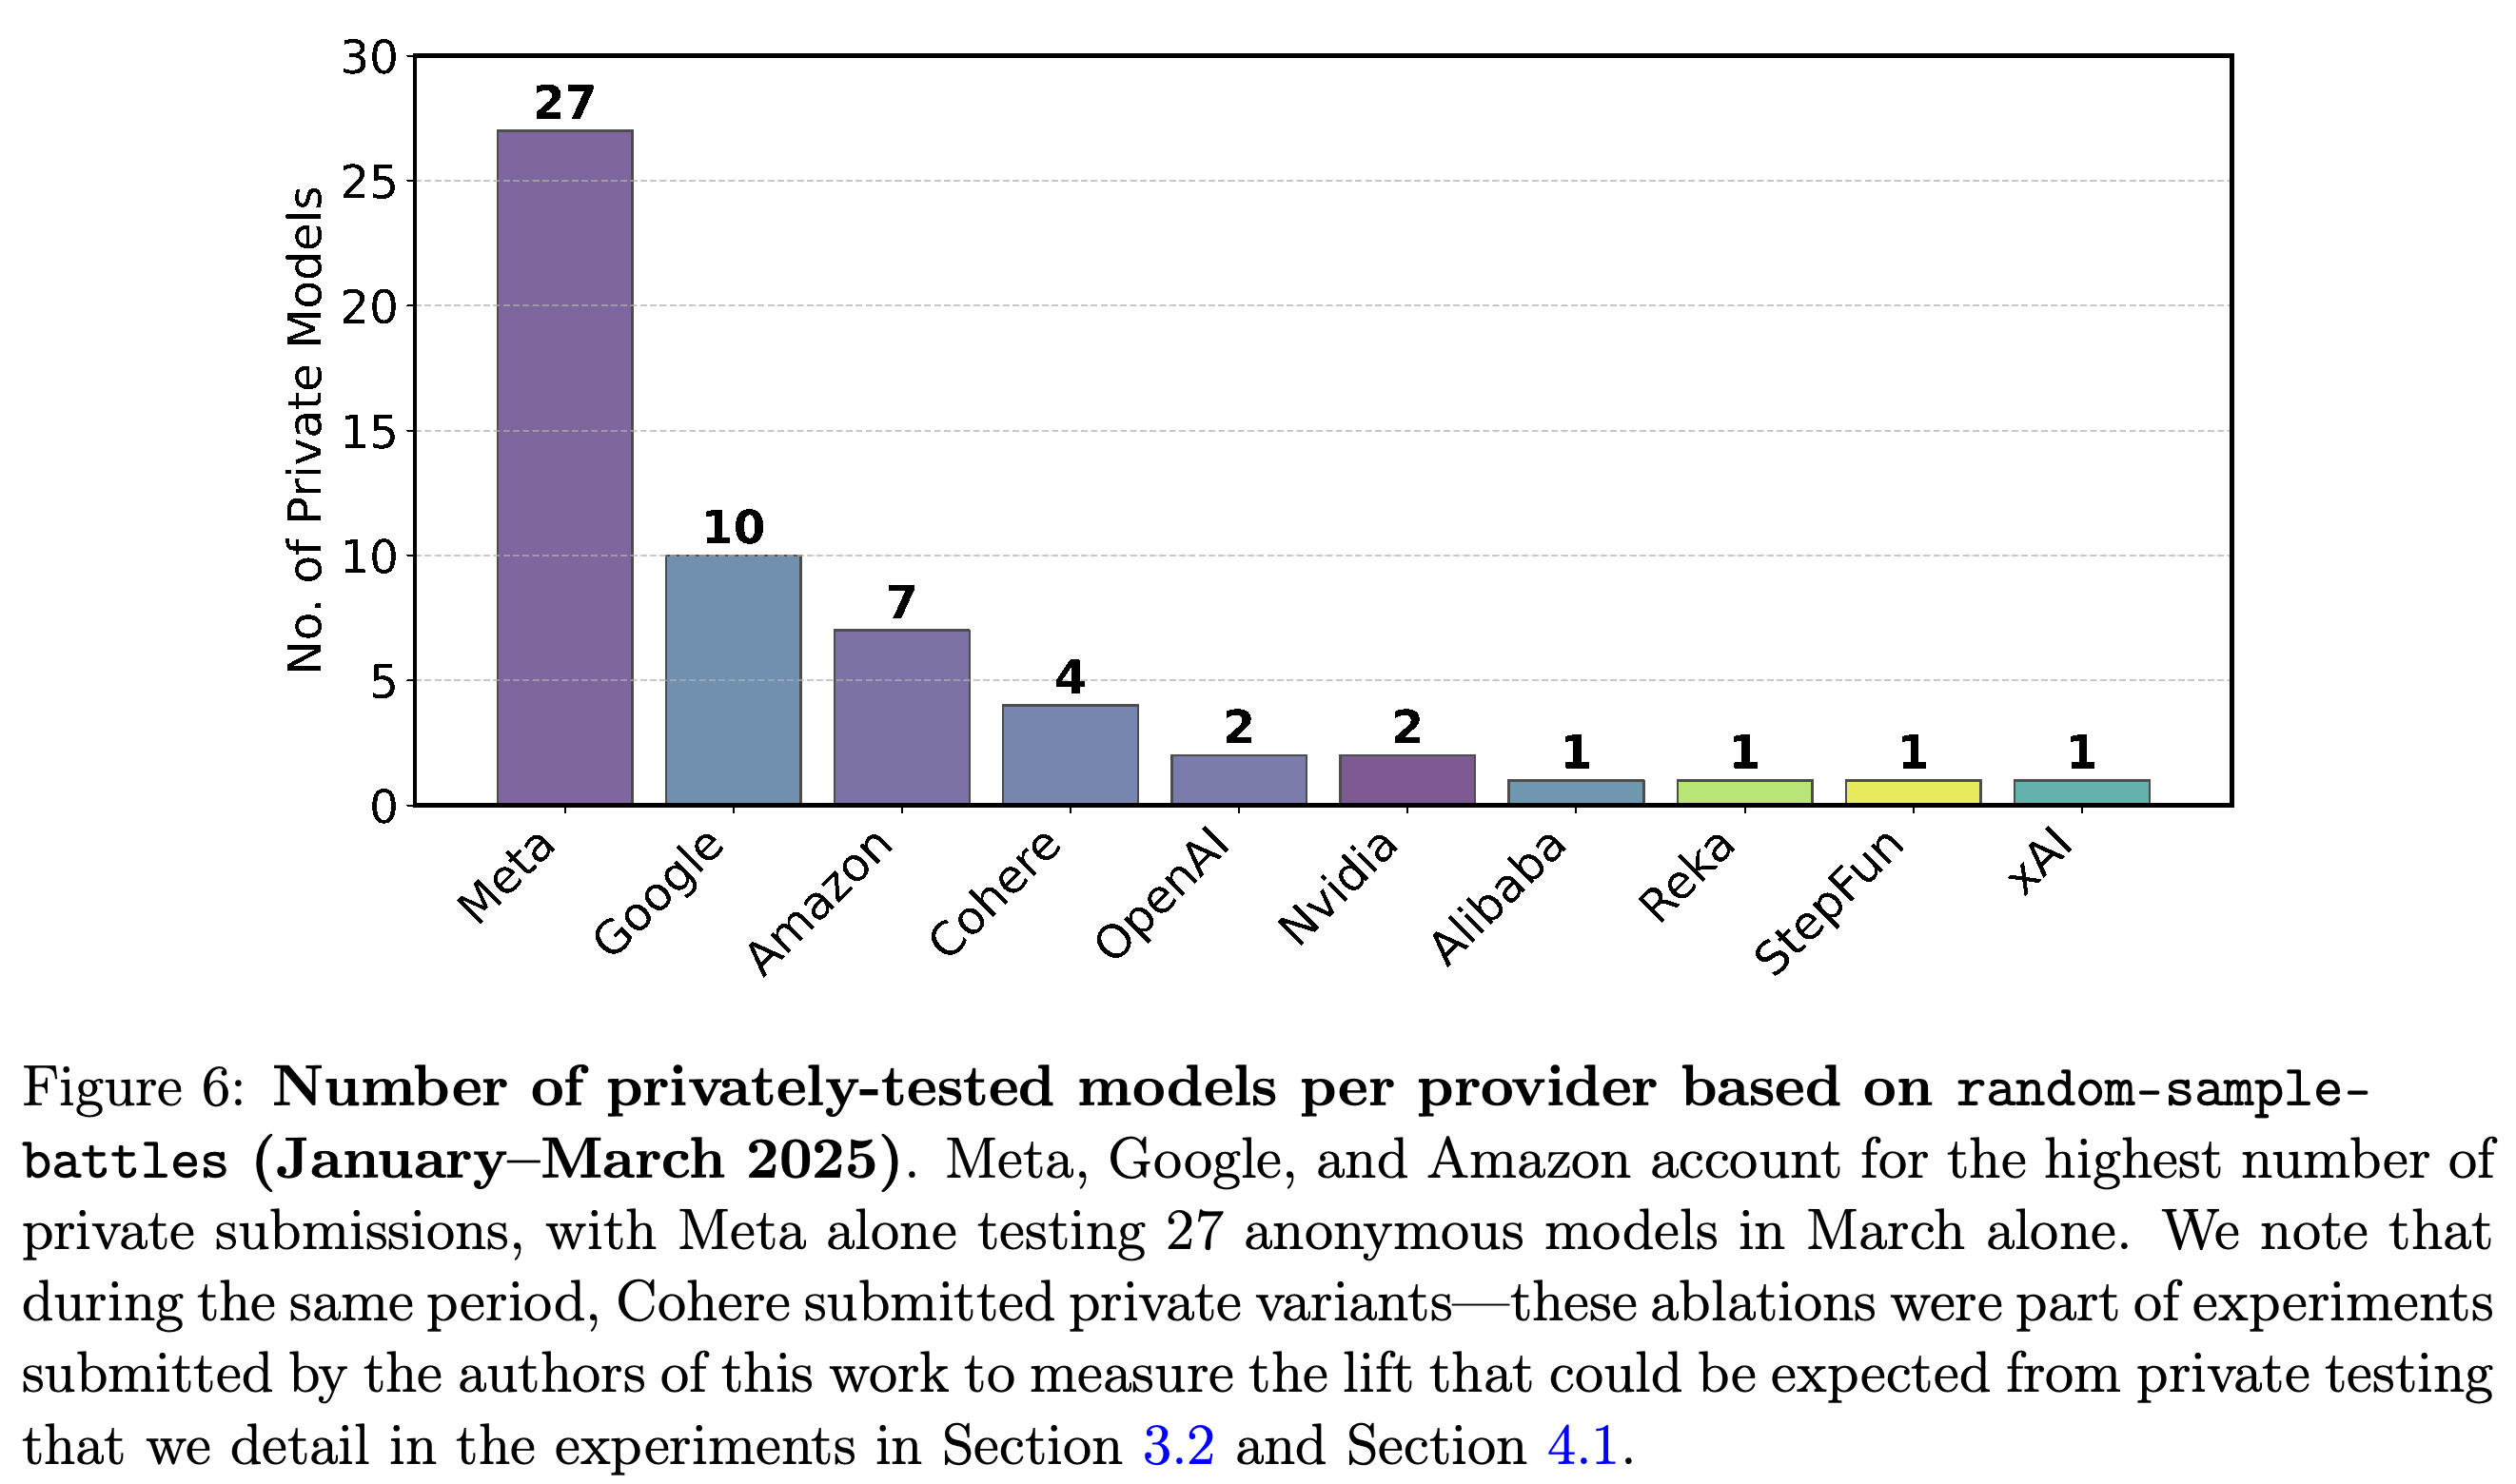
The January–March 2025 crawl found substantial differences in attributed private variant counts: Meta 27, Google 10, Amazon 7, Cohere 4, OpenAI 2, Nvidia 2, and one each for Alibaba, Reka, StepFun, and xAI on the main leaderboard. Including 16 additional vision variants raises Meta’s attributed total to 43.
- The authors found no private models attributed to academic laboratories during this observation window.
- Google’s observed private models were mostly attributed to Gemini, with one attributed to Gemma 3.
- The authors interpret rapid changes in publicly announced leaders as consistent with parallel candidate testing. Announcement timing alone does not establish the cause of those changes.
The observed main-leaderboard private variant counts are concentrated among Meta, Google, and Amazon. Cohere’s four submissions are identified as research experiments, and provider assignments depend on model responses rather than official confirmation.
3.2 Simulated Experiments on Private Testing and Retraction
The best-of-N strategy, meaning publication of the highest-scoring result among N tested candidates, raises the expected selected score relative to a typical submission. Appendix C proves this maximum-selection result for independent, identically distributed estimates with finite expectation, nonzero variance, and N ≥ 2.
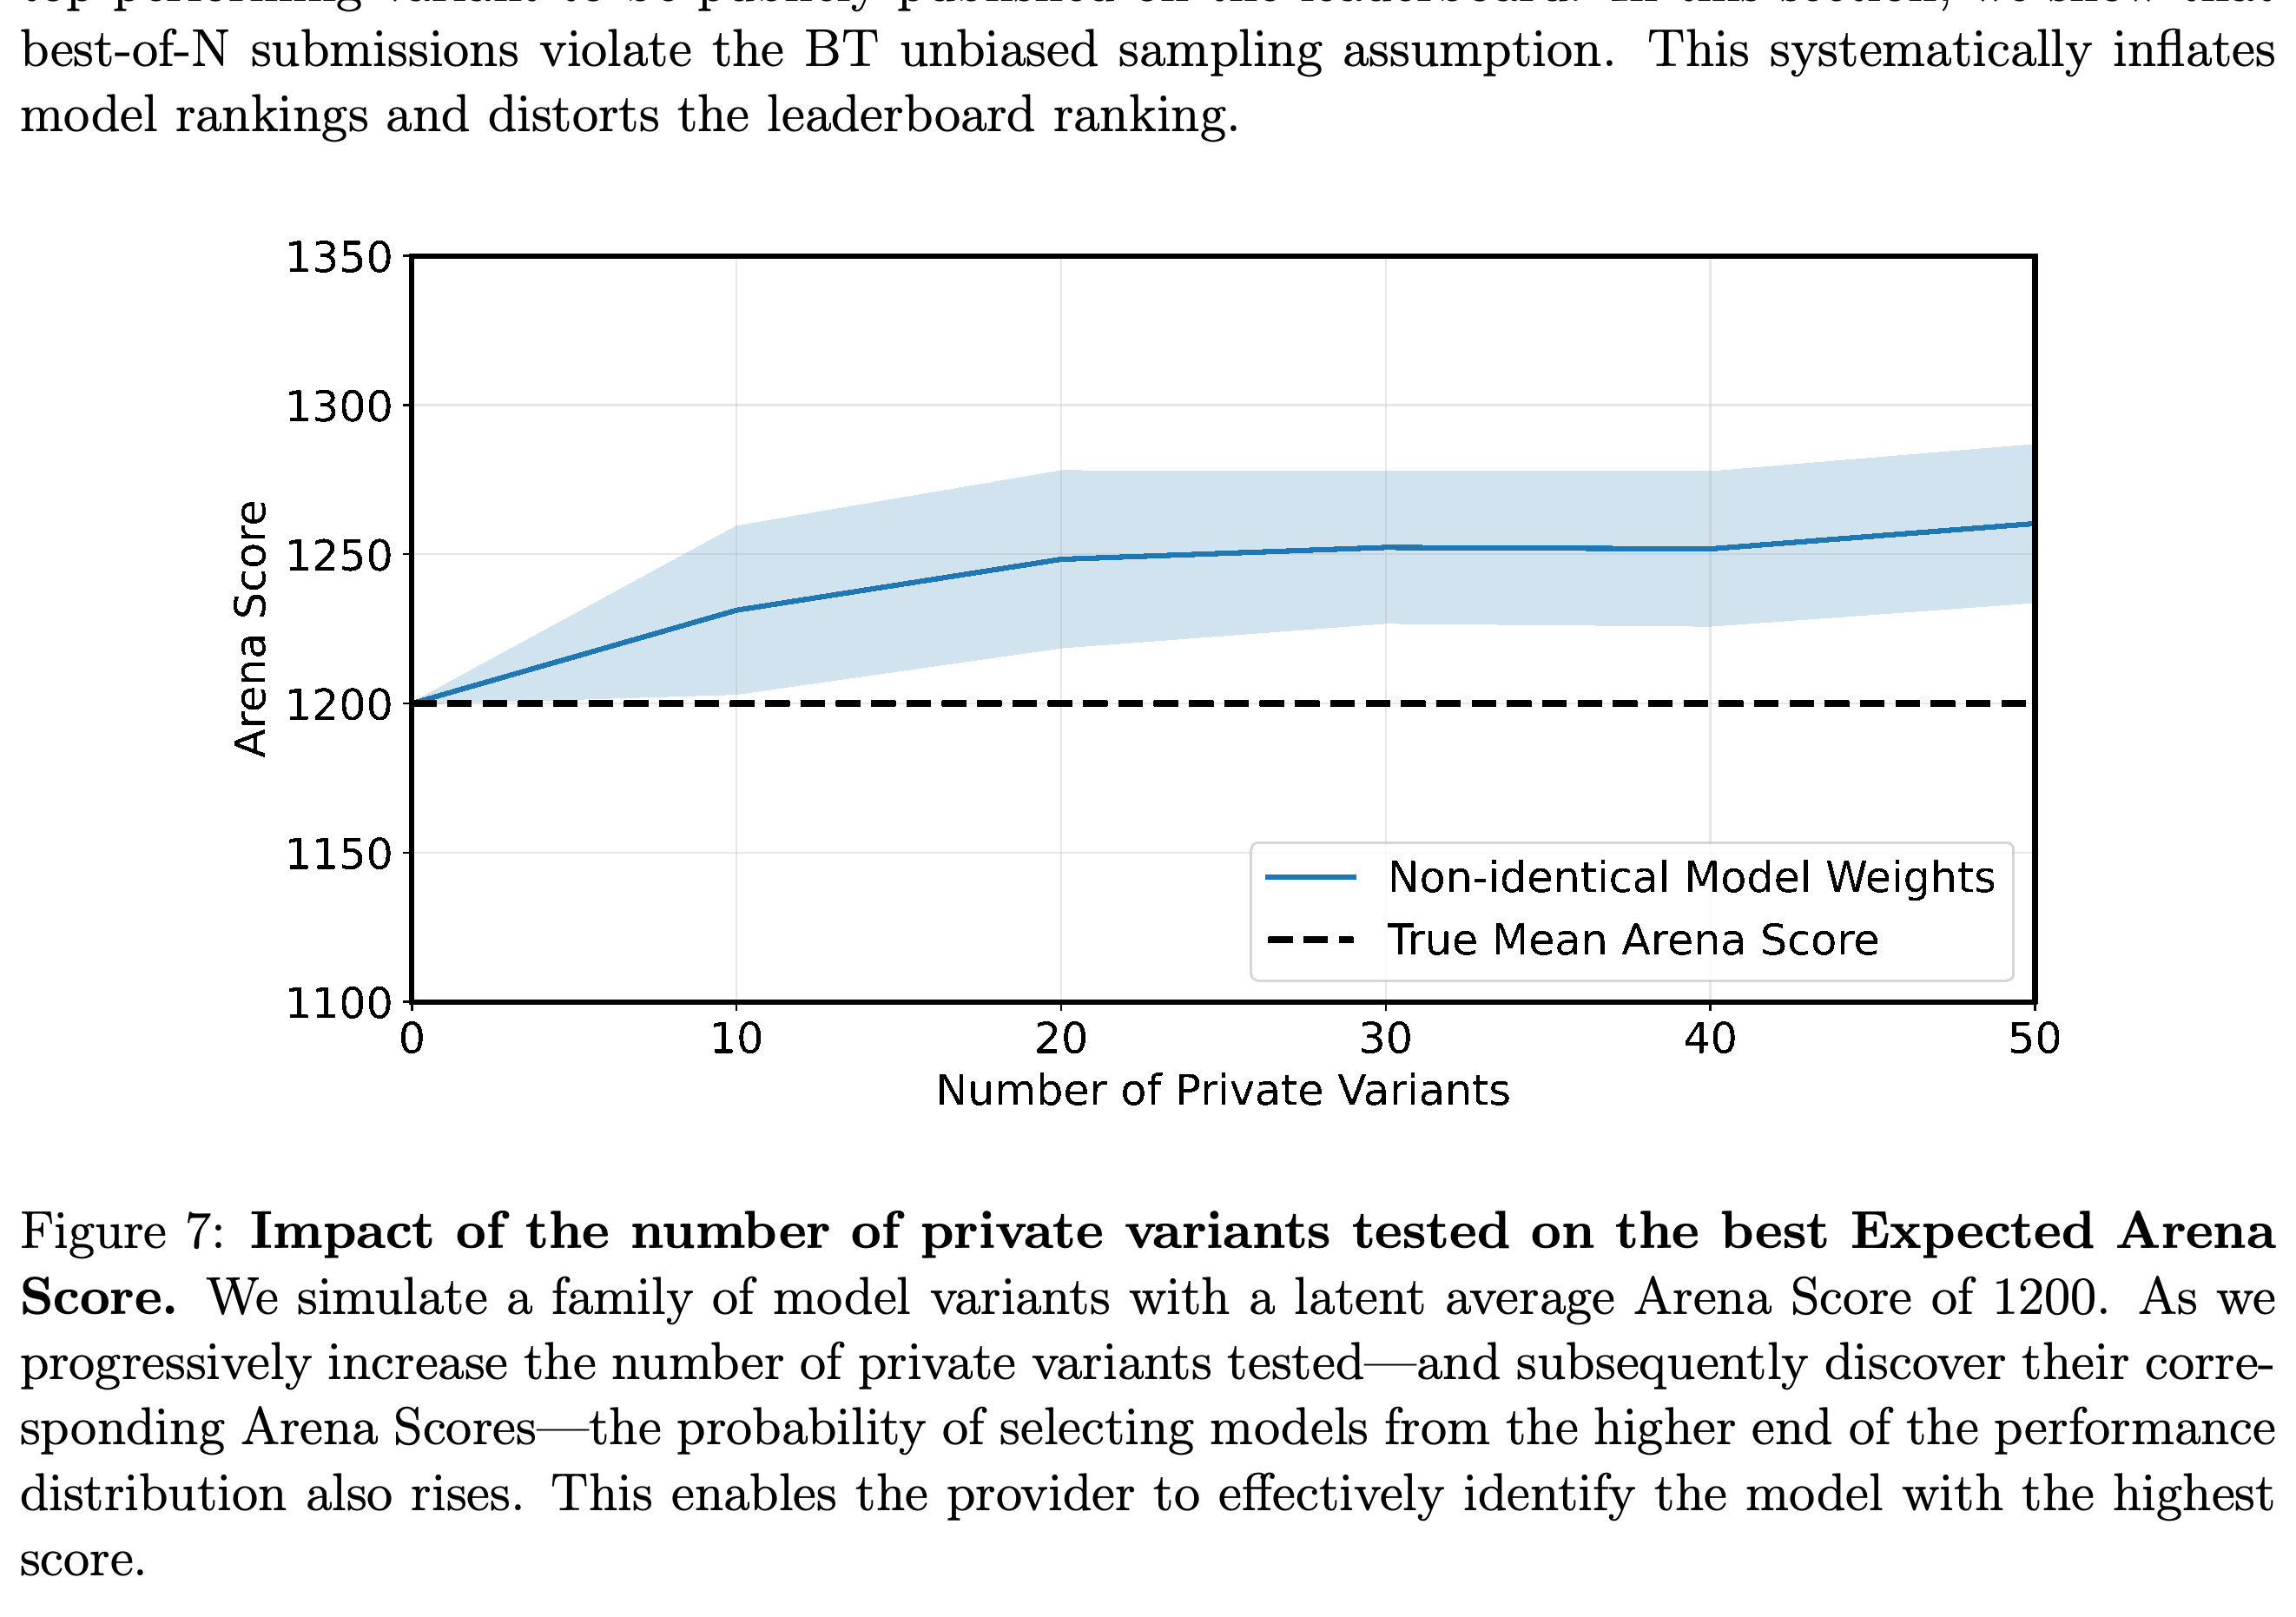
- The simulation generates battles, estimates scores with BT, and uses bootstrap resampling, repeated sampling from observed outcomes, to estimate uncertainty while varying the number of private candidates from 0 to 50.
- For a family with mean Arena Score 1200, testing 20 non-identical variants increases the average maximum discovered score by approximately 50 points.
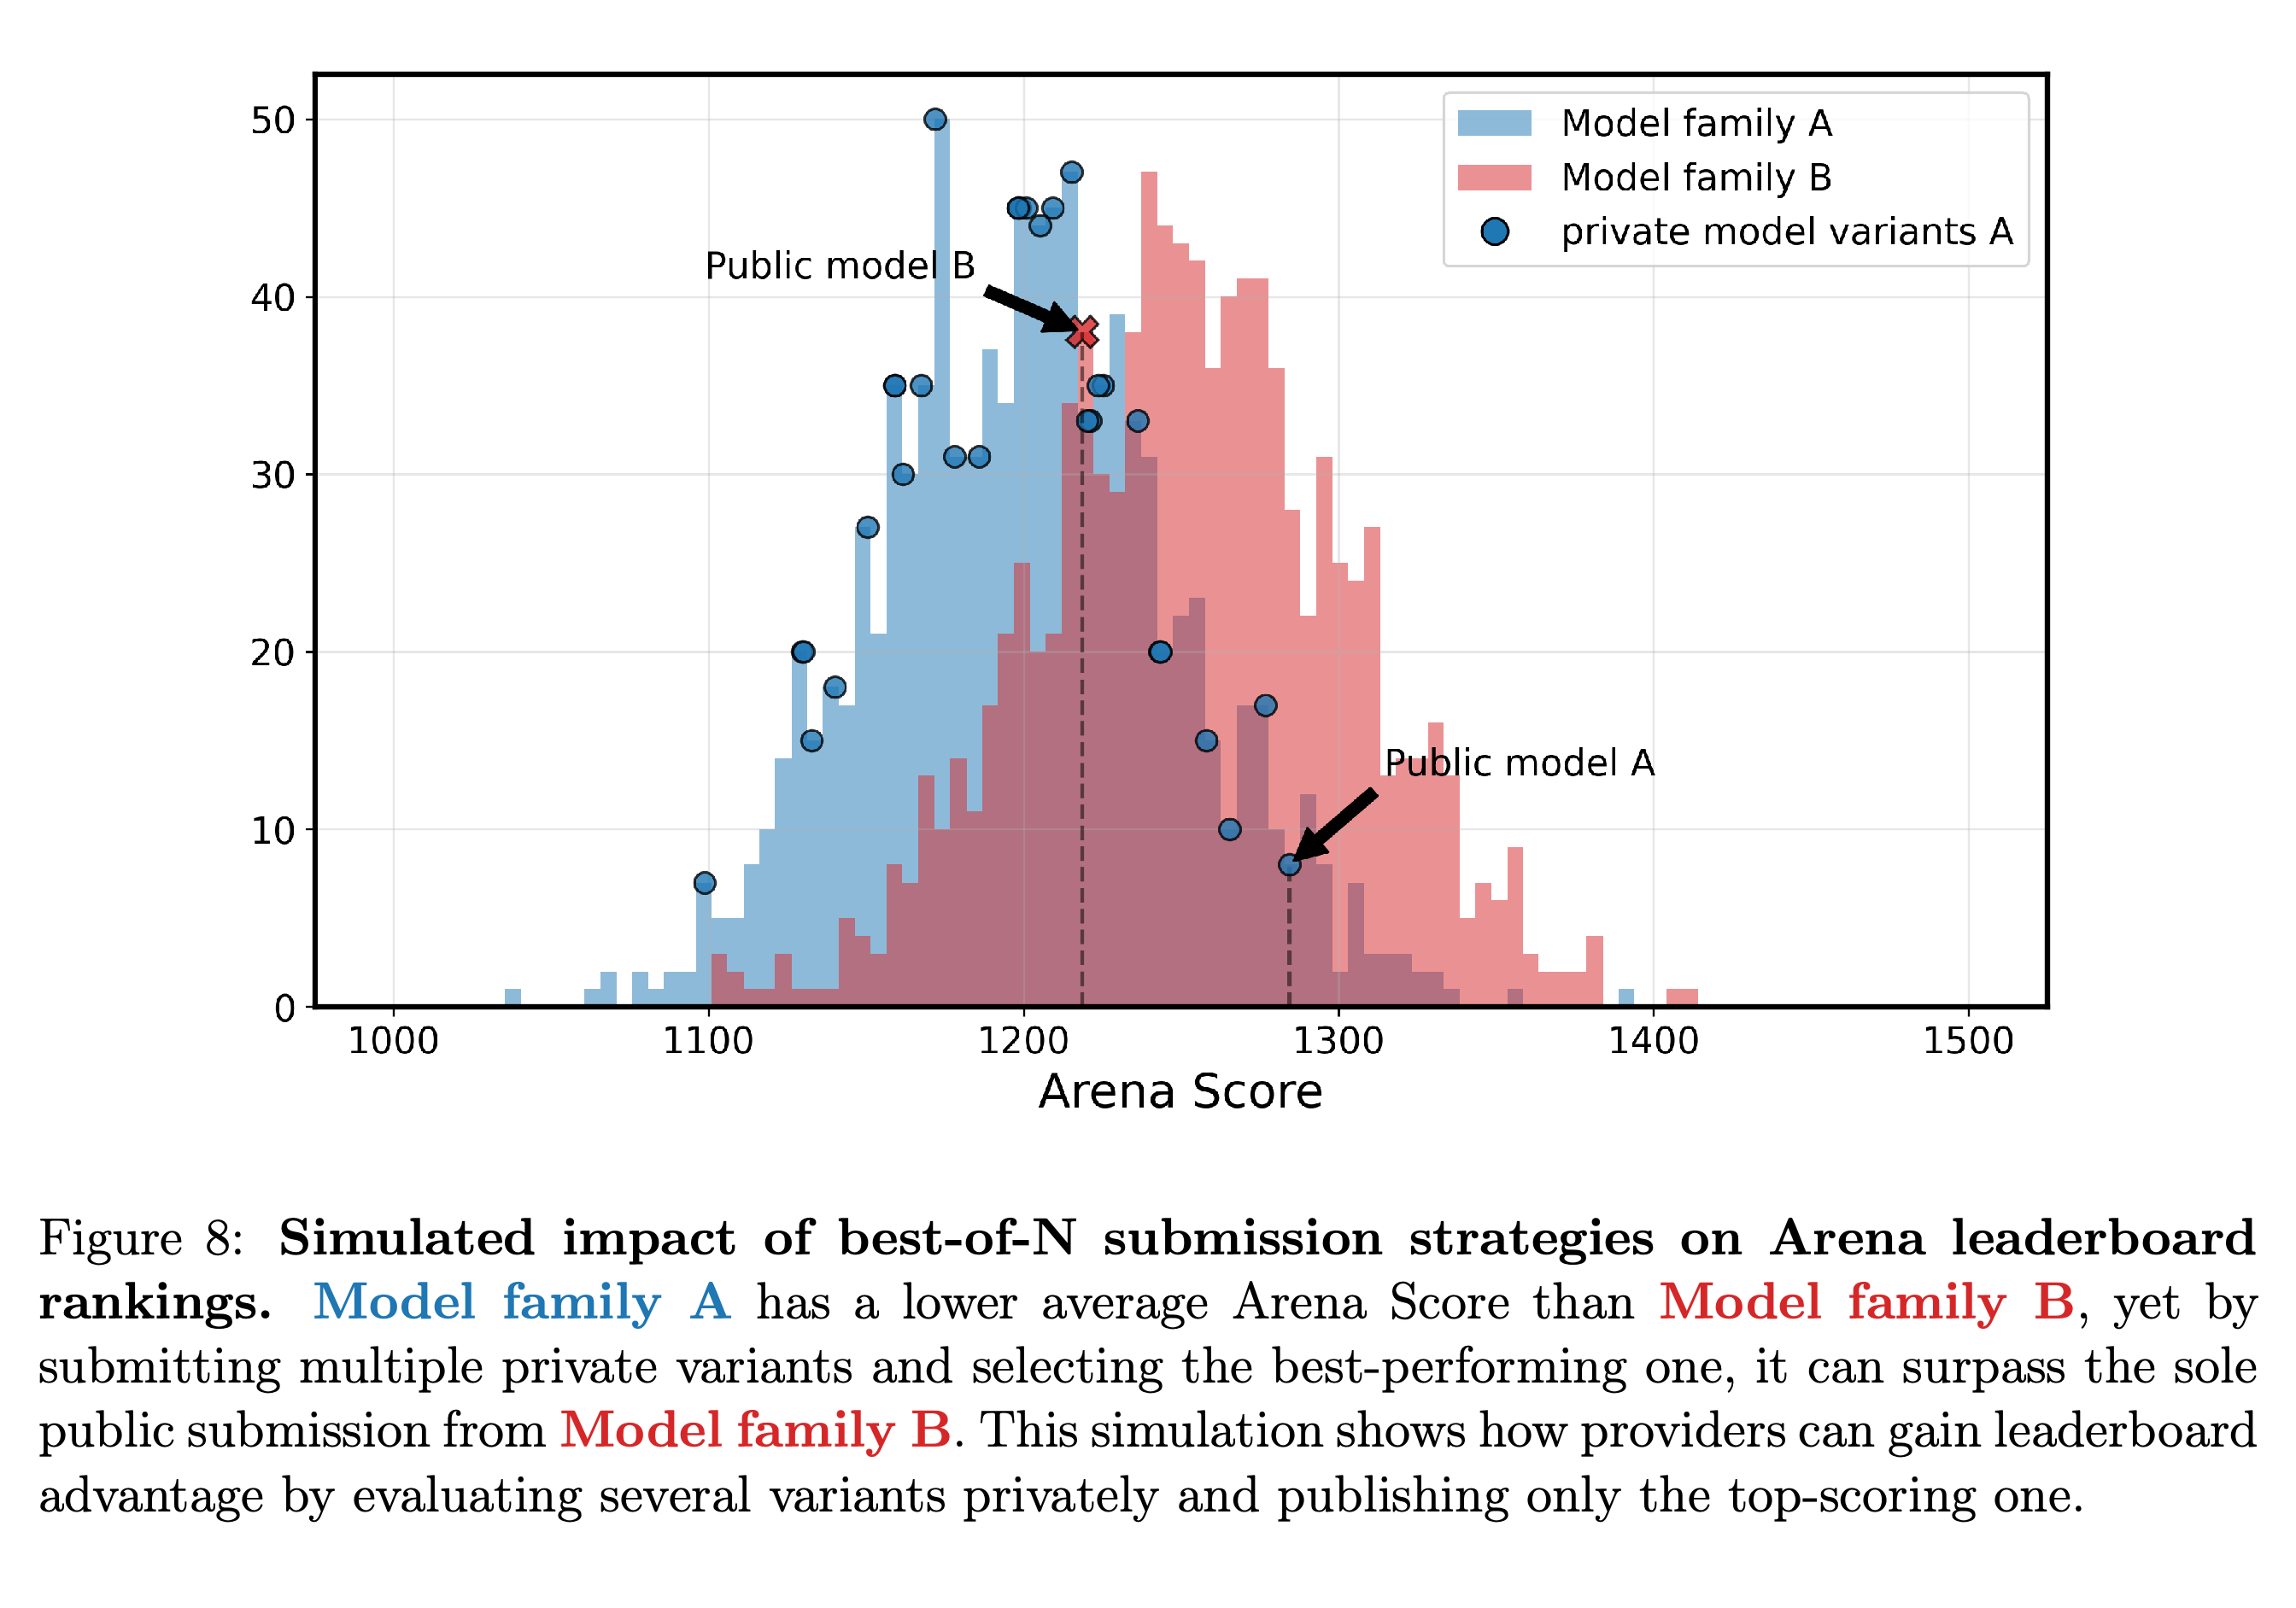
- A second illustration shows a family with lower average performance overtaking a stronger family’s single submission when only the former can select among multiple privately tested candidates.
For a candidate family centered at 1200, the selected maximum rises to approximately 1250 with 20 non-identical variants. This supports the detailed simulation discussion and conflicts with the earlier findings box claiming approximately 100 points from 10 variants.
The lower-mean family’s selected candidate exceeds the stronger family’s single published candidate. The example illustrates unequal model-selection opportunities, with the selected result reflecting genuine candidate variation as well as evaluation noise.
3.3 Real-world Chatbot Arena Experiment
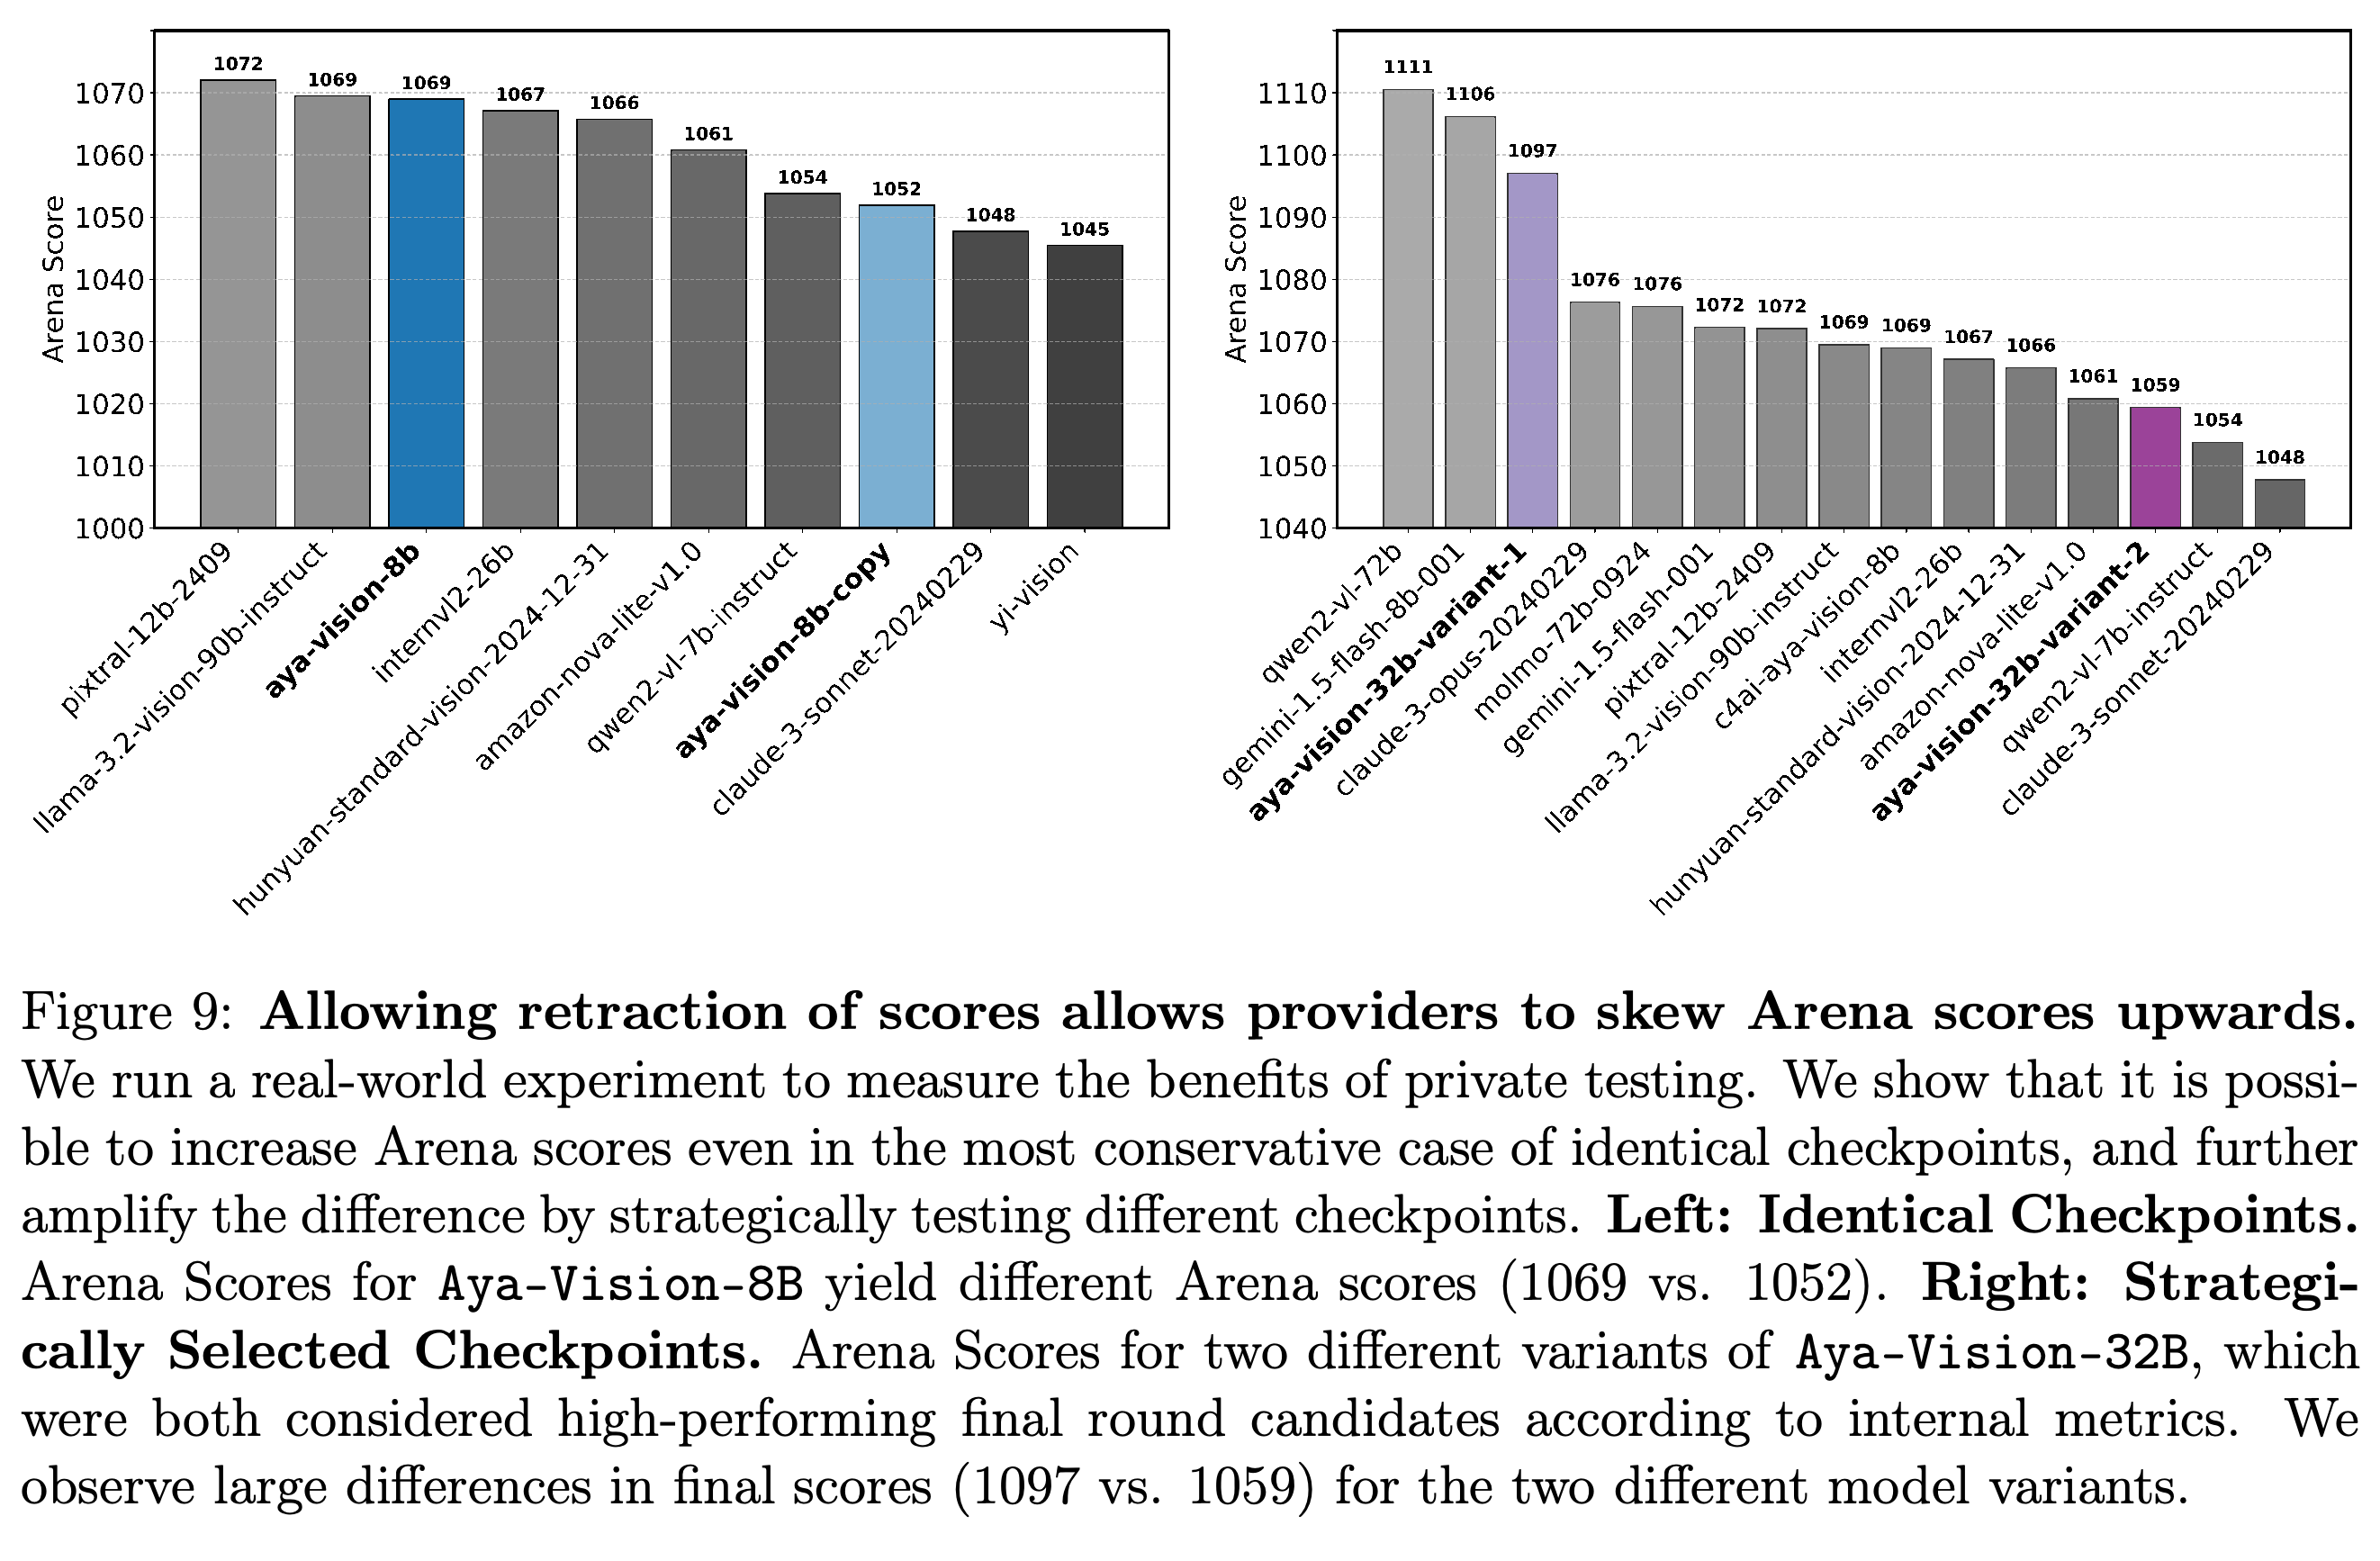
In March 2025, two identical Aya-Vision-8B checkpoints received Arena Scores of 1052 (±21/22) and 1069 (±19/23), with four models between their point estimates. Two distinct Aya-Vision-32B final candidates received 1097 (±29/25) and 1059 (±18/23), with nine models between them.
- The identical-checkpoint comparison shows observed score variation without a change in underlying weights; the authors did not disclose the duplication to Arena.
- The distinct checkpoints performed somewhat differently on internal benchmark subsets, so their score difference includes candidate quality differences as well as evaluation variation.
- The reported uncertainty intervals overlap. These examples demonstrate an opportunity to select favorable point estimates without establishing statistically distinct capabilities for the identical submissions.
The identical Aya-Vision-8B submissions differ by 17 score points, and the distinct Aya-Vision-32B candidates differ by 38. Intermediate leaderboard entries make favorable point-estimate selection visible, while overlapping reported uncertainty intervals limit claims of statistically resolved differences.
4 Results: Impact of Data Access Asymmetries on Arena Scores
Data access differences arise from the number of submitted variants, their sampling frequency, their duration of activity, and who hosts model requests. The paper estimates that OpenAI, Google, Meta, and Anthropic together account for 62.8% of Arena data exposure, approximately 68 times the combined share attributed to Allen AI, Stanford, Princeton, and UC Berkeley.
- The controlled training experiment tests whether access to this evaluation distribution improves scores under a fixed training budget.
- These exposure estimates measure opportunities to receive data; they do not document whether other providers retained or trained on those prompts.
4.1 Disparity in access to Chatbot Arena Data
A model’s sampling rate is the percentage of a day’s battles in which it appears; a provider’s reported maximum is the highest such rate observed for any of its models on any eligible day. Google and OpenAI reached approximately 34%, compared with 3.3% for Reka, during the January–March 2025 crawl.
- The authors’ experiment increased the reported prompt share from 5.9% with one variant to 19.4% with three variants.
- Providers serving their own API can receive all prompts routed to their models. Providers relying on third-party hosting instead depend on public releases or Arena’s policy allowing requests for 20% of records involving their models.
- Estimated shares for Google and OpenAI are 19.2% and 20.4%, respectively. A prompt can reach two providers because each battle involves two models, so these are not mutually exclusive sets of unique user questions.
- Retirement limits future data access. The paper contrasts 205 models classified as having very low activity with 47 officially listed retirements; these counts should not be added as disjoint groups.
4.2 Risk of Potential Overfitting
Overfitting here means learning characteristics of the evaluation distribution that improve familiar-task performance without comparable improvement elsewhere. The paper investigates changes in prompt composition and repeated prompts, showing that a live benchmark can evolve while retaining regularities that support adaptation.
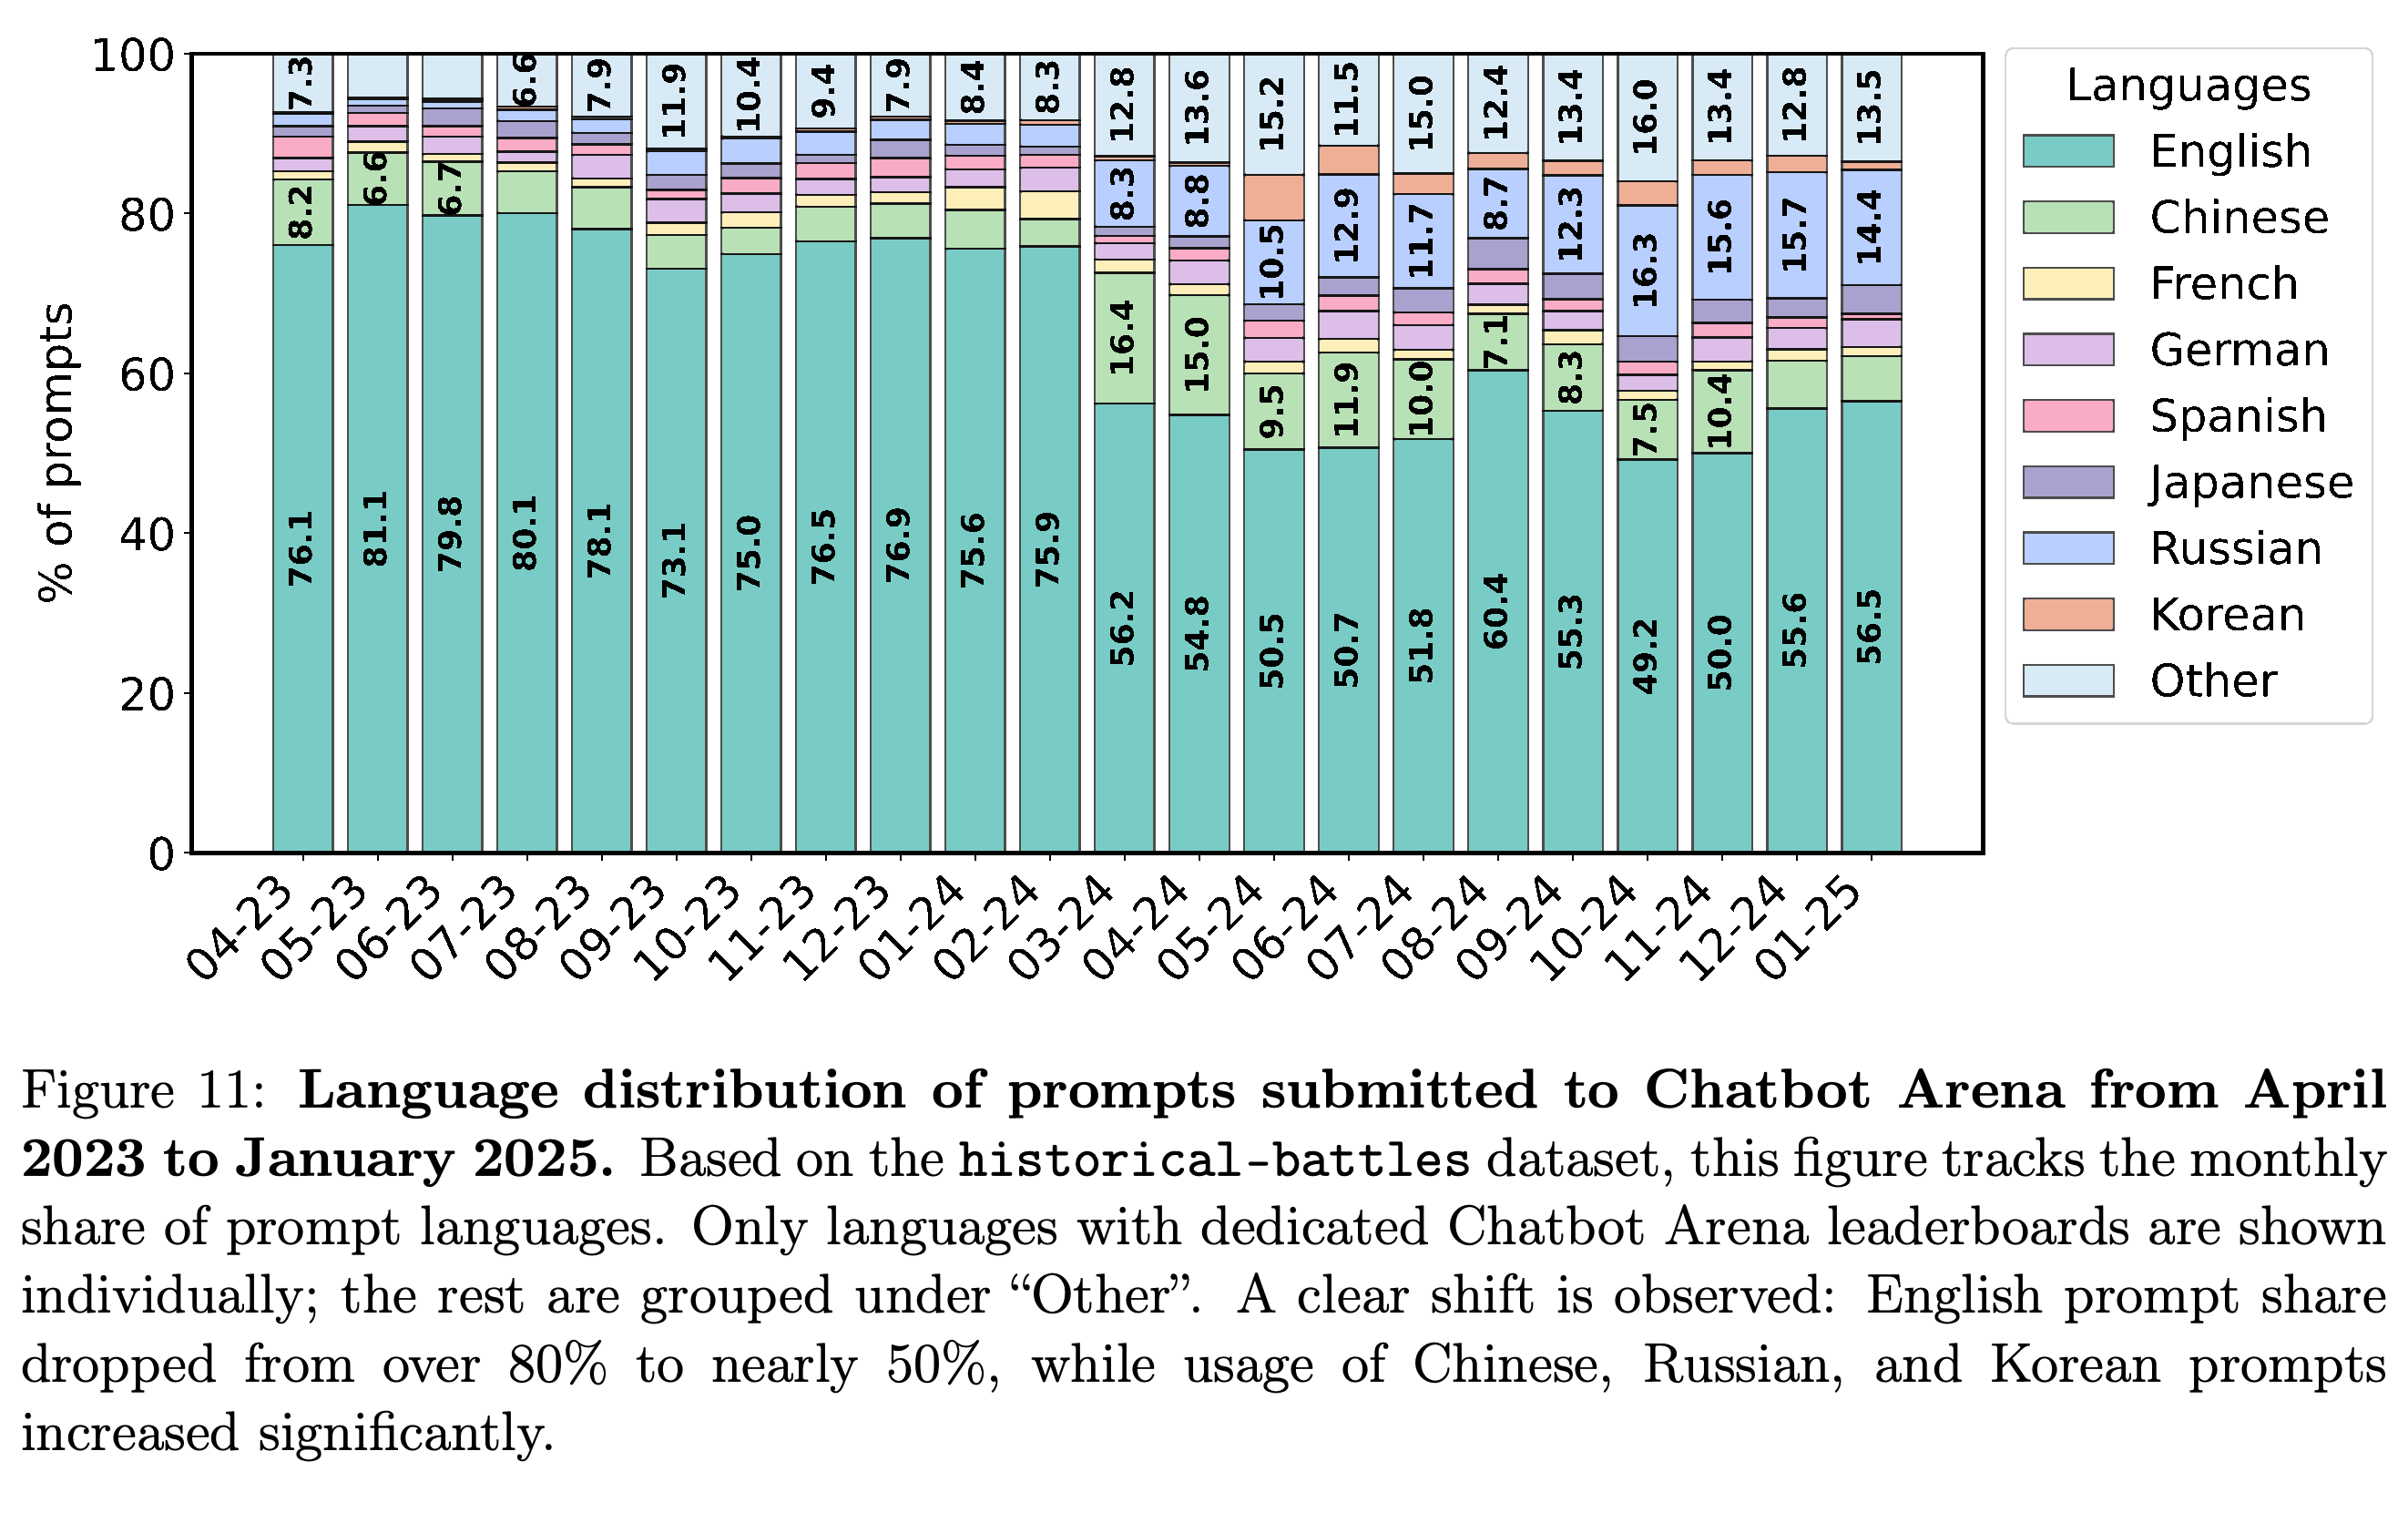
1) Long-term distribution shifts. The share of non-English prompts increased from 23.9% in April 2023 to 43.5% in January 2025. Russian prompts reached 15.7% in December 2024, while Chinese prompts peaked at 16.4% in March 2024 before falling to 6.2% in January 2025.
- These changes matter because a model’s relative strengths can depend on language and task composition.
- The analysis combines public records with Cohere-related private battle records; this sample composition matters when interpreting platform-wide trends.
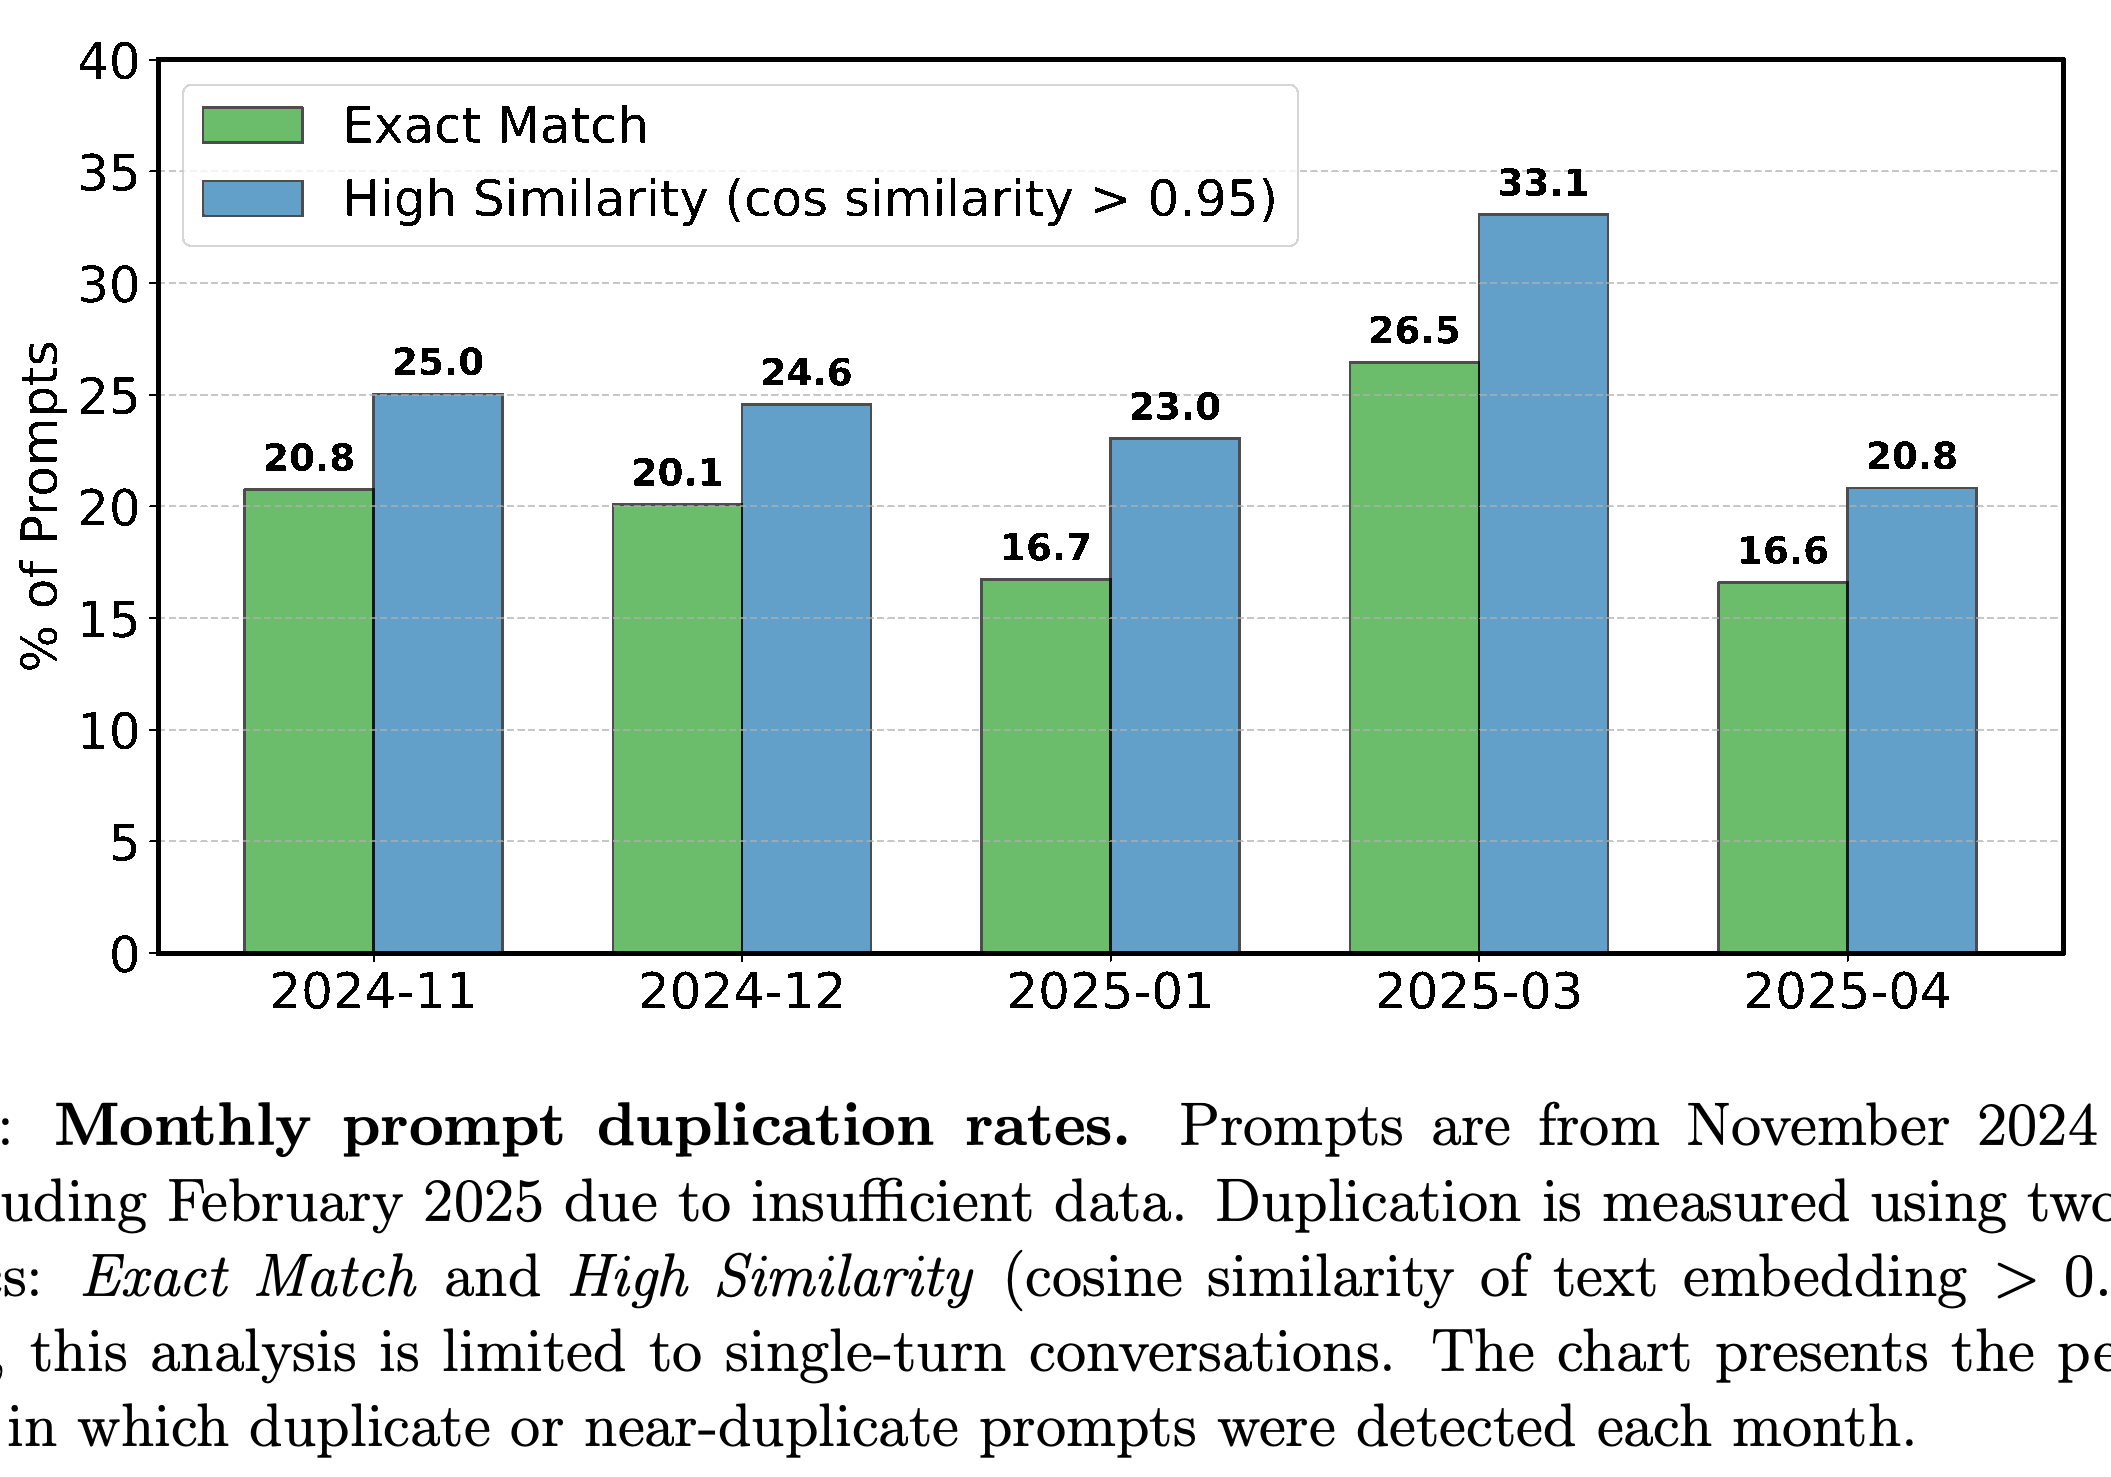
2) Prompt redundancy and duplication. Among 197,217 single-turn API conversations, the paper reports an average monthly exact-duplicate removal rate of 20.14%, peaking at 26.5% in March 2025. Near-duplicate detection uses embed-multilingual-v3.0 text embeddings, numerical representations of text, with cosine similarity > 0.95, a threshold for similarity between those representations; the corresponding monthly rate reached 33.1%.
- February 2025 is excluded because the available data were insufficient.
- The paper reports 7.3% exact and approximately 9% semantically similar overlap for its December 2024–January 2025 comparison.
- The authors also identify a reported 12000-character prompt limit and suggest that a developer-oriented user population could skew the topics represented in Arena.
The training experiment fine-tunes a 7B, or seven-billion-parameter, base model used for the Cohere Command family with 0%, 30%, or 70% arena-mix data, filling the remainder with other-sft-mix, a proprietary collection of instruction-following, multilingual, mathematics, and code examples. All variants use supervised fine-tuning, meaning training on supplied response examples, for 1.3K steps with batch size 128.
- Evaluation uses 500 English ArenaHard prompts, Llama-3.1-8B-Instruct as the comparison model, and gpt-4o-2024-11-20 as an automated response judge.
- Win rates are 23.5%, 42.7%, and 49.9% for 0_arena, 30_arena, and 70_arena. The paper reports relative improvements of 81.7% and 112.3% over 0_arena.
- Against 0_arena itself, the 30% and 70% mixtures achieve 71.4% and 79.2% win rates.
- On MMLU, the Massive Multitask Language Understanding benchmark used as a separate evaluation distribution, accuracy is 66.5%, 64.4%, and 65.9%. These results show no improvement on this additional benchmark; they do not comprehensively characterize general capability.
With training steps and batch size fixed, increasing Arena data raises win rates against both 0_arena and Llama-3.1-8B-Instruct. The latter comparison moves from 23.5% through 42.7% to 49.9%, with training-mixture composition as the manipulated factor.
Changing language shares show that models evaluated at different times encounter different prompt mixtures. This motivates continued evaluation of older models whose relative strengths depend on language, while the combined public and provider-specific sample limits platform-wide interpretation.
Exact-duplicate rates range from 16.6% to 26.5%, and high-similarity rates range from 20.8% to 33.1% across the displayed months. Repetition in this provider-side sample supports the possibility of distribution-specific adaptation even as the benchmark receives new user submissions.
5 Results: Impact of Model Deprecation on Arena Scores
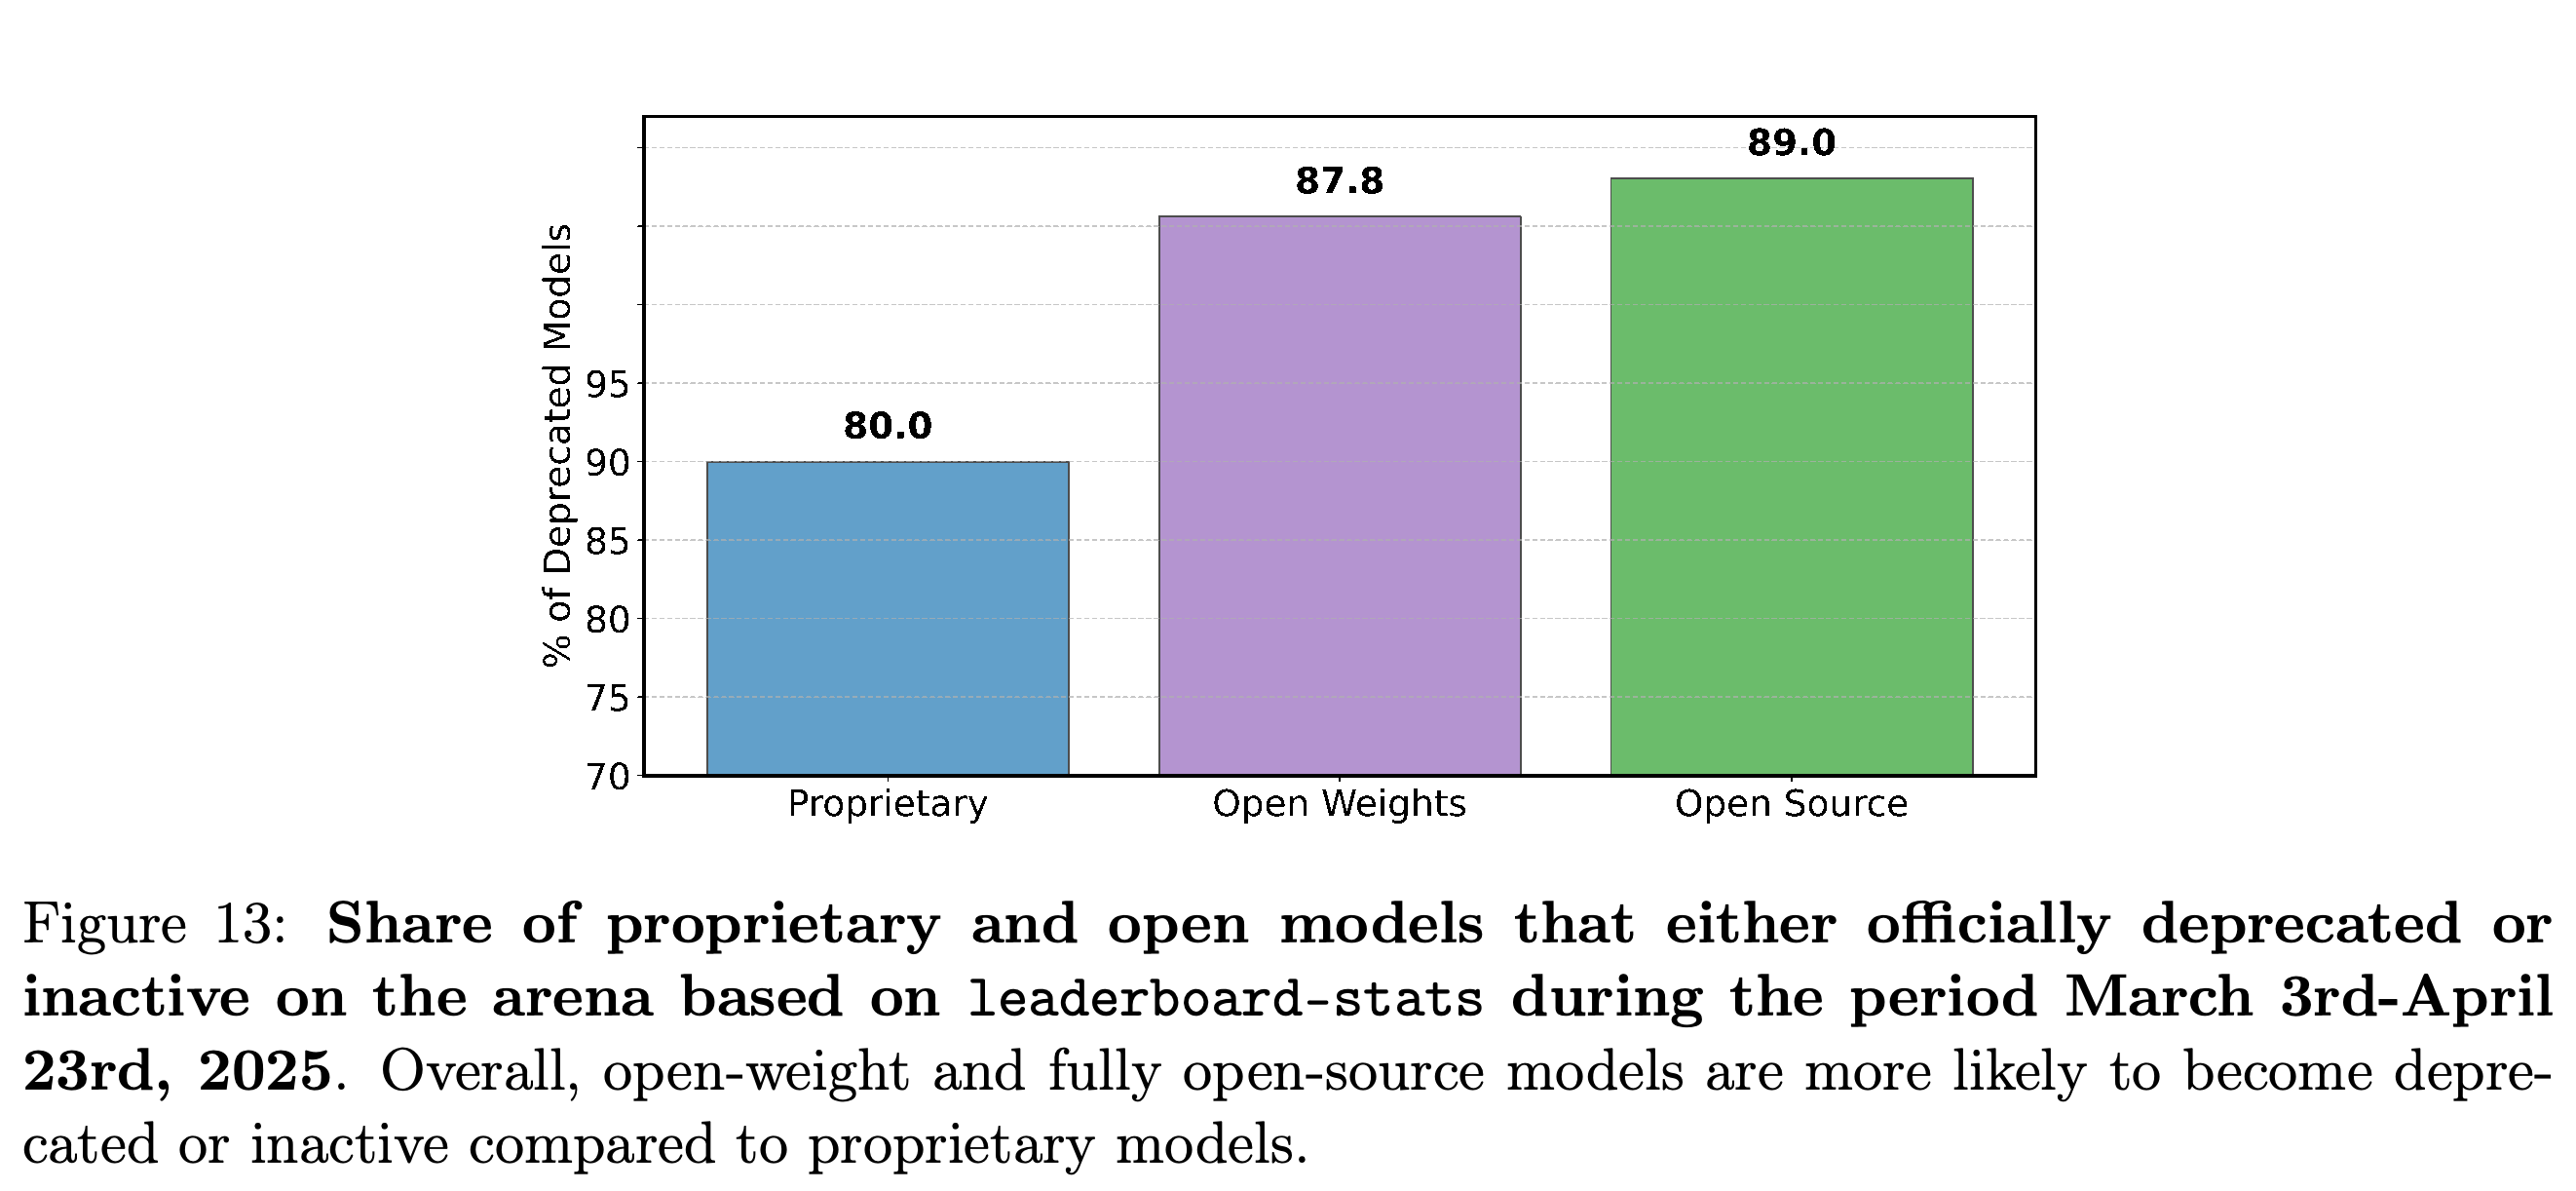
The paper reports that 80% of proprietary models, 87.8% of open-weight models, and 89% of open-source models were officially retired or inactive during March 3–April 23, 2025. It analyzes two possible ranking problems: outdated comparisons under changing tasks and insufficient connections between model groups.
- Inactivity is inferred from battle-count changes rather than direct access to internal retirement decisions.
- The experiments demonstrate possible failure mechanisms; they do not measure the resulting error in the actual Arena ranking.
The labeled retirement-or-inactivity rates are 80.0%, 87.8%, and 89.0% for proprietary, open-weight, and open-source models. These within-category rates differ from the separate claim that open models constitute 64% of silently removed models.
5.1 Transitivity Under Changing Evaluation Conditions
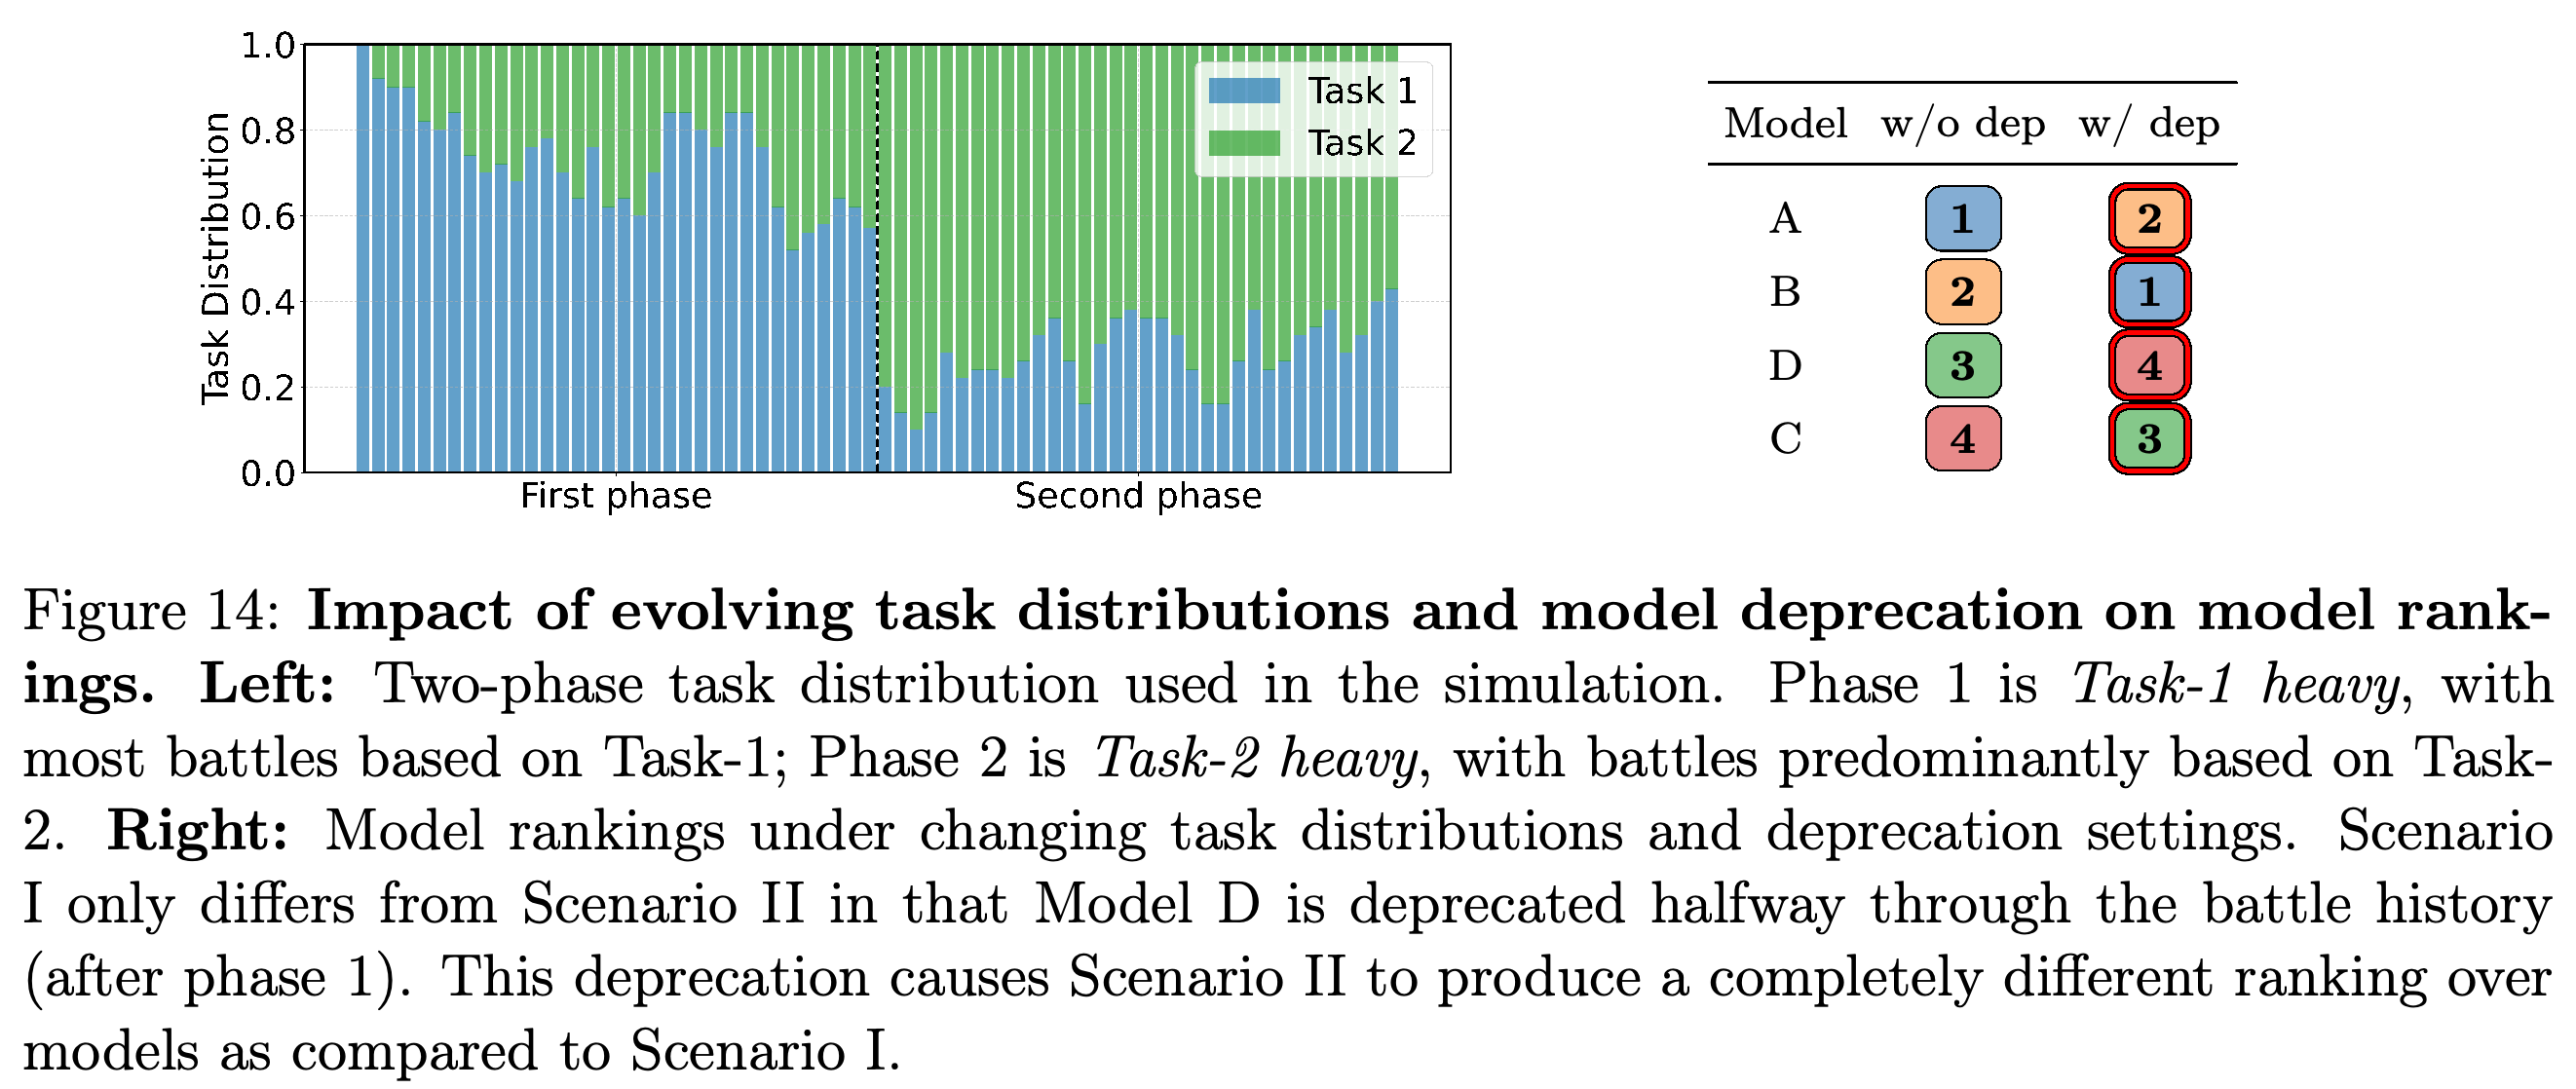
A four-model simulation changes the task mixture across two phases and compares continued participation with retirement of model D after phase 1. The experiments use 2000 simulated battles and Arena’s FastChat scoring implementation.
- Task-specific strengths differ substantially: model B beats D with probability 0.9 on Task-1 and 0.2 on Task-2.
- Without retirement, the displayed ordering is A, B, D, C; retiring D changes it to B, A, C, D.
- The result illustrates how leaving one model evaluated mainly under old conditions can also change the inferred ordering of models that remain active.
Removing D between the two task-mixture phases changes every displayed rank: A and D move down, while B and C move up. The simulation shows how retirement can affect models that remain active through their shared comparison history.
5.2 Sparse Battle History Risks
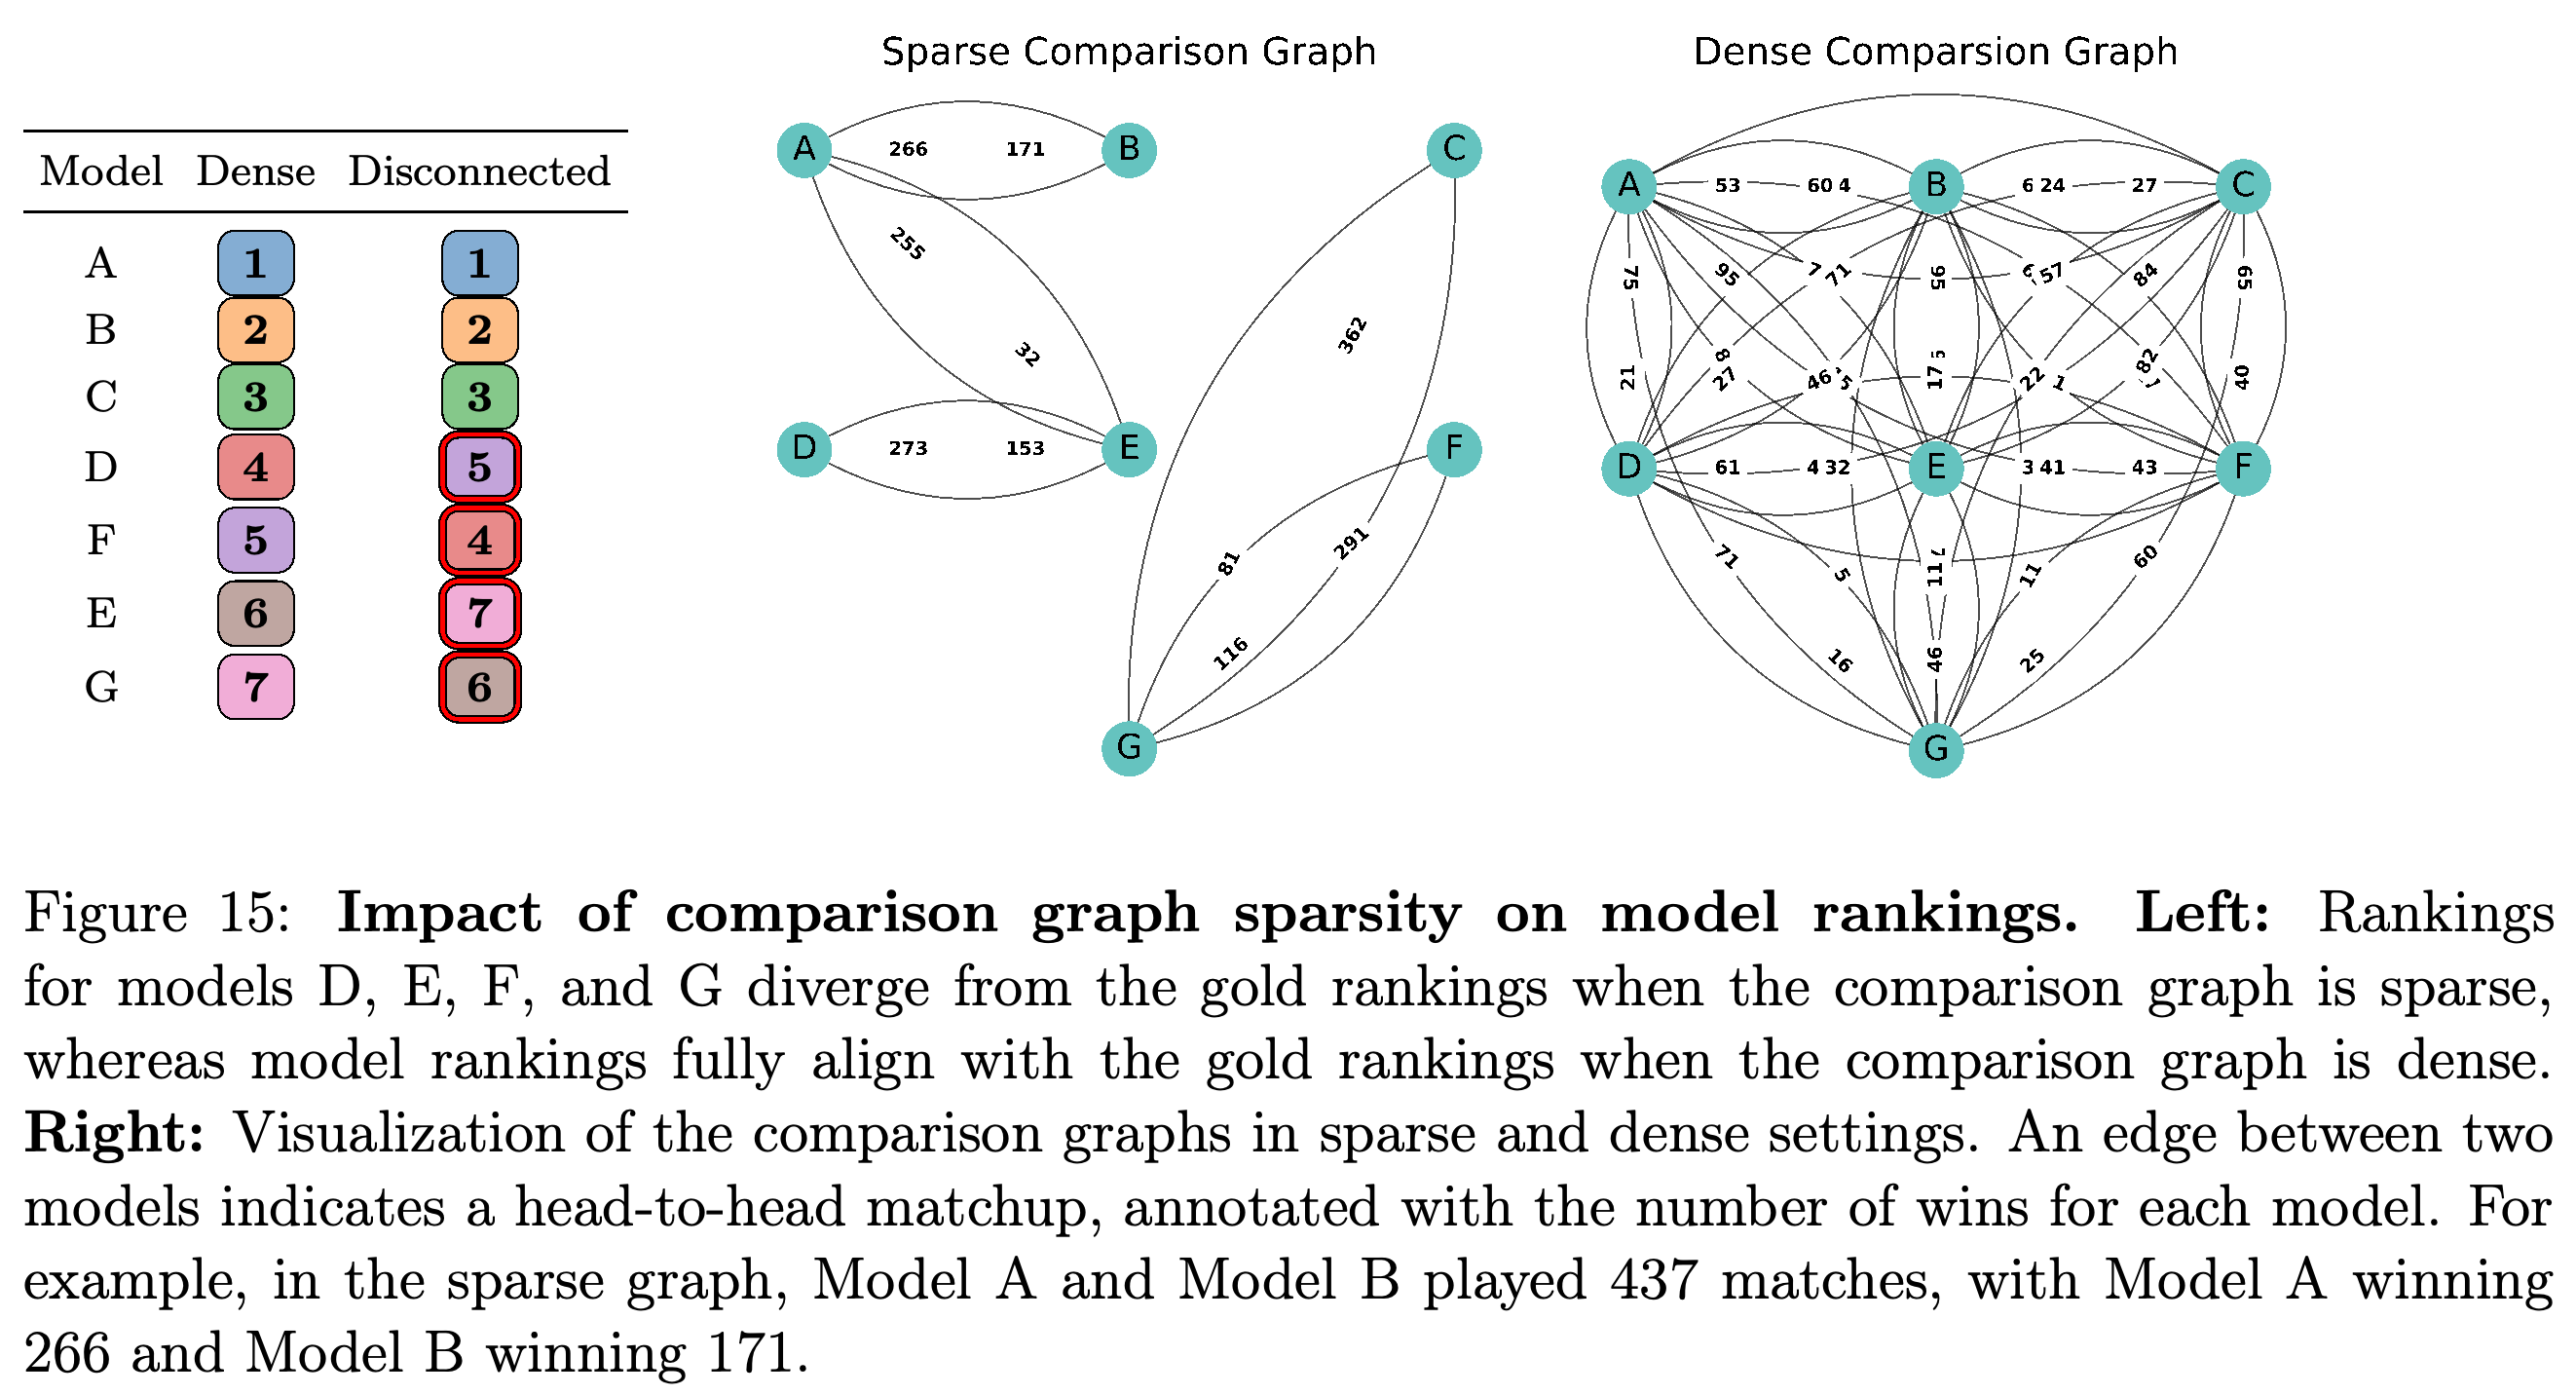
The sparse-history experiment compares dense and disconnected comparison graphs, where models are nodes and recorded pairwise outcomes form links. Both settings contain 2000 battles among seven models, with no ties and assigned strengths of 1450, 1390, 1250, 1200, 1101, 1150, and 1000 for A through G.
- Dense comparisons recover the displayed strength ordering, while disconnected comparisons change the positions of D, E, F, and G.
- For a unique finite BT maximum-likelihood solution, which fits strengths to the observed outcomes, the paper states the stronger connectivity condition: every partition must have at least one observed win crossing in each direction. Strengths also require a common normalization because their absolute scale is not identified by pairwise outcomes.
- Missing links can prevent reliable global comparisons. The paper does not show that the actual historical Arena graph has the simulated disconnected structure.
With the total battle count fixed at 2000, restricting which pairs can meet changes four lower-ranked positions relative to the dense setting. The example shows why outcomes collected within disconnected groups cannot identify a reliable global ordering.
6 Recommendations and Guidelines for Improving Leaderboards
The recommendations target the mechanisms identified in the audit: publish all submitted scores permanently, disclose and limit private variant counts, define auditable retirement rules, sample to reduce ranking uncertainty, and publish testing and activity records.
- The introductory recommendations give a maximum of 3 concurrent private variants per provider as an example, rather than an experimentally optimized limit.
- The retirement proposal removes the bottom 30th percentile within each license category after rankings converge, considering availability and performance. Its effectiveness is not experimentally evaluated.
- The proposed active sampling rule, which chooses comparisons according to their expected information gain, prioritizes under-evaluated model pairs with high uncertainty by estimating the reduction in their win-rate confidence interval.
- Suggested transparency includes periodic reporting, for example quarterly, of tested variants, opponents, sampling frequencies, and models no longer regularly sampled.
7 Limitations
The authors lack comprehensive raw Arena data, and some released records have already been deduplicated or filtered for suspicious voting. Their provider-side records cover only a subset of traffic, so they do not investigate adversarial voting, meaning deliberate votes intended to manipulate rankings.
- Private model observations cover January–March 2025, coinciding with the lead-up to Llama 4 and potentially undercounting providers with different launch schedules.
- Anonymous-model ownership is inferred from self-identification and can be wrong or ambiguous.
- The authors describe their training experiment as conservative because some providers may have more data. Larger gains from additional data remain a possibility rather than a measured result.
8 Related Work
The related-work discussion places the audit within research on benchmark validity and human-preference evaluation. It distinguishes the usefulness of live user judgments from concerns about incentives, data quality, reproducibility, and manipulation.
8.1 Meta-studies on the Rigor of Benchmarking in AI
The paper reviews evidence that benchmarks shape research incentives and can suffer from training contamination, meaning exposure to evaluation examples during training, inconsistent task definitions, label errors, and saturation, when scores leave little room to distinguish further progress. Its contribution is to examine how operational policies in a live leaderboard can introduce related problems even when users continually supply new prompts.
- The discussion also emphasizes that high benchmark scores need not represent utility in deployment when benchmark tasks omit relevant settings or capabilities.
8.2 Human Voting-based Benchmarks
Human voting captures preferences about coherence, readability, and harmlessness and supplies feedback useful for model training. Live platforms can adapt to changing uses, while automated judges introduce their own robustness and bias concerns.
- The paper acknowledges Arena safeguards, including suspicious-user detection, bot protection, vote limits, and deduplication.
- Prior studies of targeted voting attacks provide context, but this paper examines provider testing and operational policies rather than conducting an adversarial-voting audit.
9 Conclusion
The conclusion argues that reliable public comparisons require transparency about candidate selection, data exposure, sampling, and retirement alongside a statistical scoring model. It acknowledges the organizers’ work in building a community resource and calls for policy changes to keep the benefits of participation from concentrating among a few providers.
Appendix
- A Chatbot Arena Background describes the platform’s May 2023 launch under LMSYS, the research collaboration behind the platform, its later development as LMArena, and the use of user preferences to compute ratings. B Bradley-Terry Rating Model supplies the logistic pairwise-preference formulation, maximum-likelihood fitting through binary cross-entropy, a loss comparing predicted probabilities with observed outcomes, score rescaling, and the role of uncertainty in ranking.
- C Unbiased Sampling: Why Selecting the Maximum Introduces Bias? derives the maximum’s cumulative distribution, the probability that it does not exceed x, as F(x)^N for independent, identically distributed draws. It proves that the maximum’s expectation exceeds that of one draw when the distribution has finite expectation, nonzero variance, and N ≥ 2. This establishes favorable selection relative to a typical draw; for heterogeneous checkpoints, interpreting the entire uplift as estimation error would conflate genuine candidate differences with measurement noise.
- D Data sources and D.1 Public and Private Battles detail historical-battles, API prompts, leaderboard-stats, and scraped-random-sample. The API collection contains 567,319 entries before filtering to 197,217 single-turn conversations; the private historical subset contains 43,729 battles involving Command and Aya models, and the main crawl contains 5864 battles.
- E Our Scraping Methodology of LMArena Statistics and E.1 De-anonymizing Model Identities describe Selenium, a browser-automation library, with a Chrome driver, identity questions, and follow-up questions intended to produce ties. An additional approximately 500 vision observations were collected during March 9–28, 2025. Self-identification supports provider attribution but does not independently verify checkpoint ownership.
- E.2 Encountered Private Models in Scraping lists private aliases from the overall and vision leaderboards, including Meta’s 27 overall variants and 16 additional vision variants. E.3 Encountered Public Models in Scraping lists observed public models and reports 15 for Google and 9 for OpenAI; these observed active-model counts differ in scope from cumulative public leaderboard counts.
- E.4 Assignment of Private Variants to Providers records identity-revealing response counts and examples, including variants supported by only a few responses. Models with p2l and experimental-router prefixes are assigned to LMArena’s Prompt-to-Leaderboard work, a model-routing research project, despite naming upstream providers. E.5 Sampling Rates restricts daily maxima to days with at least 100 collected samples and records 34.21% for Google’s enigma and 34.0% for gpt-4.5-preview-2025-02-27.
- F License Categories groups reported license labels into Proprietary, Open-Weights, and Open-Source. G Data Access Estimation for Different Providers scales approximately 3M votes to approximately 6M model API calls because each battle uses two models; Figure 4 shows selected providers accounting for approximately 5M calls, with each square representing roughly 5K calls.
- H Analysis of Prompt Repetitions in Arena Data provides within-month and cross-month matrices for exact matches and embedding similarity. The diagonal reaches 0.265 for exact matches and 0.331 for high similarity in March 2025, showing repetition within the provider-side sample alongside lower but nonzero overlap between months.
- I Simulation for Expected Lift from Private Testing and I.1 Background map the fitted log-strength parameter to Arena Score = 1000 + (400/ln 10)β̂, where β̂ is estimated log strength and ln denotes the natural logarithm. Under equal-strength independent comparisons, the appendix obtains a standard error, the estimated sampling variability, of approximately 347.4/√n on the Arena scale for n votes and separates identical from heterogeneous candidate models.
- I.2 Identical Variants (σtrue = 0), I.2.1 Extreme-value uplift, and Asymptotics attribute selected-score uplift entirely to measurement noise, which decreases as the number of votes grows. Here σtrue denotes the spread in true checkpoint strength. The numerical illustration uses n = 3000 and 50 candidates to report approximately 17.7 Arena points; the displayed σnoise√(2 ln N) expression, where σnoise is the measurement-noise standard deviation, is a leading extreme-value approximation although Equation (6) presents it as an equality.
- I.3 Heterogeneous Variants (σtrue > 0), I.3.1 Extreme-value uplift, and Key consequences. add genuine between-checkpoint variation to measurement noise. The appendix reports approximately 56 points for σtrue = 20, N = 50, and n = 3000, and a selection advantage that persists as n increases; this remaining advantage is relative to the candidate-family mean and includes selecting a genuinely stronger checkpoint. J A. Fisher Information for a Single BT Match derives information 0.25, a measure of information about relative strength from one outcome, for an equal-strength comparison.
- K Silent Model Deprecation: Additional Details identifies low activity through an average of 10 or fewer battles during the March 3–April 23, 2025 analysis period and reports 205 such models out of 243. Its figures distinguish official and silent categories, whereas several main-text passages call all 205 silently deprecated; the category accounting is therefore not consistently described.
- L Transitivity Under Changing Evaluation Conditions: Additional Details supplies Task-1 and Task-2 pairwise win probabilities, including a 0.1 tie rate for A versus B on Task-1 and 0.2 tie rates for A versus B and A versus C on Task-2. M Overfitting Experiments: Additional Evaluations reports MMLU accuracy of 66.5%, 64.4%, and 65.9% for 0_arena, 30_arena, and 70_arena, respectively.
Brief Thoughts
The paper’s clearest evidence comes from controlled comparisons: duplicate live submissions expose variation available for favorable score selection, and fixed-budget training demonstrates sensitivity to the evaluation distribution. The observational audit supports more auditable procedures, while incomplete records and approximate ownership attribution limit claims about individual providers’ intentions or the size of actual ranking distortions. A higher expected maximum across heterogeneous candidates includes gains from selecting a truly stronger candidate. The fairness concern is unequal access to that selection process and undisclosed testing history. The retirement simulations establish possible failure modes, but the proposed 30th-percentile rule is not experimentally validated, and the actual leaderboard’s connectivity is not measured. The conflicting private-testing headline numbers, retirement accounting, and finite-N extreme-value equality require care when reusing precise numerical claims.