


Whose Language Counts as High Quality? Measuring Language Ideologies in Text Data Selection | Summary
25 Jan 2022 | Paper Review Data Curation Selection Bias LLM PretrainingContents
This article explains the key points of Whose Language Counts as High Quality? Measuring Language Ideologies in Text Data Selection.
- 2022-01-25 (arXiv)
- Gururangan, Suchin, Card, Dallas, Dreier, Sarah K., Gade, Emily K., Wang, Leroy Z., Wang, Zeyu, Zettlemoyer, Luke, Smith, Noah A..
- University of Washington, University of Michigan, University of New Mexico, Emory University, Allen Institute for AI
- Paper
- Reviewed version: arXiv v2, 2022-01-26.
Summary
- Language-model training data are often selected by quality filters, but the social preferences encoded in those filters are rarely examined. In a nonrepresentative sample of U.S. school newspapers, a reproduction of the GPT-3 filter assigned higher scores to articles from larger schools in wealthier, more educated, and more urban areas than to those from schools in less advantaged areas.
- The authors analyzed 910K high school newspaper articles and compared filter scores with news-source factuality, human essay grades, and literary awards. Scores varied strongly with topic and genre, while the news-source comparison found no statistically significant distributional difference at p = 0.085.
- The demographic analysis uses school and area characteristics as proxies, not individual author attributes. The authors recommend documenting selection criteria and testing which voices and genres are excluded.
1 Introduction
The paper defines language ideology as assumptions and beliefs about language that justify its social use and structure (Craft et al., 2020). It argues that selecting reference texts for a filter embeds such assumptions, and that different applications can require different selection criteria.
2 Motivation: Data Sources
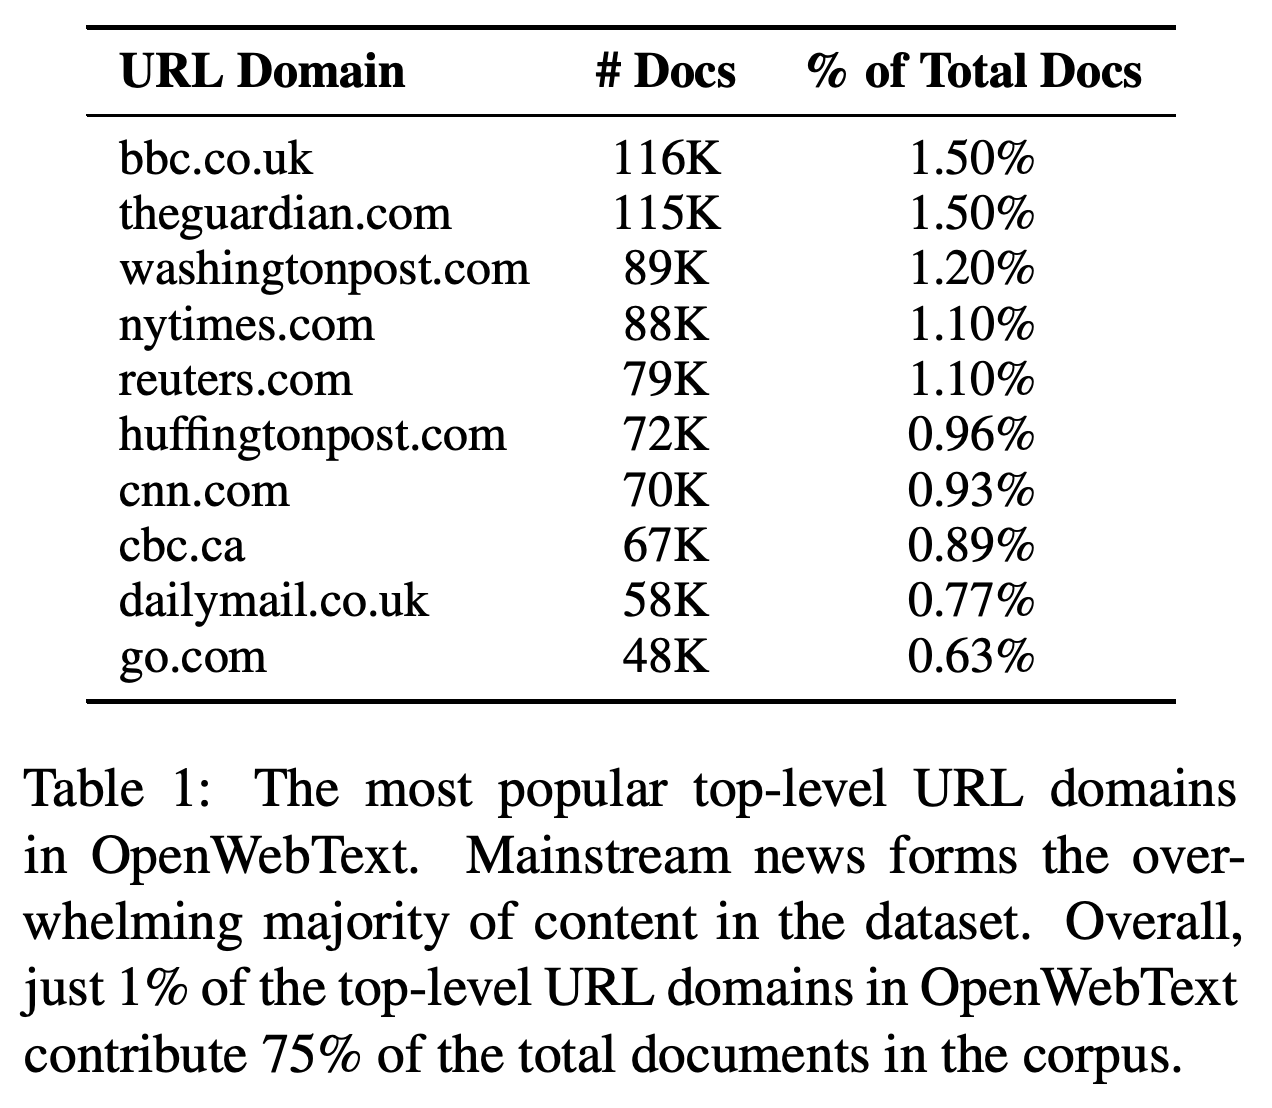
Wikipedia, books, and popular online articles recur as training sources despite documented imbalances in authorship and coverage. In OpenWebText, an open-source replica of a corpus based on popular Reddit links (Gokaslan and Cohen, 2019), 1% of 311K unique top-level domains account for 75% of documents.
BBC and The Guardian each contribute about 1.5% of documents, illustrating the prominence of large news domains in the popular-link corpus.
3 Measuring the Language Ideology of the GPT-3 Quality Filter
Because large reference corpora lack comprehensive author metadata, the authors examine a separate school newspaper dataset linked to demographic information at the newspaper, ZIP code, or county level. They measure the behavior of a replicated filter without directly measuring individual authors’ identities.
3.1 U.S. School News
The authors scraped 1.95M articles from 2,483 schools using a common WordPress template, then retained 910K articles from 2010–2019 at 1,410 high schools in 1,329 ZIP codes and 552 counties. They excluded video, photo, and multimedia categories and schools with fewer than 100 articles; the resulting sample is neither random nor representative.
3.2 The GPT-3 Quality Filter
The authors reproduce the filter described by Brown et al. (2020) using logistic regression with n-gram features, or sequences of adjacent tokens, to distinguish Books3, Wikipedia, and OpenWebText from a random Common Crawl sample. Training uses 80M whitespace-separated tokens from each positive source and 240M negative tokens; after 100 random hyperparameter trials, the classifier achieves 90.4% F1, a combined precision and recall measure, and 91.7% accuracy on 60M held-out tokens.
3.3 Document-Level Analysis
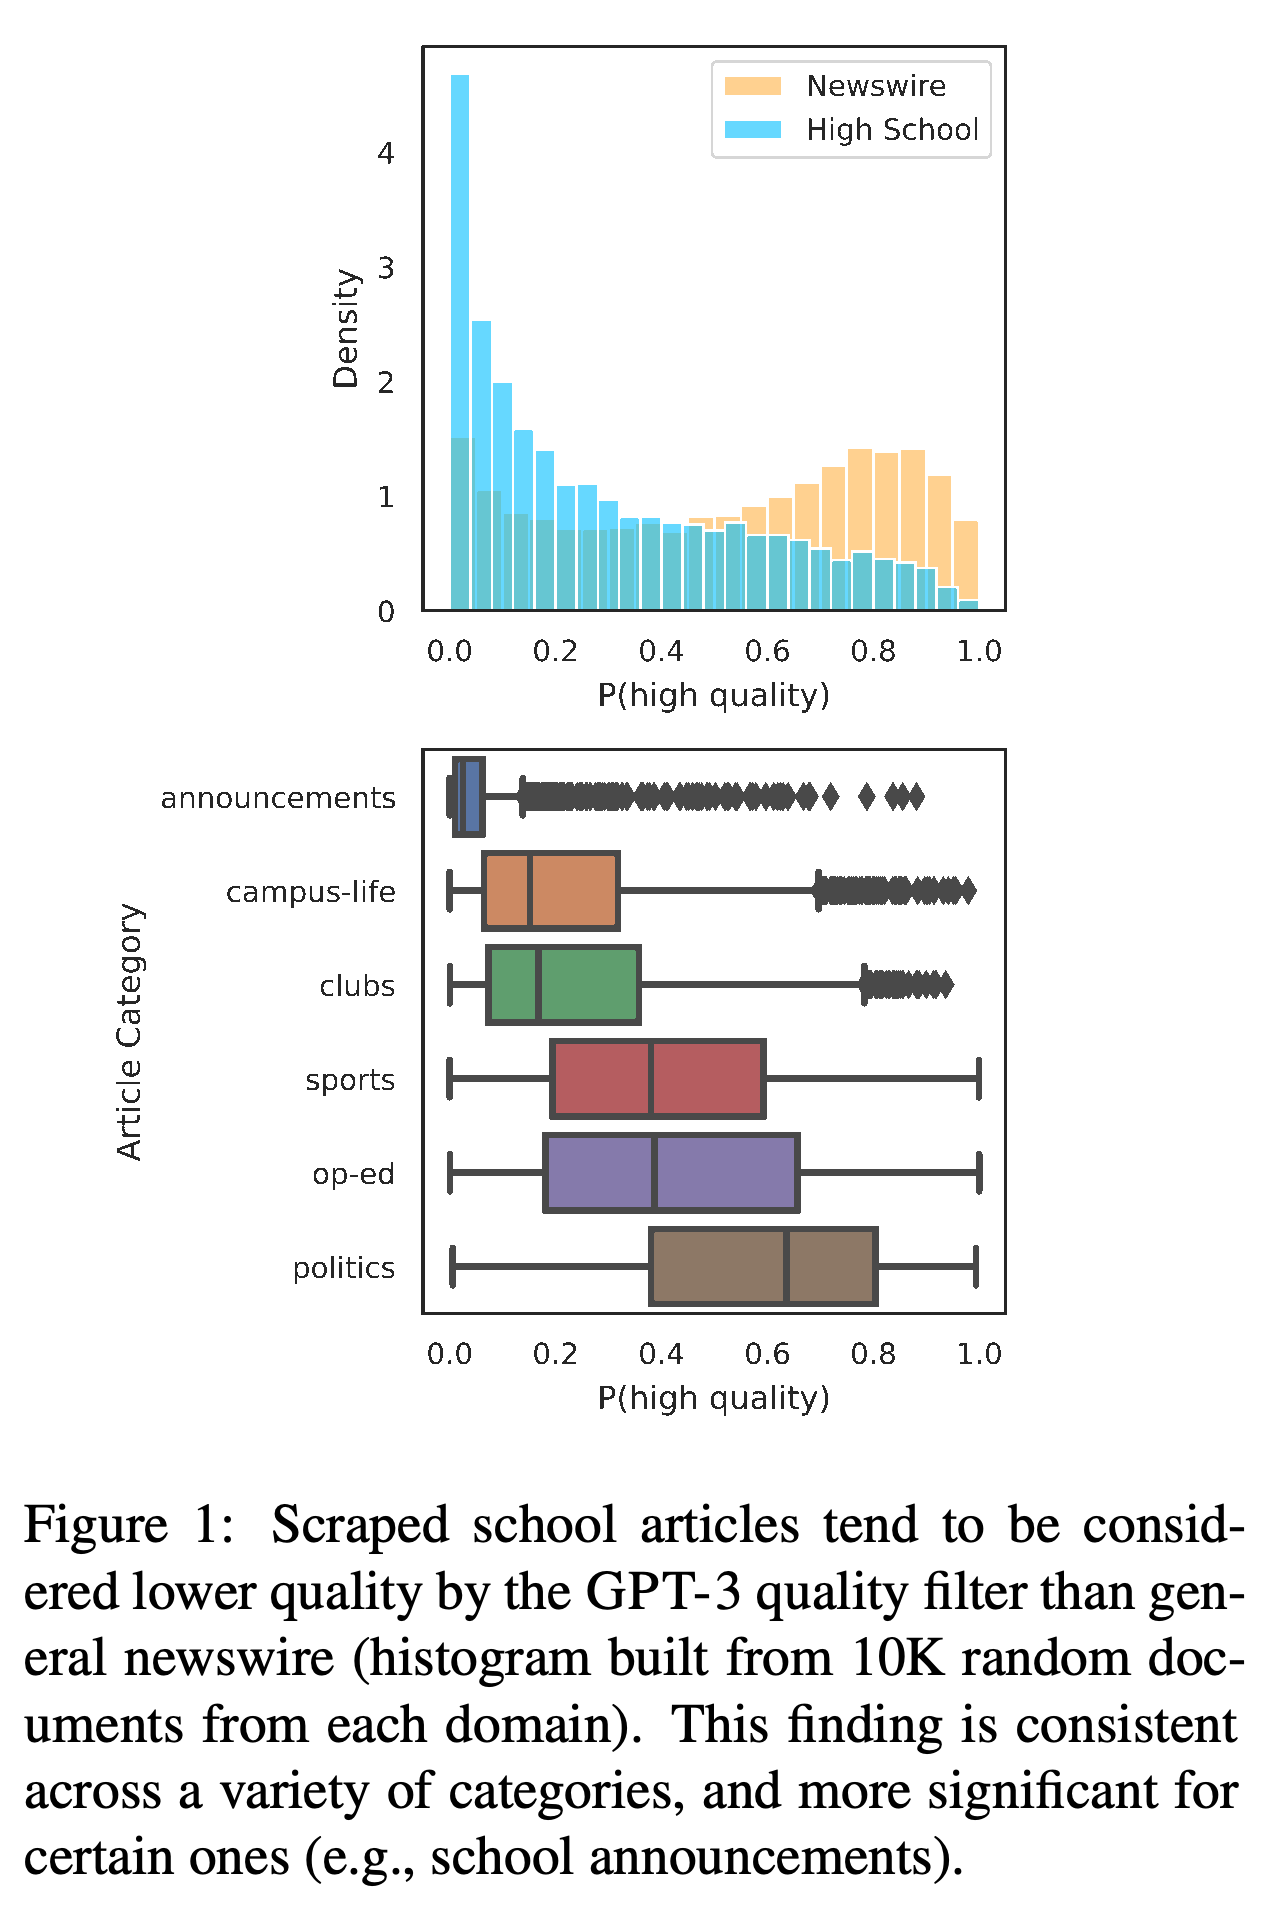
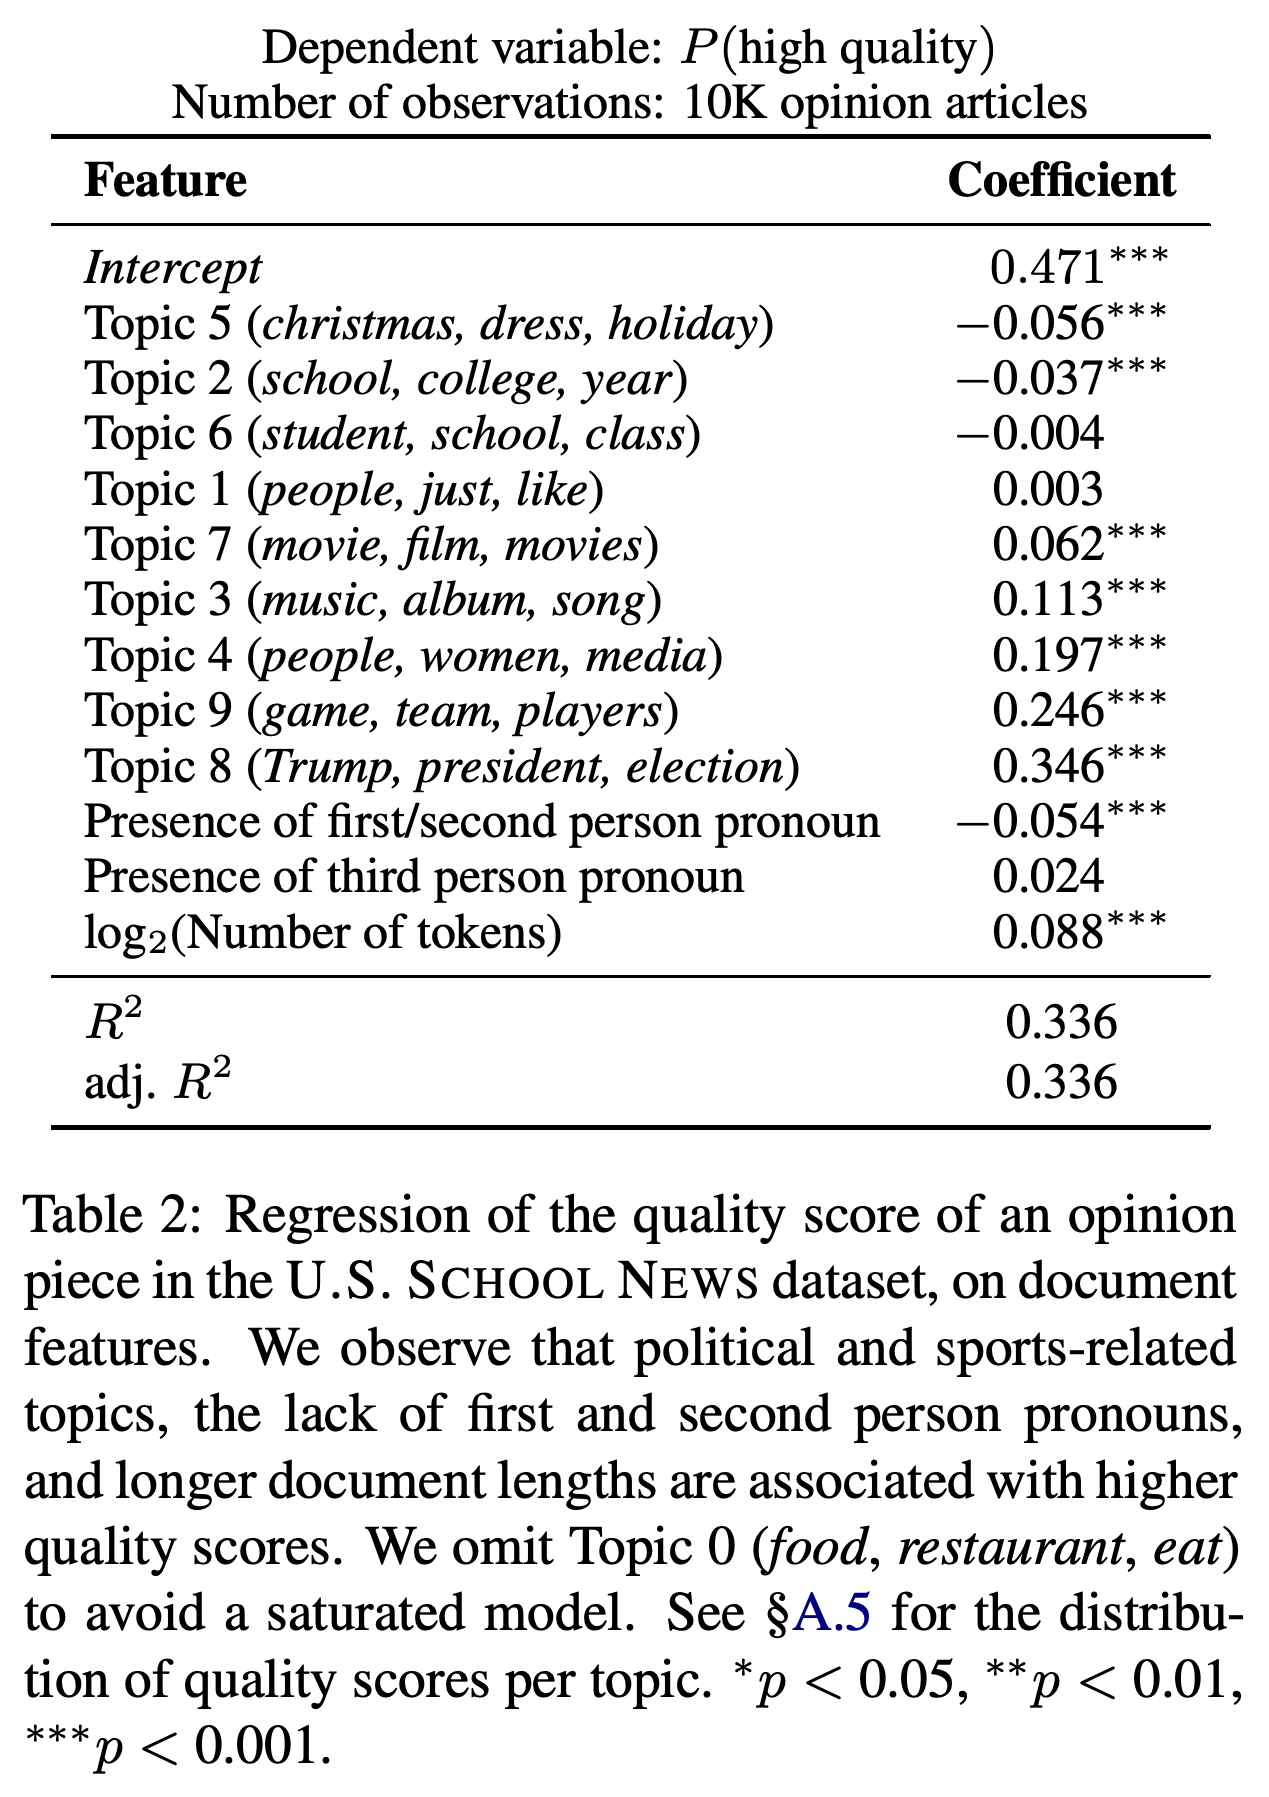
School articles generally receive lower scores than newswire articles, with especially low scores for announcements. In a regression on 10K opinion articles, election and sports topics have coefficients of 0.346 and 0.246 relative to the omitted food topic; first- or second-person pronouns have a coefficient of −0.054, and doubling token count corresponds to a 0.088 higher score, controlling for the other features.
The histogram compares 10K randomly sampled documents per domain, while the category plots show particularly low scores for school announcements and higher scores for politics.
The regression separates topic, pronoun, and length associations within opinion articles; its R² of 0.336 indicates that these features explain roughly one-third of score variation.
3.4 Demographic Analysis
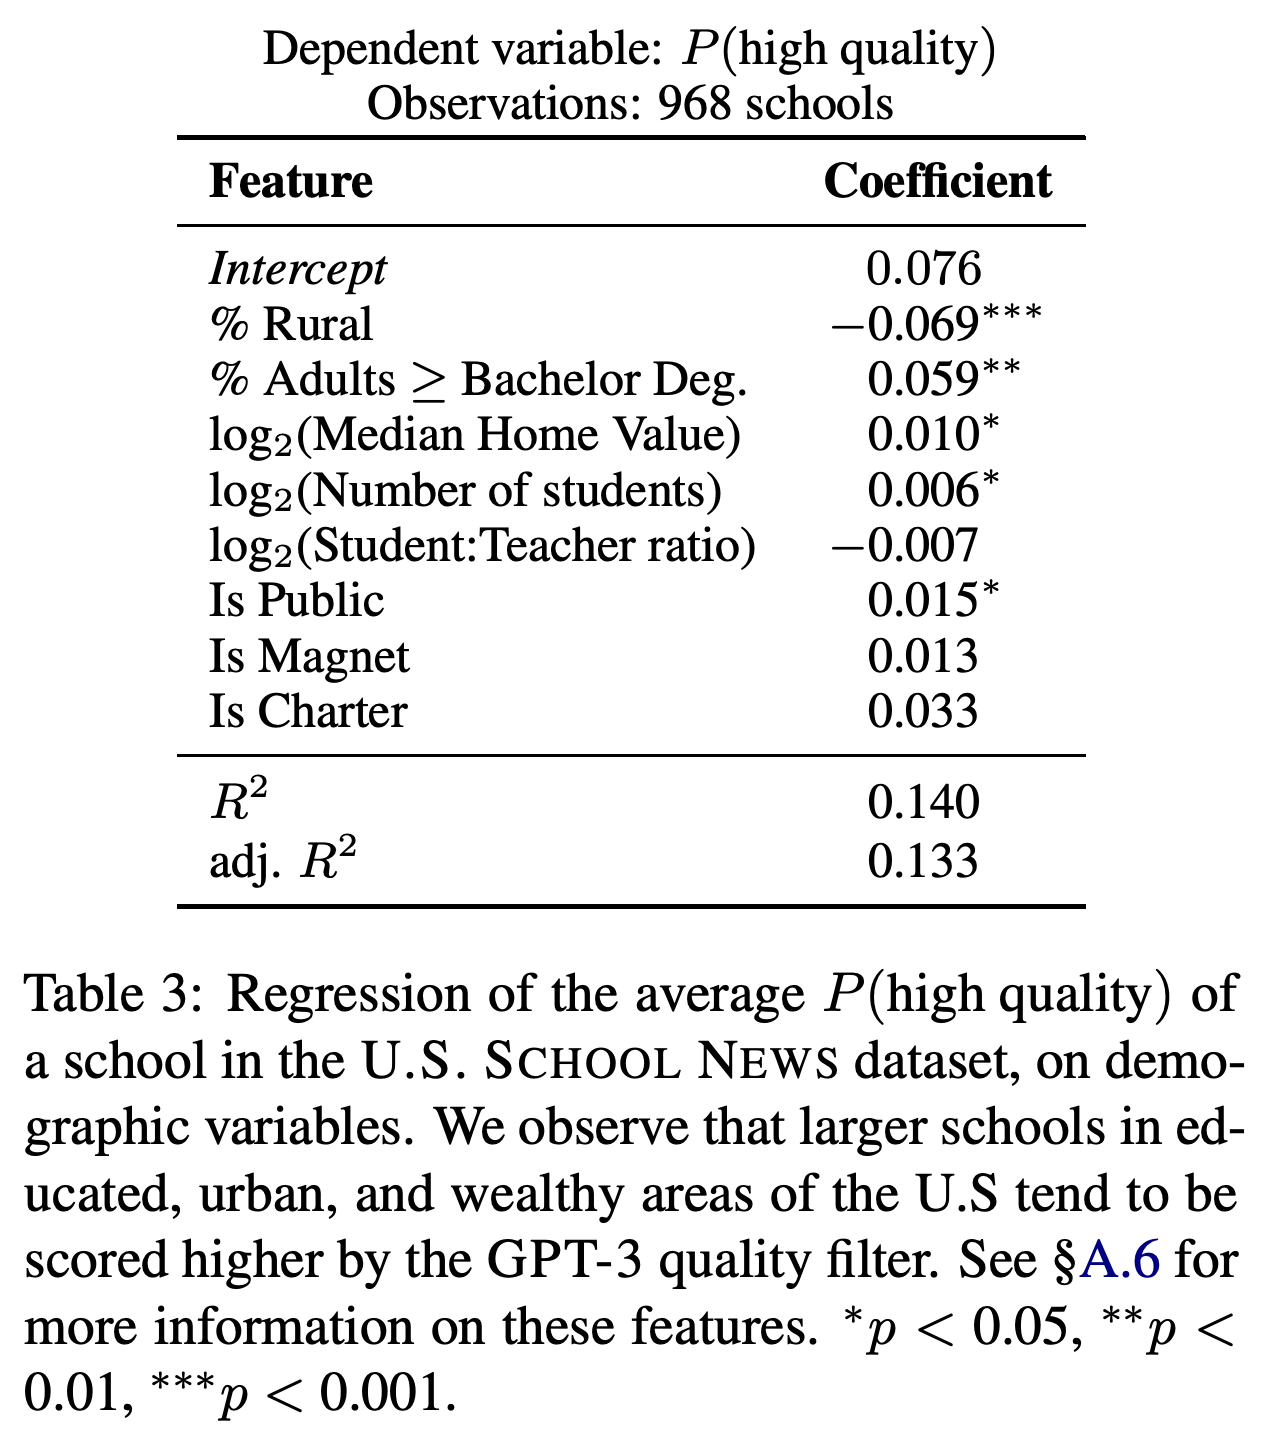
The school-level regression covers 968 schools in 926 ZIP codes and 354 counties, using school and Census characteristics. Urban population, adult education, home value, school size, and public school status have significant positive associations with average scores; the model’s R², the share of score variation explained, is 0.140.
Average school scores correlate positively with home value and adult education and negatively with Republican vote share and rural population; these are unadjusted relationships.
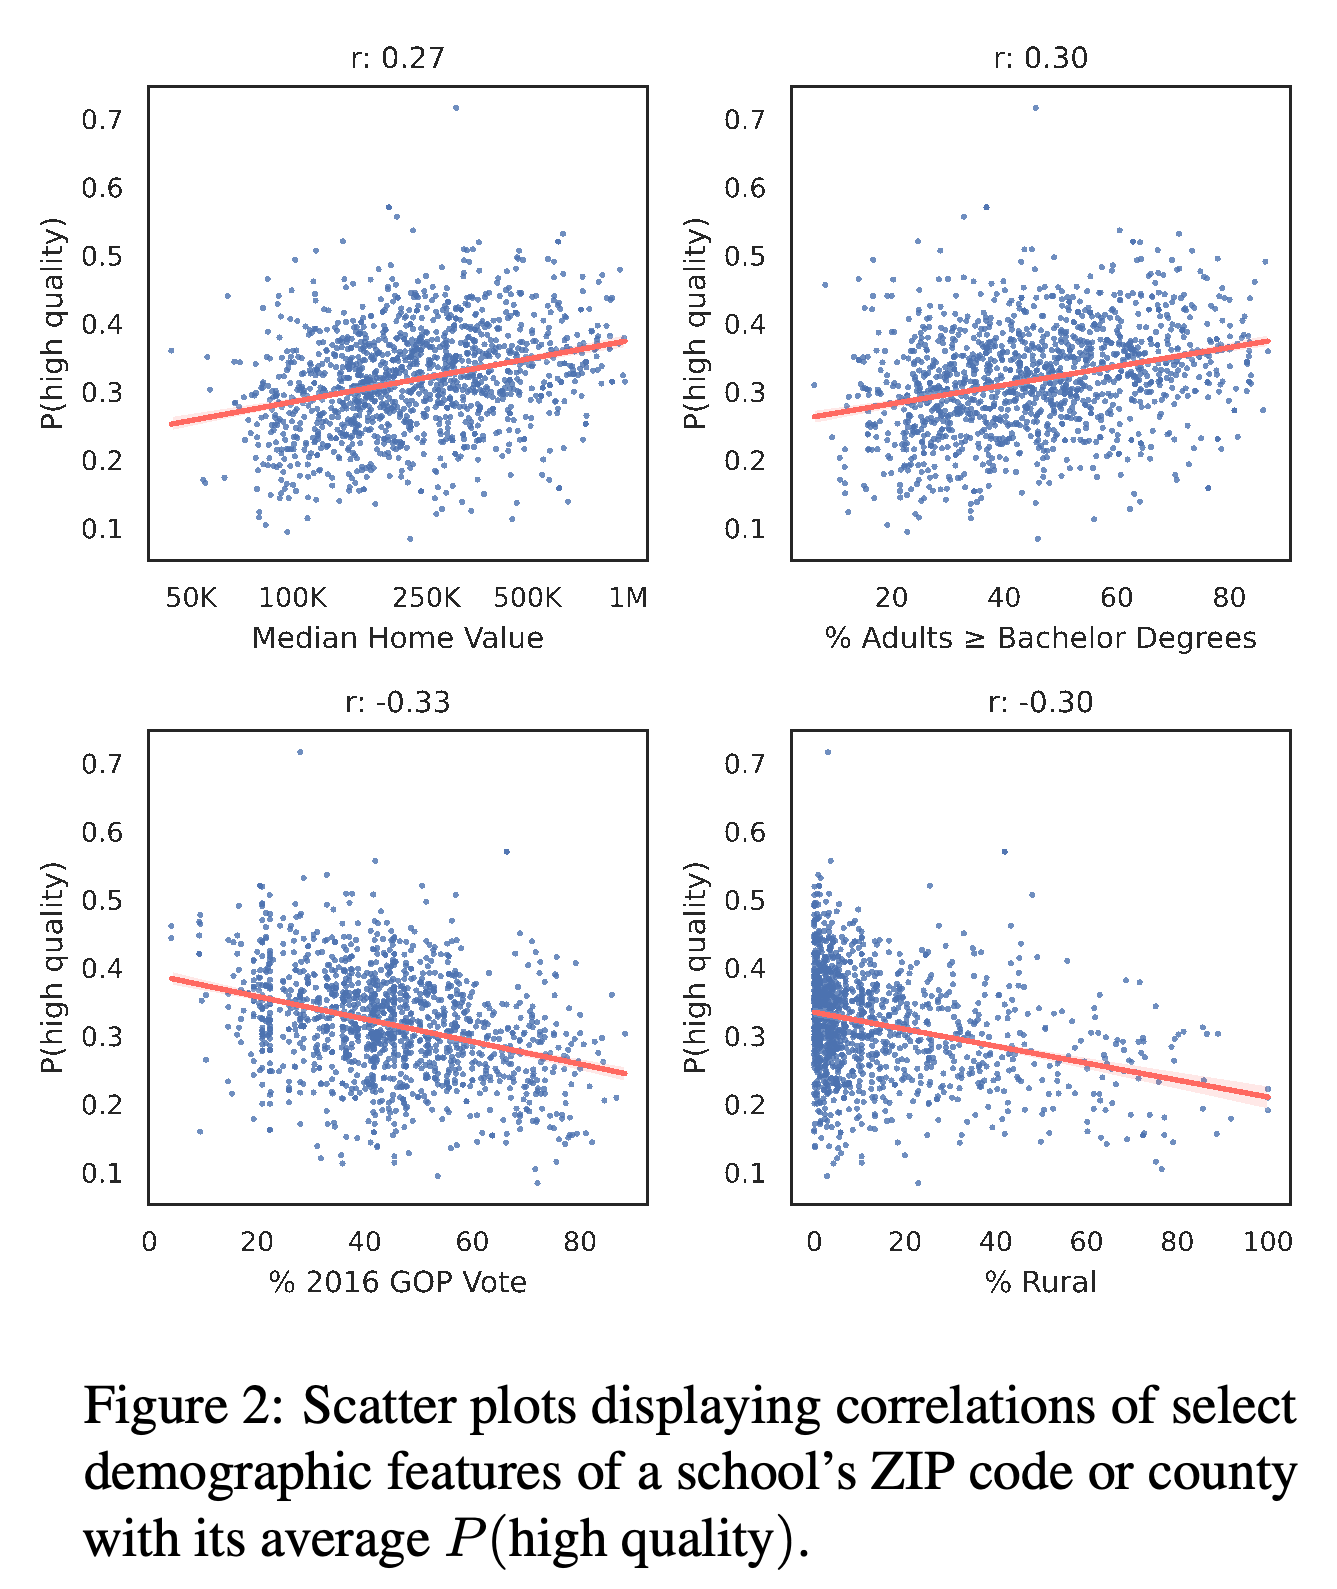
The adjusted rural coefficient is −0.069, and the public-school coefficient is 0.015; magnet status, charter status, and student-teacher ratio are not significant in this specification.
4 Alignment with Other Notions of Quality
The authors compare filter scores with three human-established standards: news-source factuality ratings, graded English proficiency essays, and Pulitzer Prizes. These standards also reflect institutional judgments and their own language ideologies.
4.1 Data
The comparison uses 9.9K articles from high-factuality outlets and 7.7K from low-factuality outlets, 12.1K Test Of English as a Foreign Language (TOEFL) essays with scores and prompts, and Pulitzer-winning books from Books3 and the Gutenberg corpus.
4.2 Results
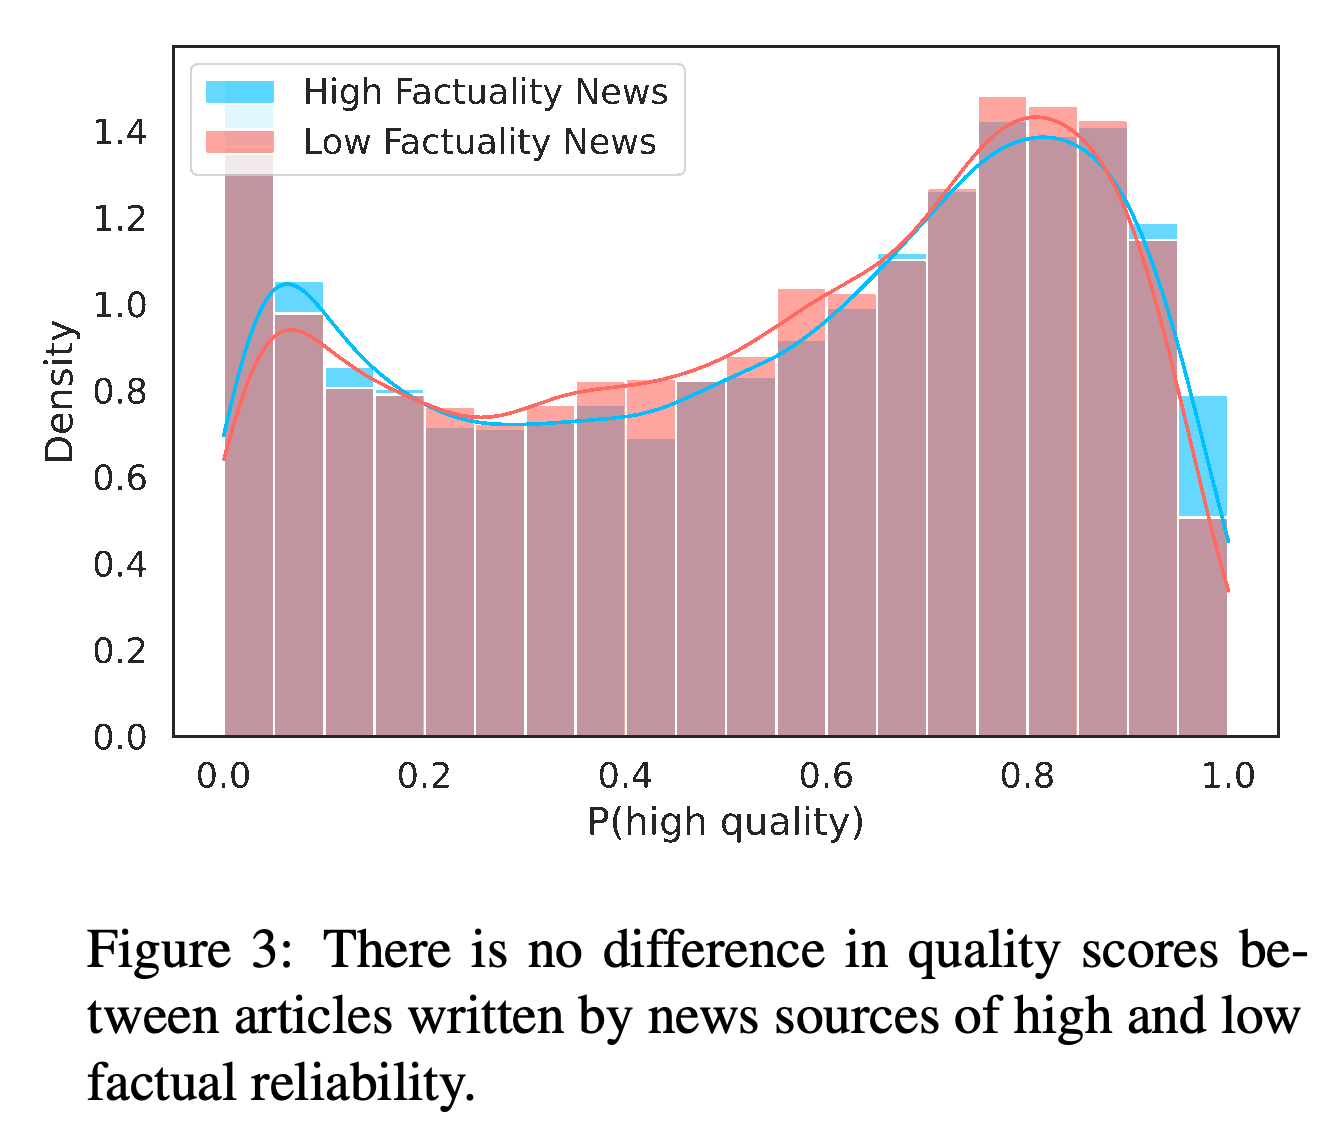
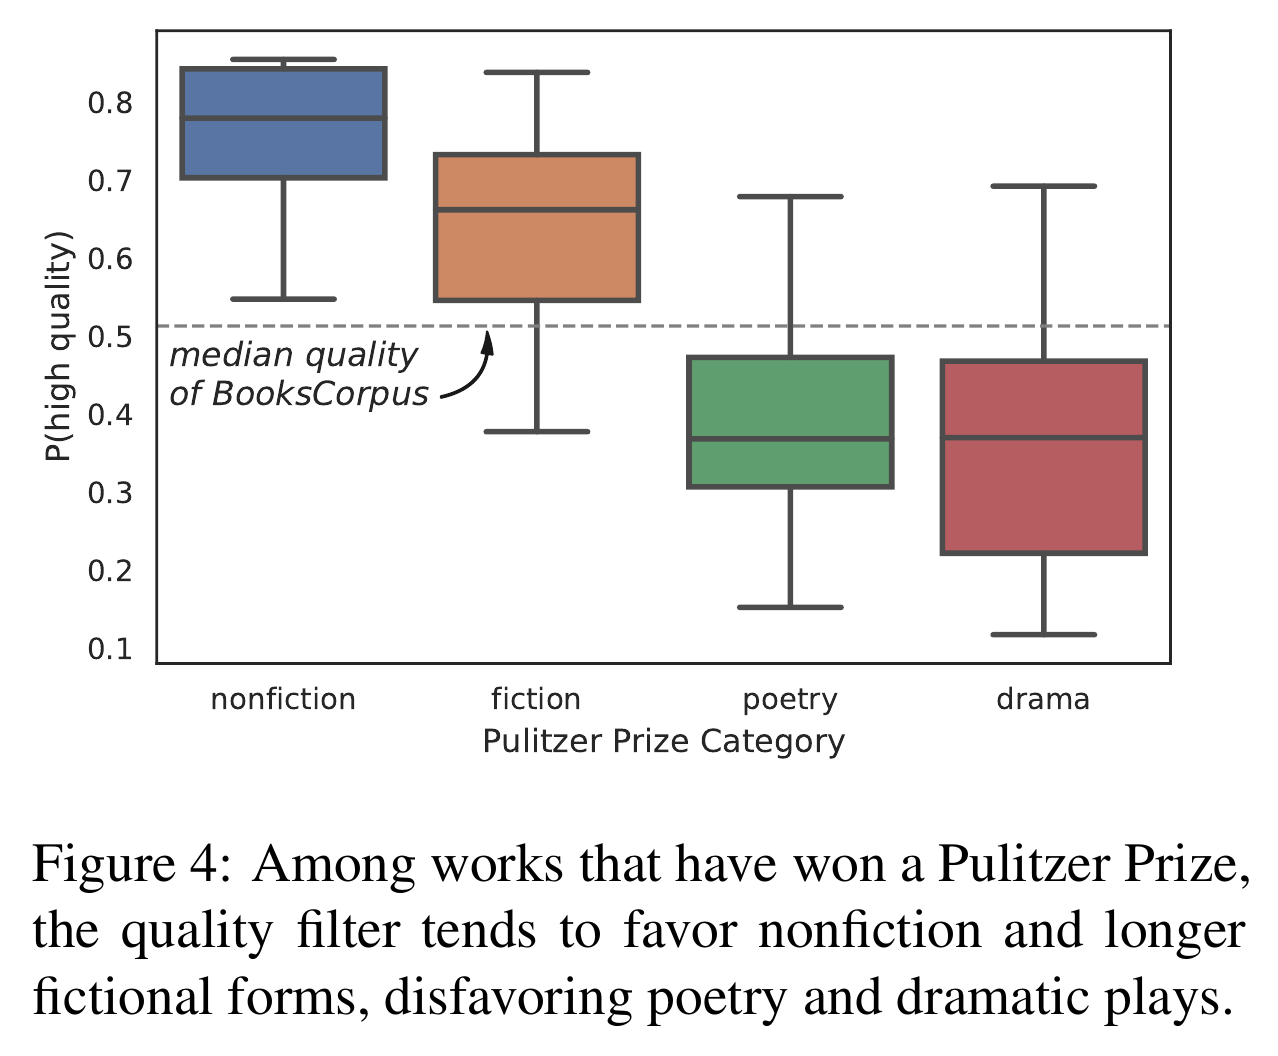
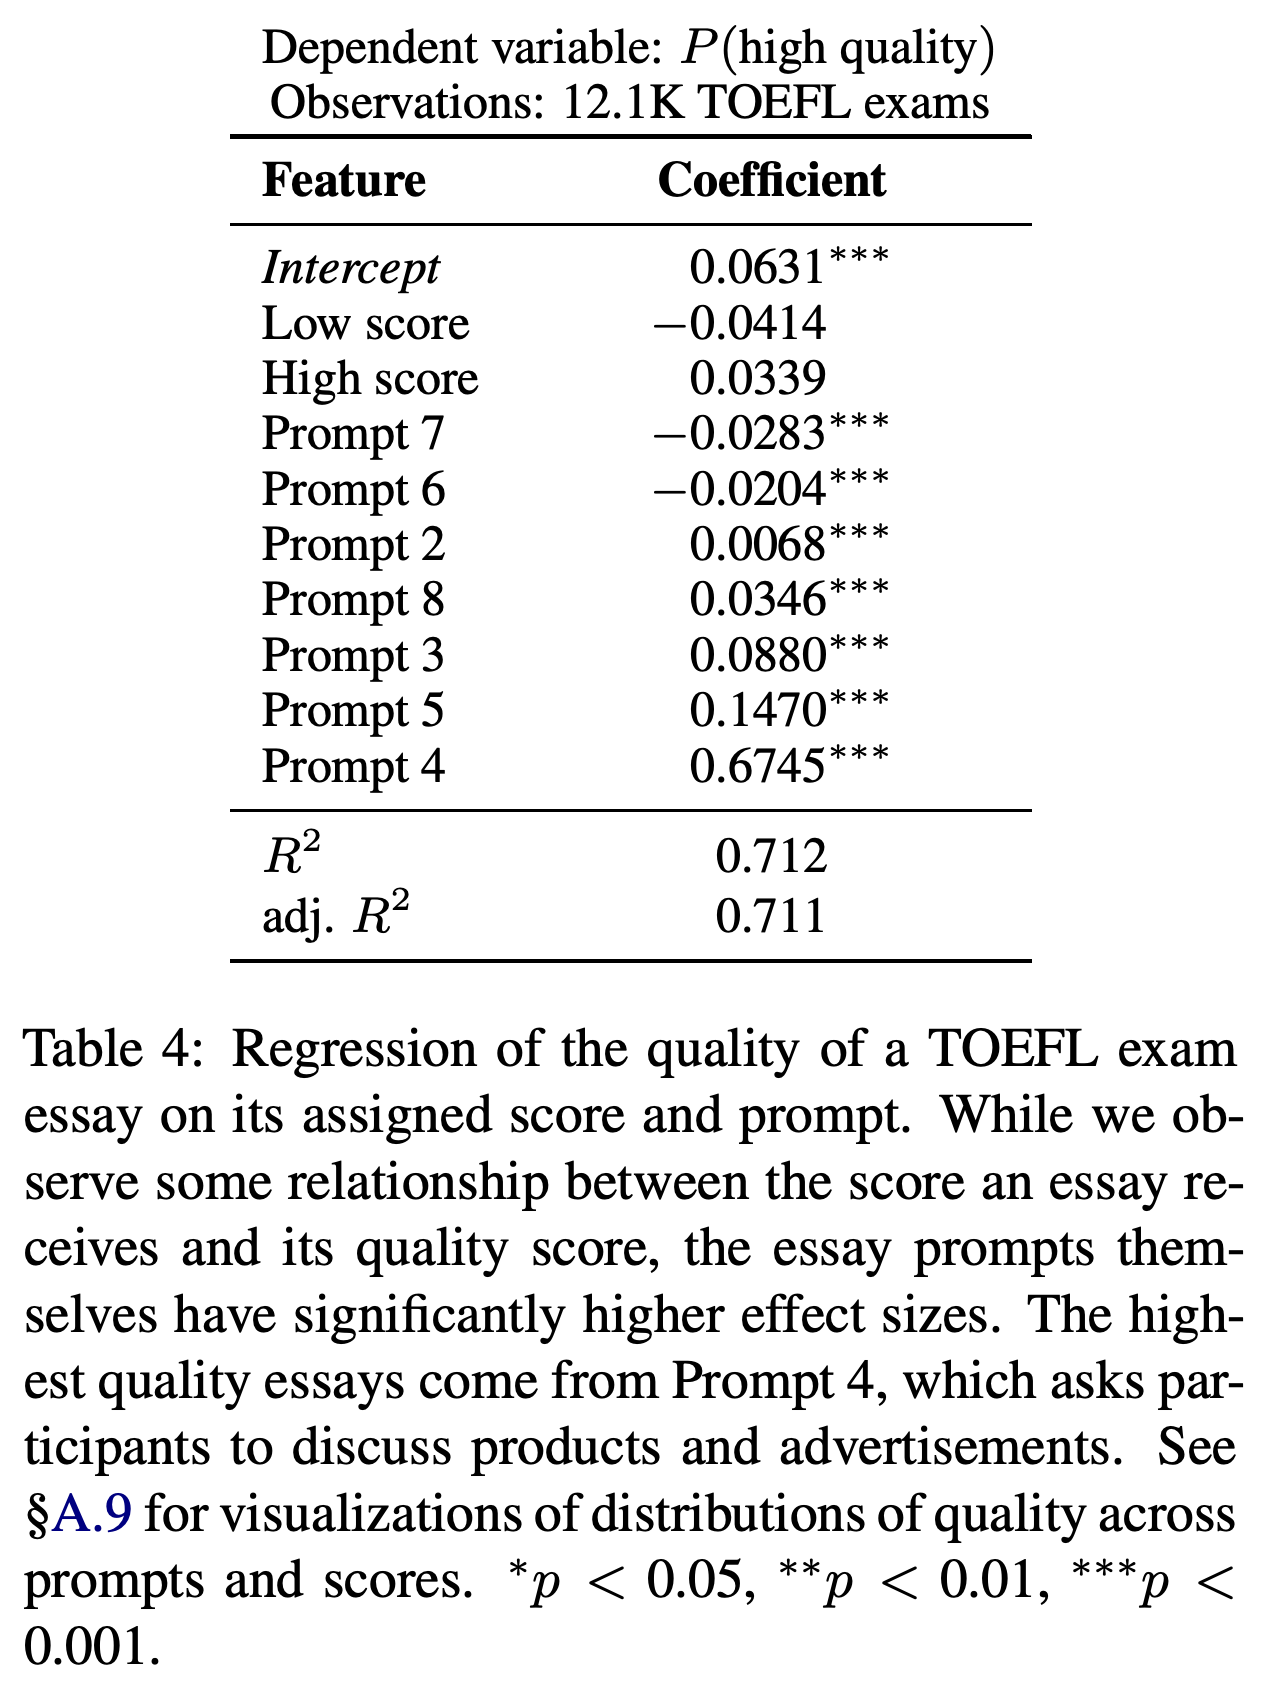
The news-score distributions do not differ significantly in the reported two-way Kolmogorov-Smirnov test, which compares distributions (p = 0.085). Essay grades correlate weakly with filter scores (Pearson r = 0.12, p < 0.001), while prompt effects are much larger; Pulitzer-winning poetry and drama receive lower scores than nonfiction and fiction.
The two score distributions largely overlap, consistent with the reported p = 0.085 test; this result does not establish that the distributions are identical.
Among Pulitzer winners, the displayed median scores for poetry and drama fall below the marked BookCorpus median, unlike those for nonfiction and fiction.
The coefficient for Prompt 4 is 0.6745, much larger than the coefficients for low and high essay scores, indicating strong prompt dependence in this regression.
5 Discussion
The authors propose documenting inclusion and exclusion criteria, testing the effects of filters, and deliberately collecting underrepresented perspectives and a wider range of genres. They argue that suitable training text depends on the intended application.
6 Ethical Considerations & Limitations
The sample depends on a publication template and archived online content and may miss both the least-resourced and wealthiest schools. ZIP codes and counties are imperfect proxies for school circumstances, and the authors did not seek consent to scrape articles; because many authors are minors, they release school-level demographic variables and scores but not the article corpus.
7 Related Work
The paper relates its analysis to sociolinguistic research on language discrimination, critiques of web data collection, and evidence that other filters can disproportionately exclude minority-group language (Dodge et al., 2021). It cites downstream disparities as motivation for further analysis without establishing a causal link from this filter to model behavior.
8 Conclusion
The authors conclude that using Wikipedia, news, books, and popular Internet content as positive references favors some school communities in this evaluation. They recommend documenting curation and possible exclusions while seeking a broader range of authors, genres, and styles.
Appendix
- A.1–A.6 list training corpora, provide the U.S. School News datasheet at https://bit.ly/3rLrmwV, and document filter settings, example articles, topic scores, and demographic features. The selected filter uses L1 regularization, liblinear, whitespace tokenization, hashing, and unigram and bigram features.
- A.7 reports alternative regressions: adding racial composition makes home value nonsignificant, while adding 2016 Republican vote share makes both home value and rural population nonsignificant. A.8–A.9 provide examples of low-factuality articles receiving high scores and further TOEFL prompt and score comparisons.
Brief Thoughts
The classifier’s source-discrimination performance and its weak alignment with other quality measures show that its scores reflect the selected reference sources. The demographic regressions support associations within this sample, but their modest explanatory power and area-level proxies leave individual-level and causal interpretations unresolved.