Stronger Normalization-Free Transformers | Summary
11 Dec 2025 | Paper Review Normalization Transformer Architectures Normalization-Free TrainingContents
This article explains the key points of Stronger Normalization-Free Transformers.
- 2025-12-11 (arXiv)
- Chen, Mingzhi, Lu, Taiming, Zhu, Jiachen, Sun, Mingjie, Liu, Zhuang.
- Princeton University, New York University, Carnegie Mellon University
- Paper
- Github
Summary
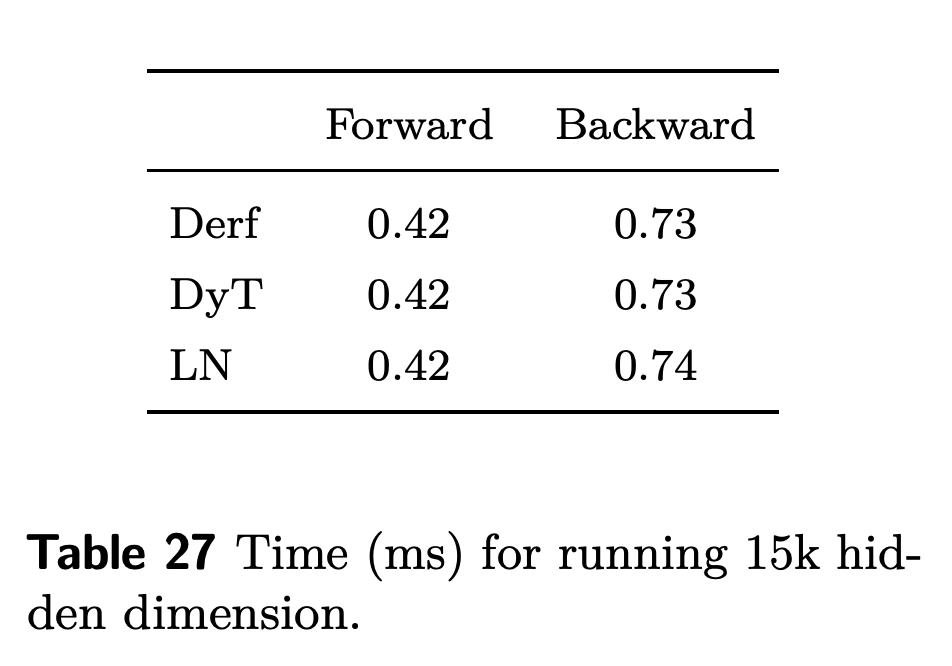
- Transformer normalization layers rescale activations using computed statistics; this paper asks whether a point-wise function, which transforms each activation independently, can replace them and improve performance. Under the reported ImageNet-1K image-classification setup, Dynamic erf (Derf), a learned transformation based on the Gaussian error function, reaches 82.8% top-1 accuracy—the fraction of examples whose highest-scoring prediction is correct—with Vision Transformer Base (ViT-Base), compared with 82.3% for LayerNorm, which normalizes each token across its feature channels, and 82.5% for Dynamic Tanh (DyT), a learned hyperbolic-tangent replacement.
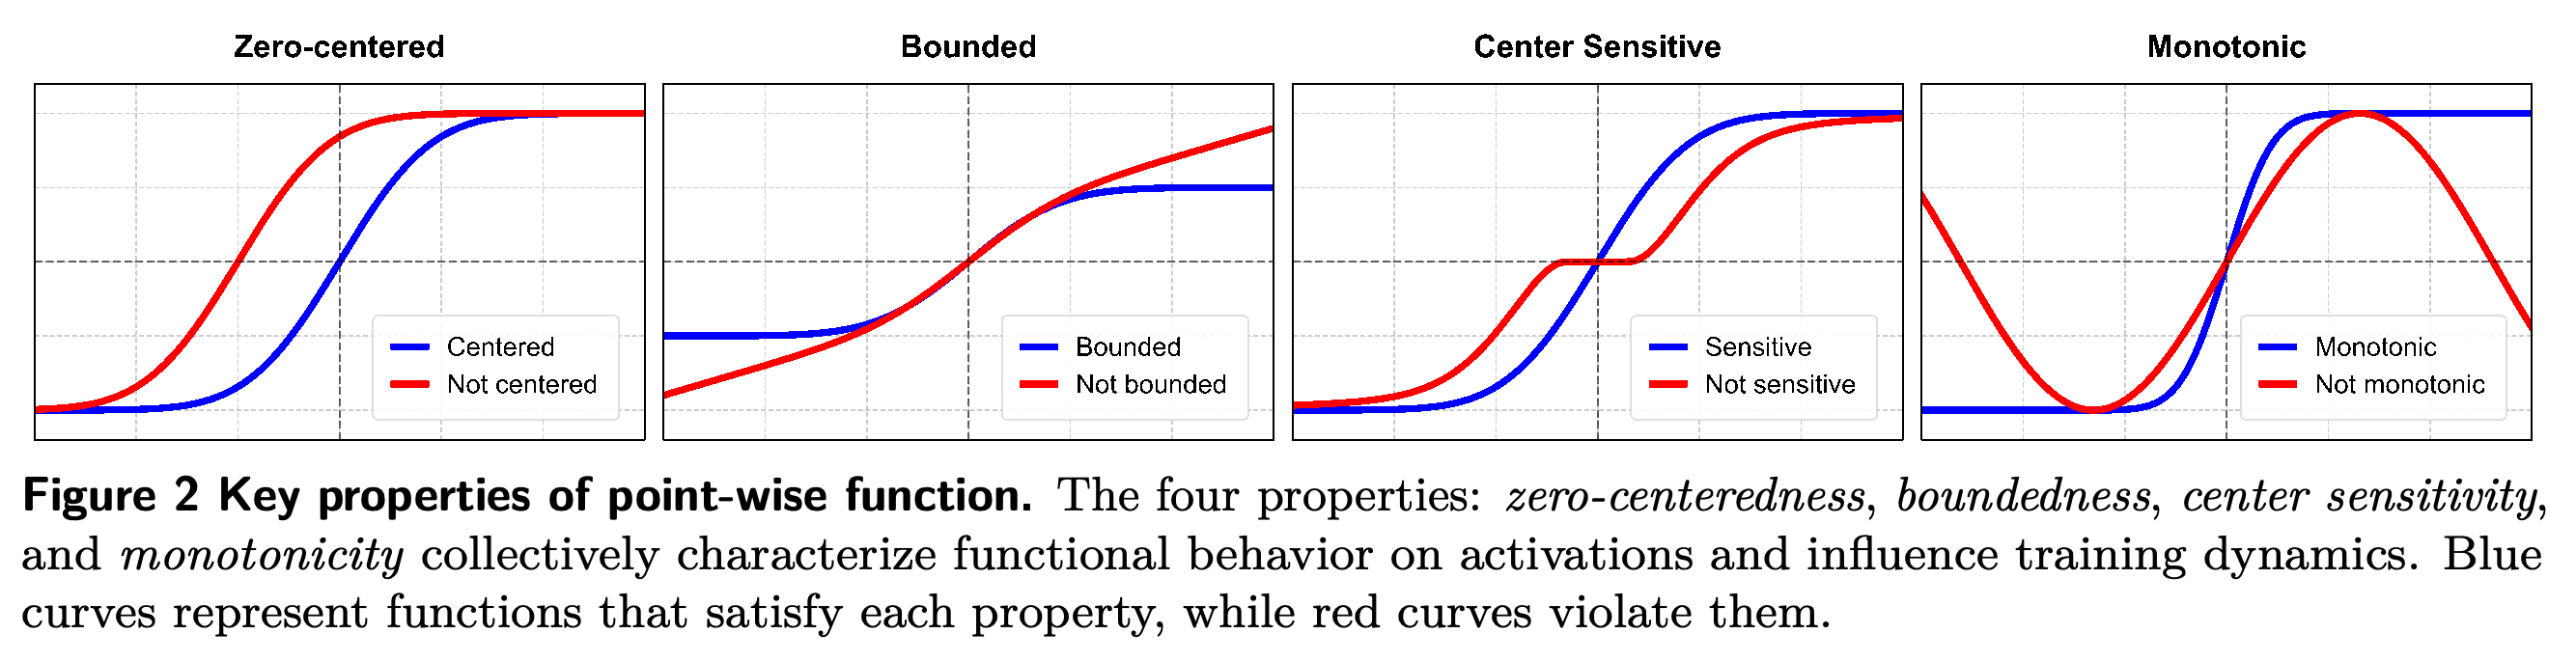
- Controlled ViT-Base experiments examine four properties: zero-centeredness, outputs balanced around zero; boundedness, a finite output range; center sensitivity, responsiveness near zero; and monotonicity, a consistently increasing or decreasing mapping. A search over 16 candidate functions selects erf, the bounded S-shaped error function, and Derf adds learned input scale and shift plus per-channel output scale and bias.
- Derf improves image generation, speech pretraining loss, and genomic classification in the reported settings, while matching LayerNorm’s 2.94 validation loss for GPT-2 (124M), a language model with 124 million parameters, on the OpenWebText text dataset. Higher training-set loss measured after training in evaluation mode supports the authors’ generalization hypothesis, but does not establish the proposed mechanism. The language result, retained speech normalization layers, and model-specific initialization changes qualify the replacement claim.
LayerNorm combines channels to compute statistics, whereas DyT and Derf transform individual elements. The selected classification, generation, and genomic results show improvements with Derf; the later language experiment reports parity with LayerNorm.
1 Introduction
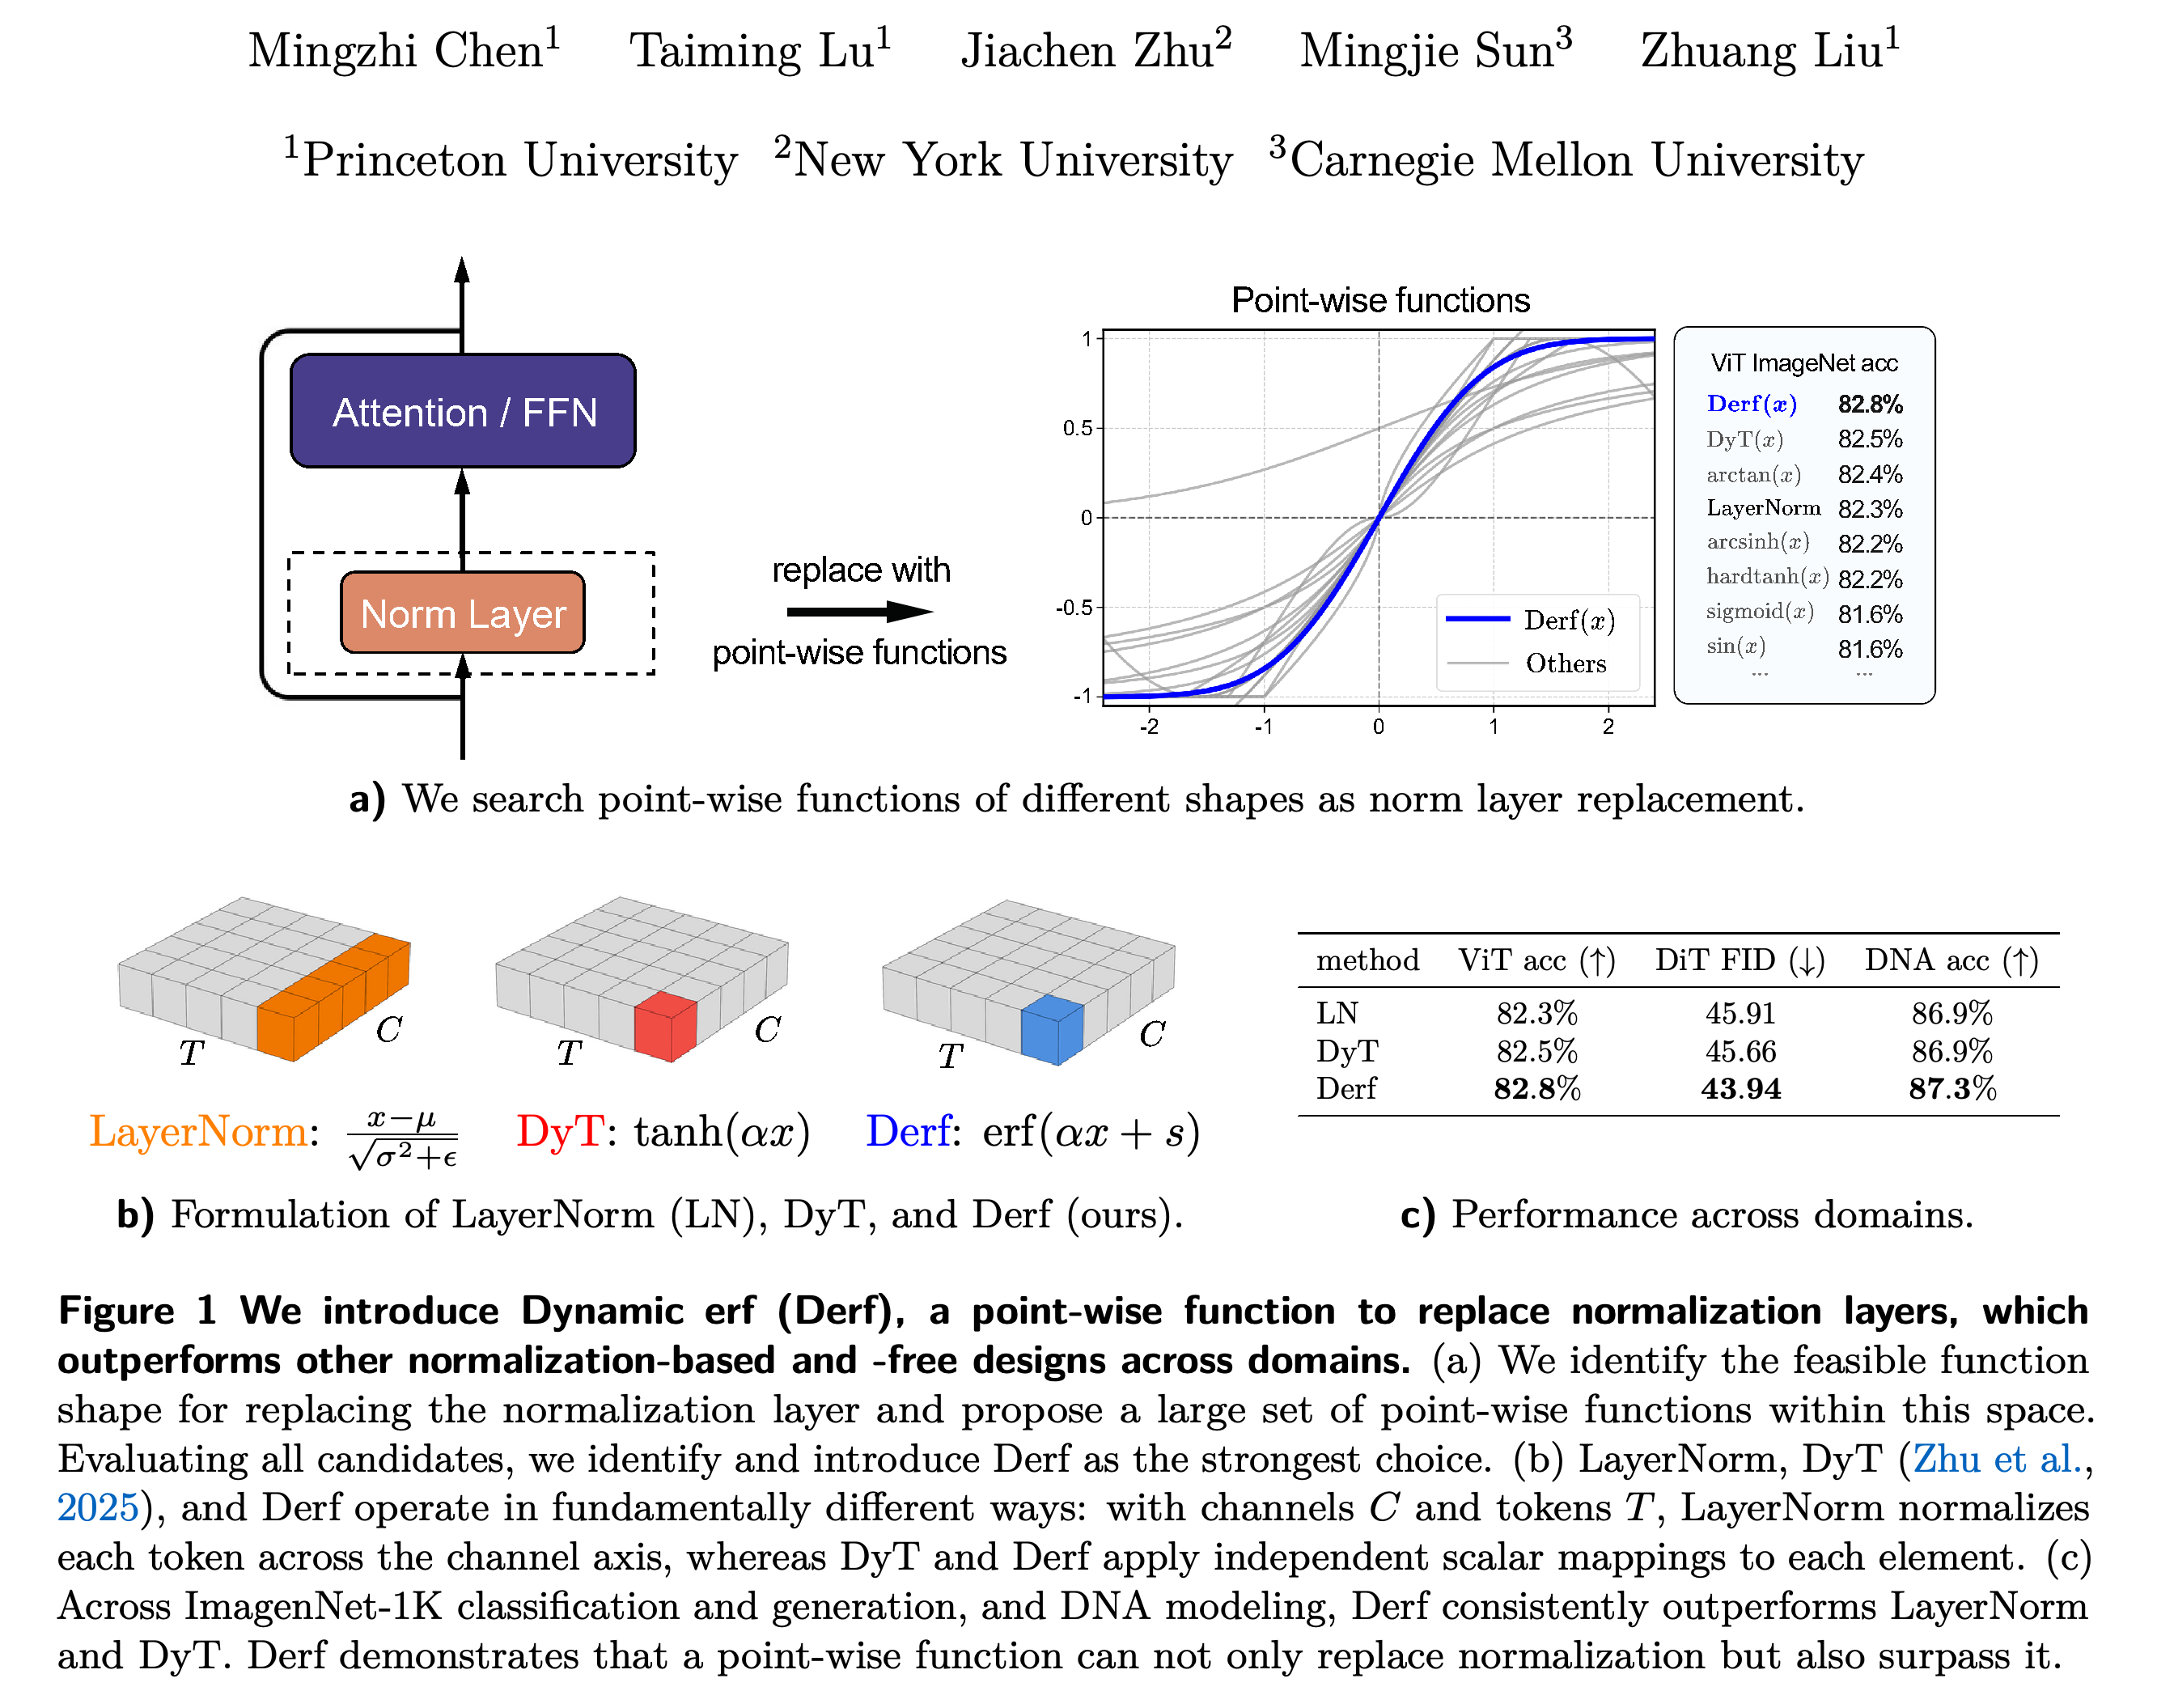
The paper motivates statistics-free replacements through normalization’s memory-access and synchronization overhead and the batch-size sensitivity of some normalization methods. It extends DyT by examining which function shapes support stable training, searching within that space, and testing the selected function across supervised learning from labeled examples and self-supervised learning from objectives derived from the data.
2 Background
LayerNorm computes a separate mean and variance across the feature channels of each token, an individual sequence element, and applies learned output scale and bias. A point-wise replacement applies a learned mapping independently to each activation without computing batch, token, or channel statistics; DyT uses DyT(x) = γ * tanh(αx) + β, where α is the learned input scale and γ and β are output scale and bias. The background also introduces Root Mean Square Normalization (RMSNorm), a normalization alternative based on root-mean-square magnitude.
3 Function Property Analysis
The property analysis replaces normalization layers with \(y=\gamma\cdot f(\alpha x)+\beta\) and modifies tanh, the hyperbolic tangent, erf, and arctan, the inverse tangent, through controlled transformations. All these experiments use ViT-Base and report ImageNet-1K top-1 accuracy, so the resulting design principles are empirical findings under this architecture and training setup.
Each panel contrasts a function satisfying one proposed property with a function violating it. The curves define the shape changes examined experimentally without establishing that any property is necessary.
3.1 Zero-centeredness
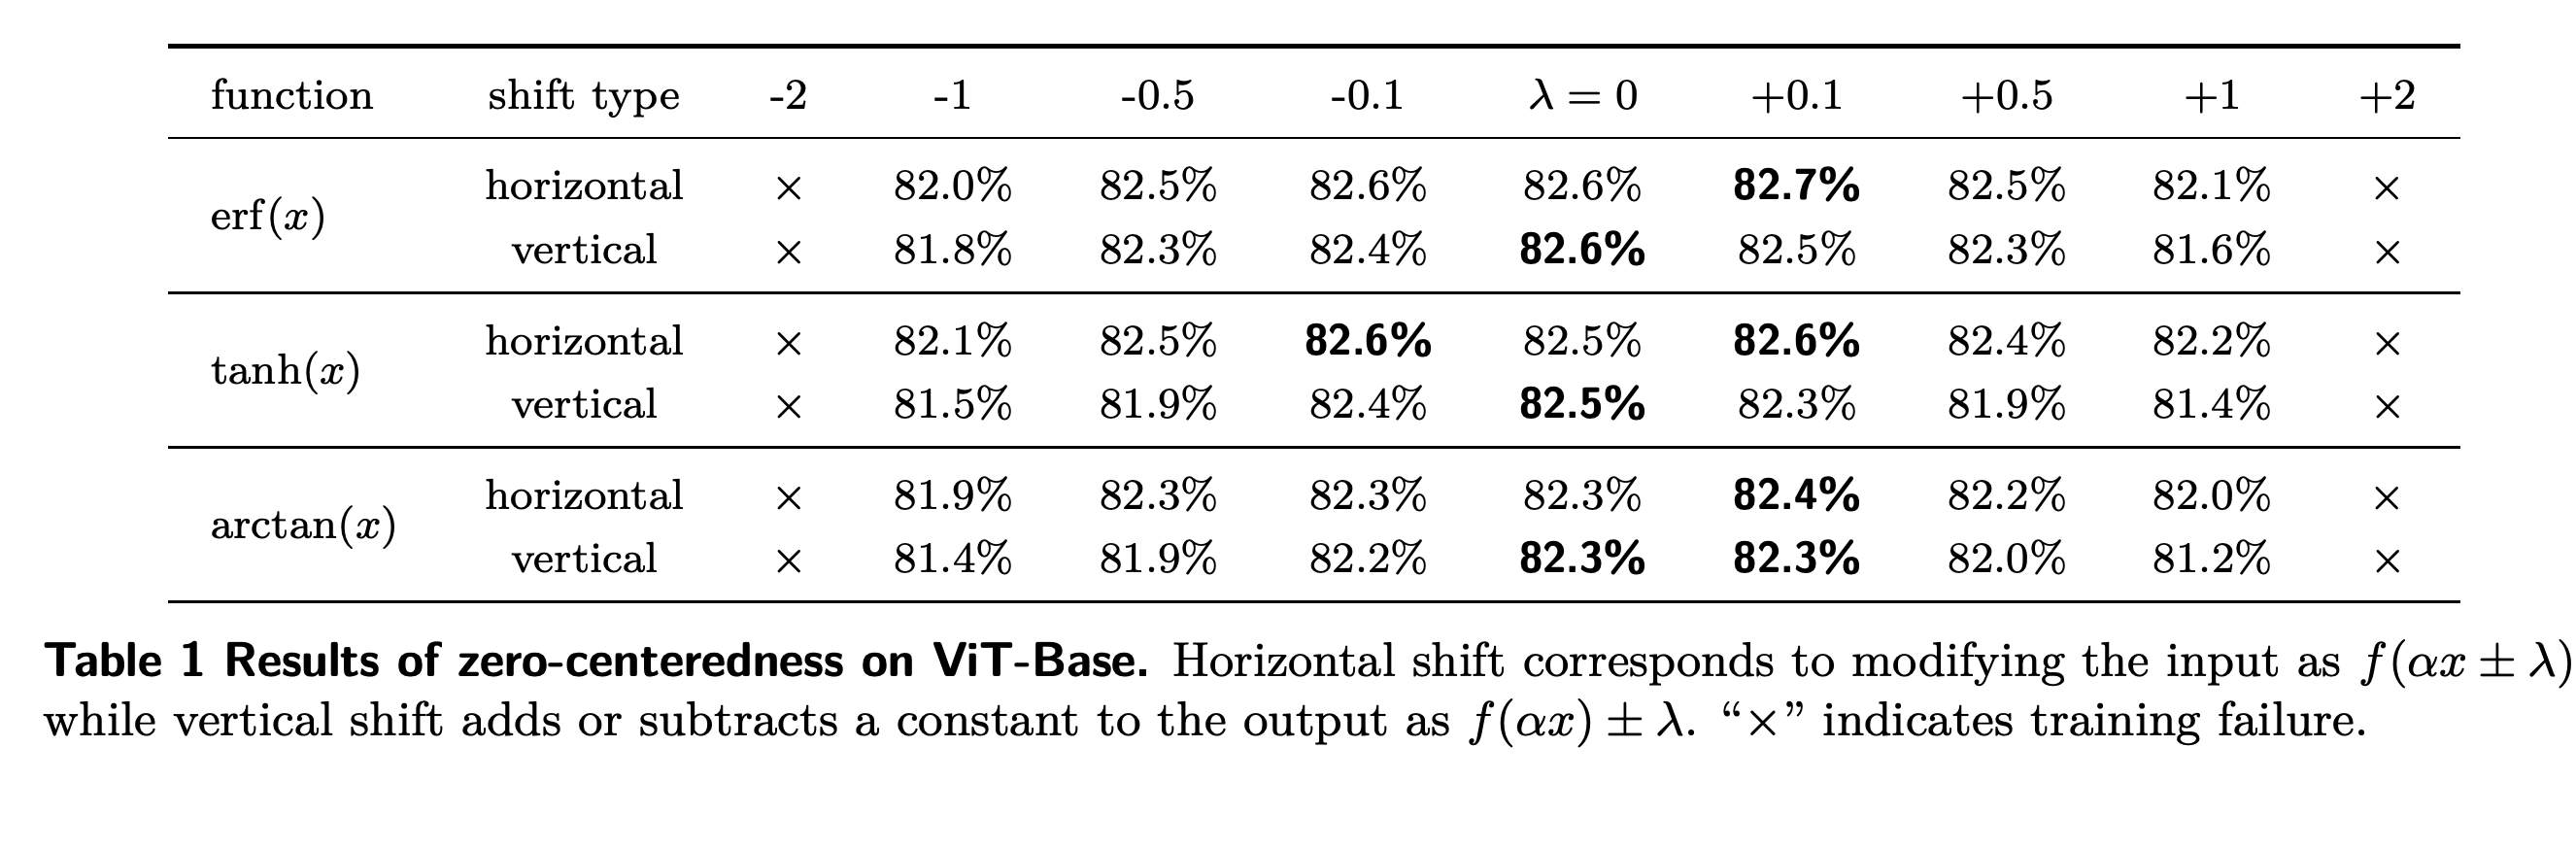
Horizontal shifts modify the function’s input, and vertical shifts add a constant to its output; Table 1 reports shifts from −2 to +2, including ±0.1 and ±0.5. Small horizontal shifts preserve accuracy, with erf reaching 82.7% at +0.1 versus 82.6% without a shift, whereas larger horizontal or vertical shifts reduce accuracy and all tested functions fail at ±2. These results favor approximate centering without establishing an exact zero-centeredness requirement.
Small horizontal displacements preserve the base functions' accuracy, including 82.7% for erf at +0.1. Failures at both −2 and +2 and declining accuracy under larger vertical shifts support avoiding large departures from approximate centering.
3.2 Boundedness
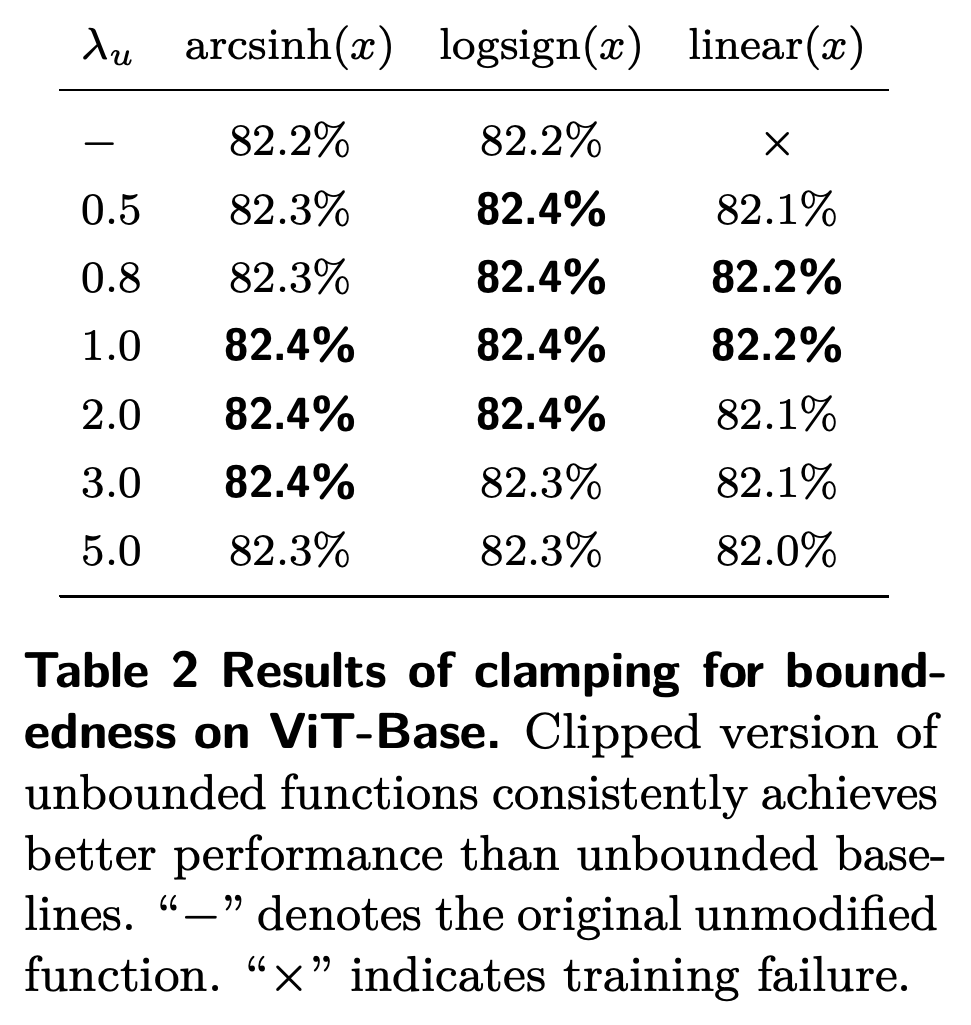
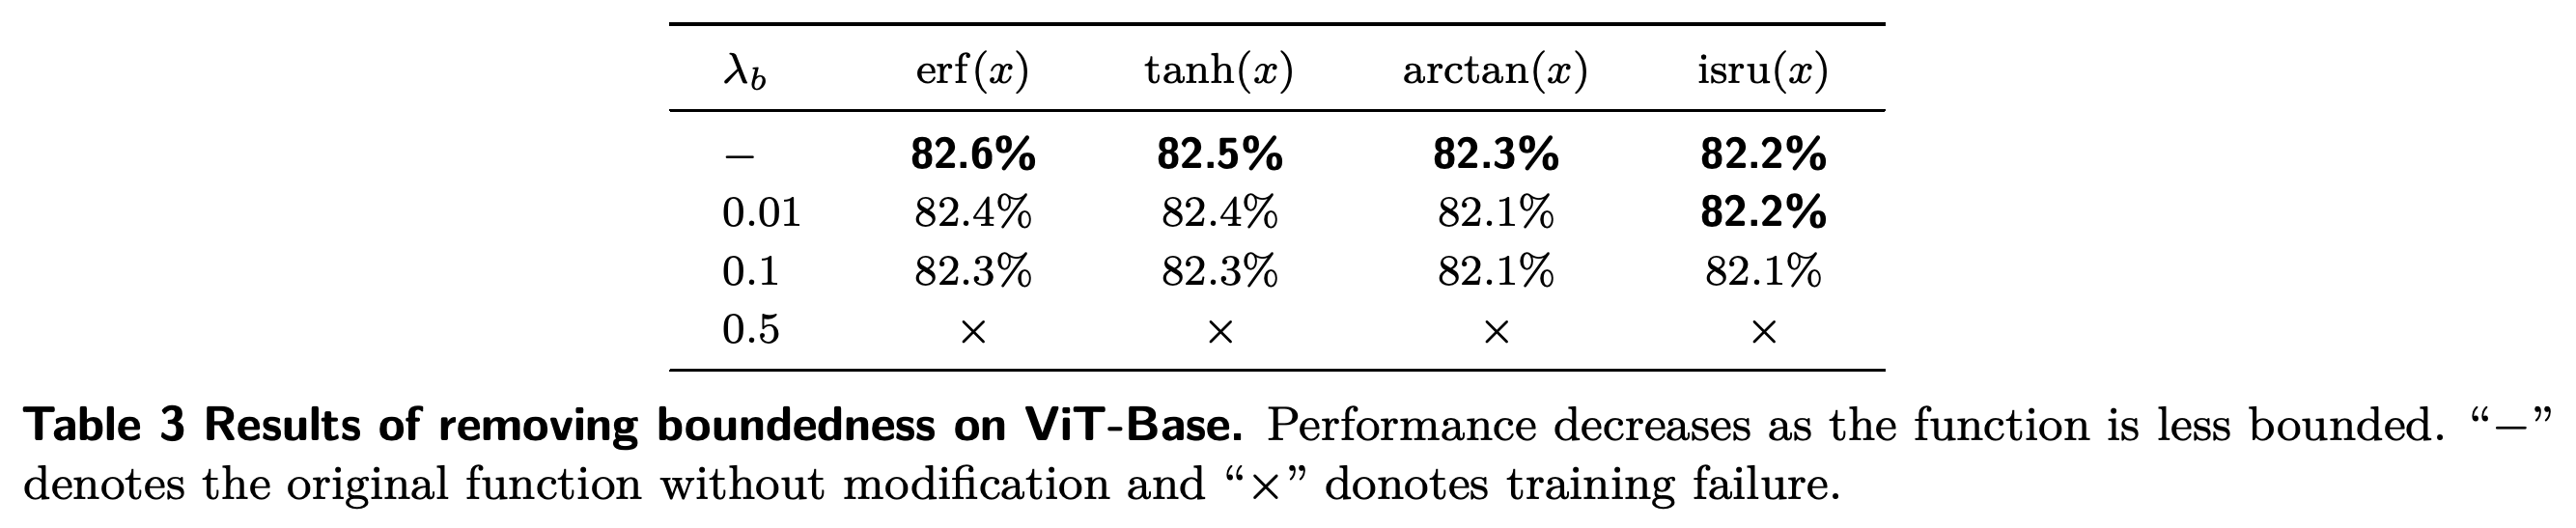
Clipping unbounded functions, which limits their outputs to a specified interval, at λu ∈ {0.5, 0.8, 1.0, 2.0, 3.0, 5.0} improves arcsinh, the inverse hyperbolic sine, and logsign, a signed logarithmic function, over their 82.2% baselines and makes linear functions train successfully. Adding a linear component to bounded functions at λb ∈ {0.01, 0.1, 0.5} generally reduces accuracy, with every tested function failing at 0.5. Among the tested unbounded functions, logquad, a signed logarithm of x² + 1, still converges at 82.1%, while power23, the signed two-thirds-power function, and linear fail; boundedness therefore helps but is not necessary for convergence in this setup.
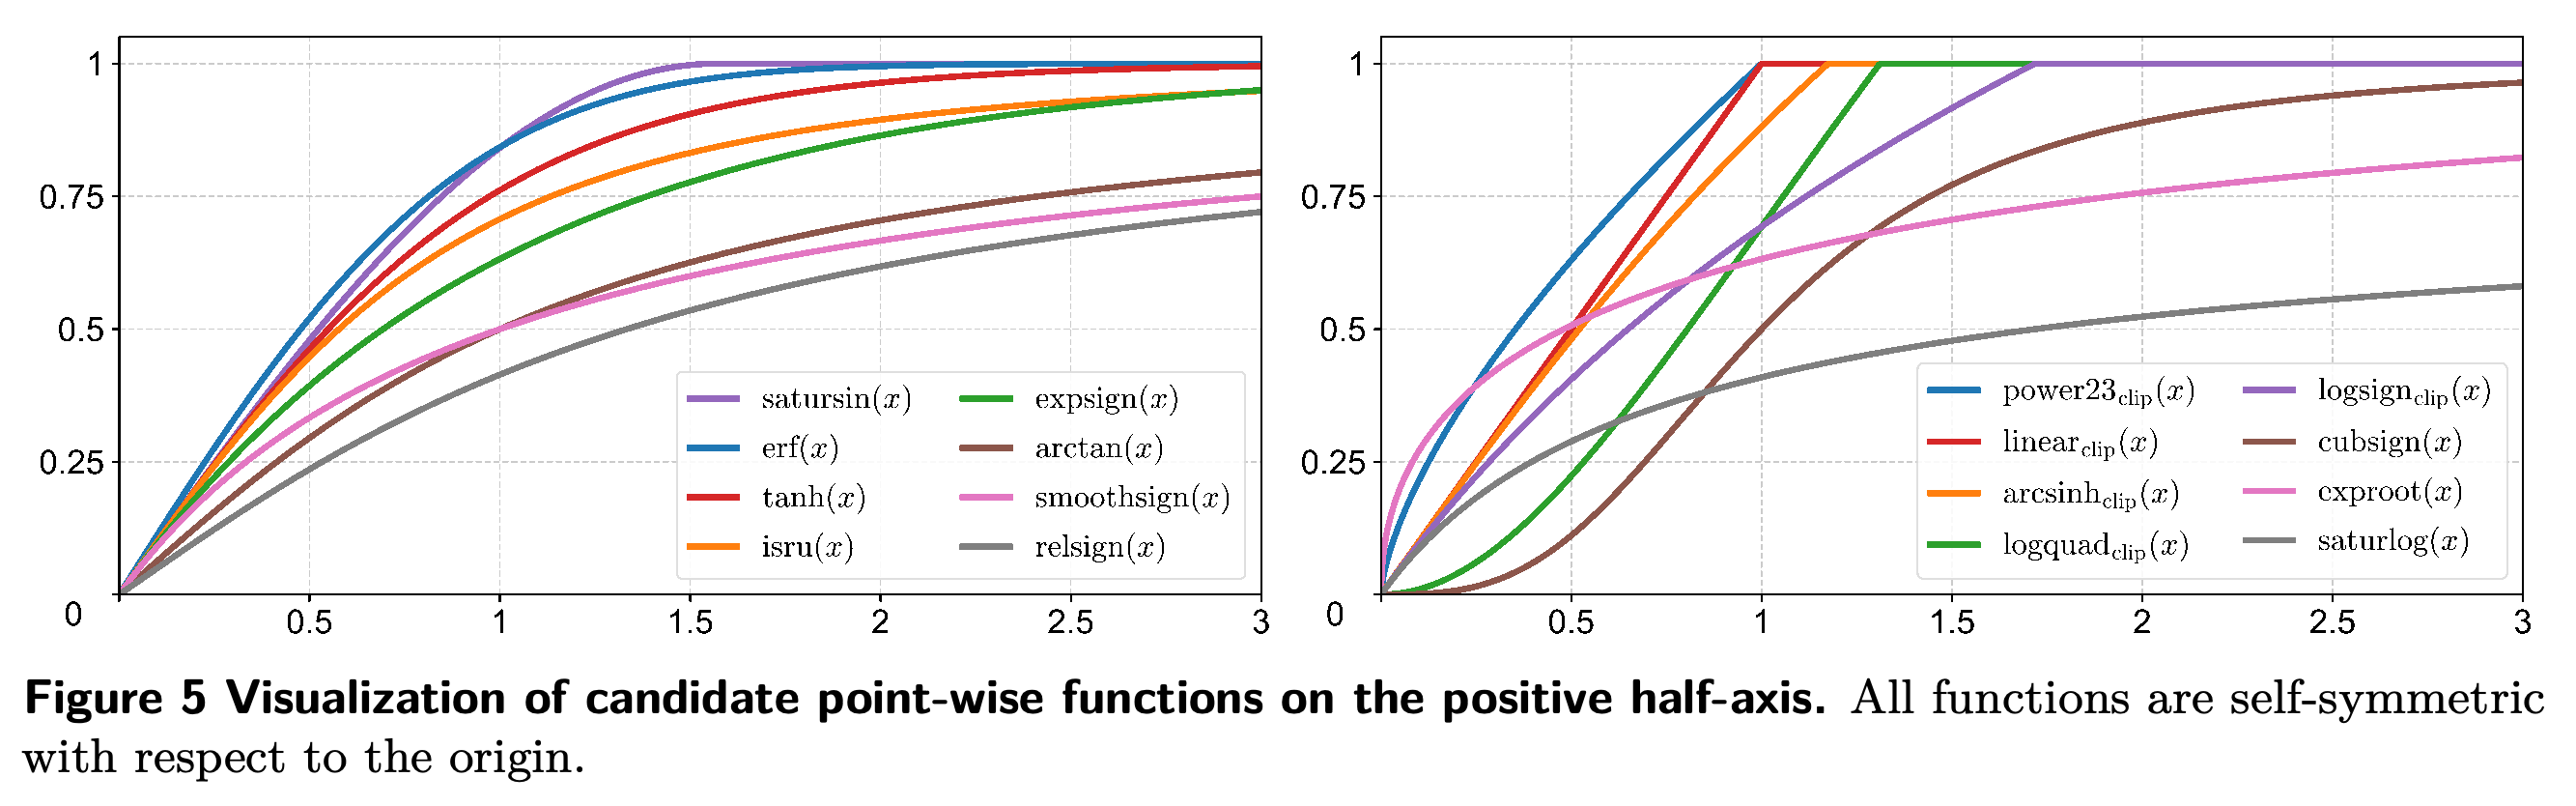
The curves compare positive-side growth of the tested functions. Logquad is the fastest-growing convergent example in this set, which supplies an empirical comparison rather than a general growth-rate bound.
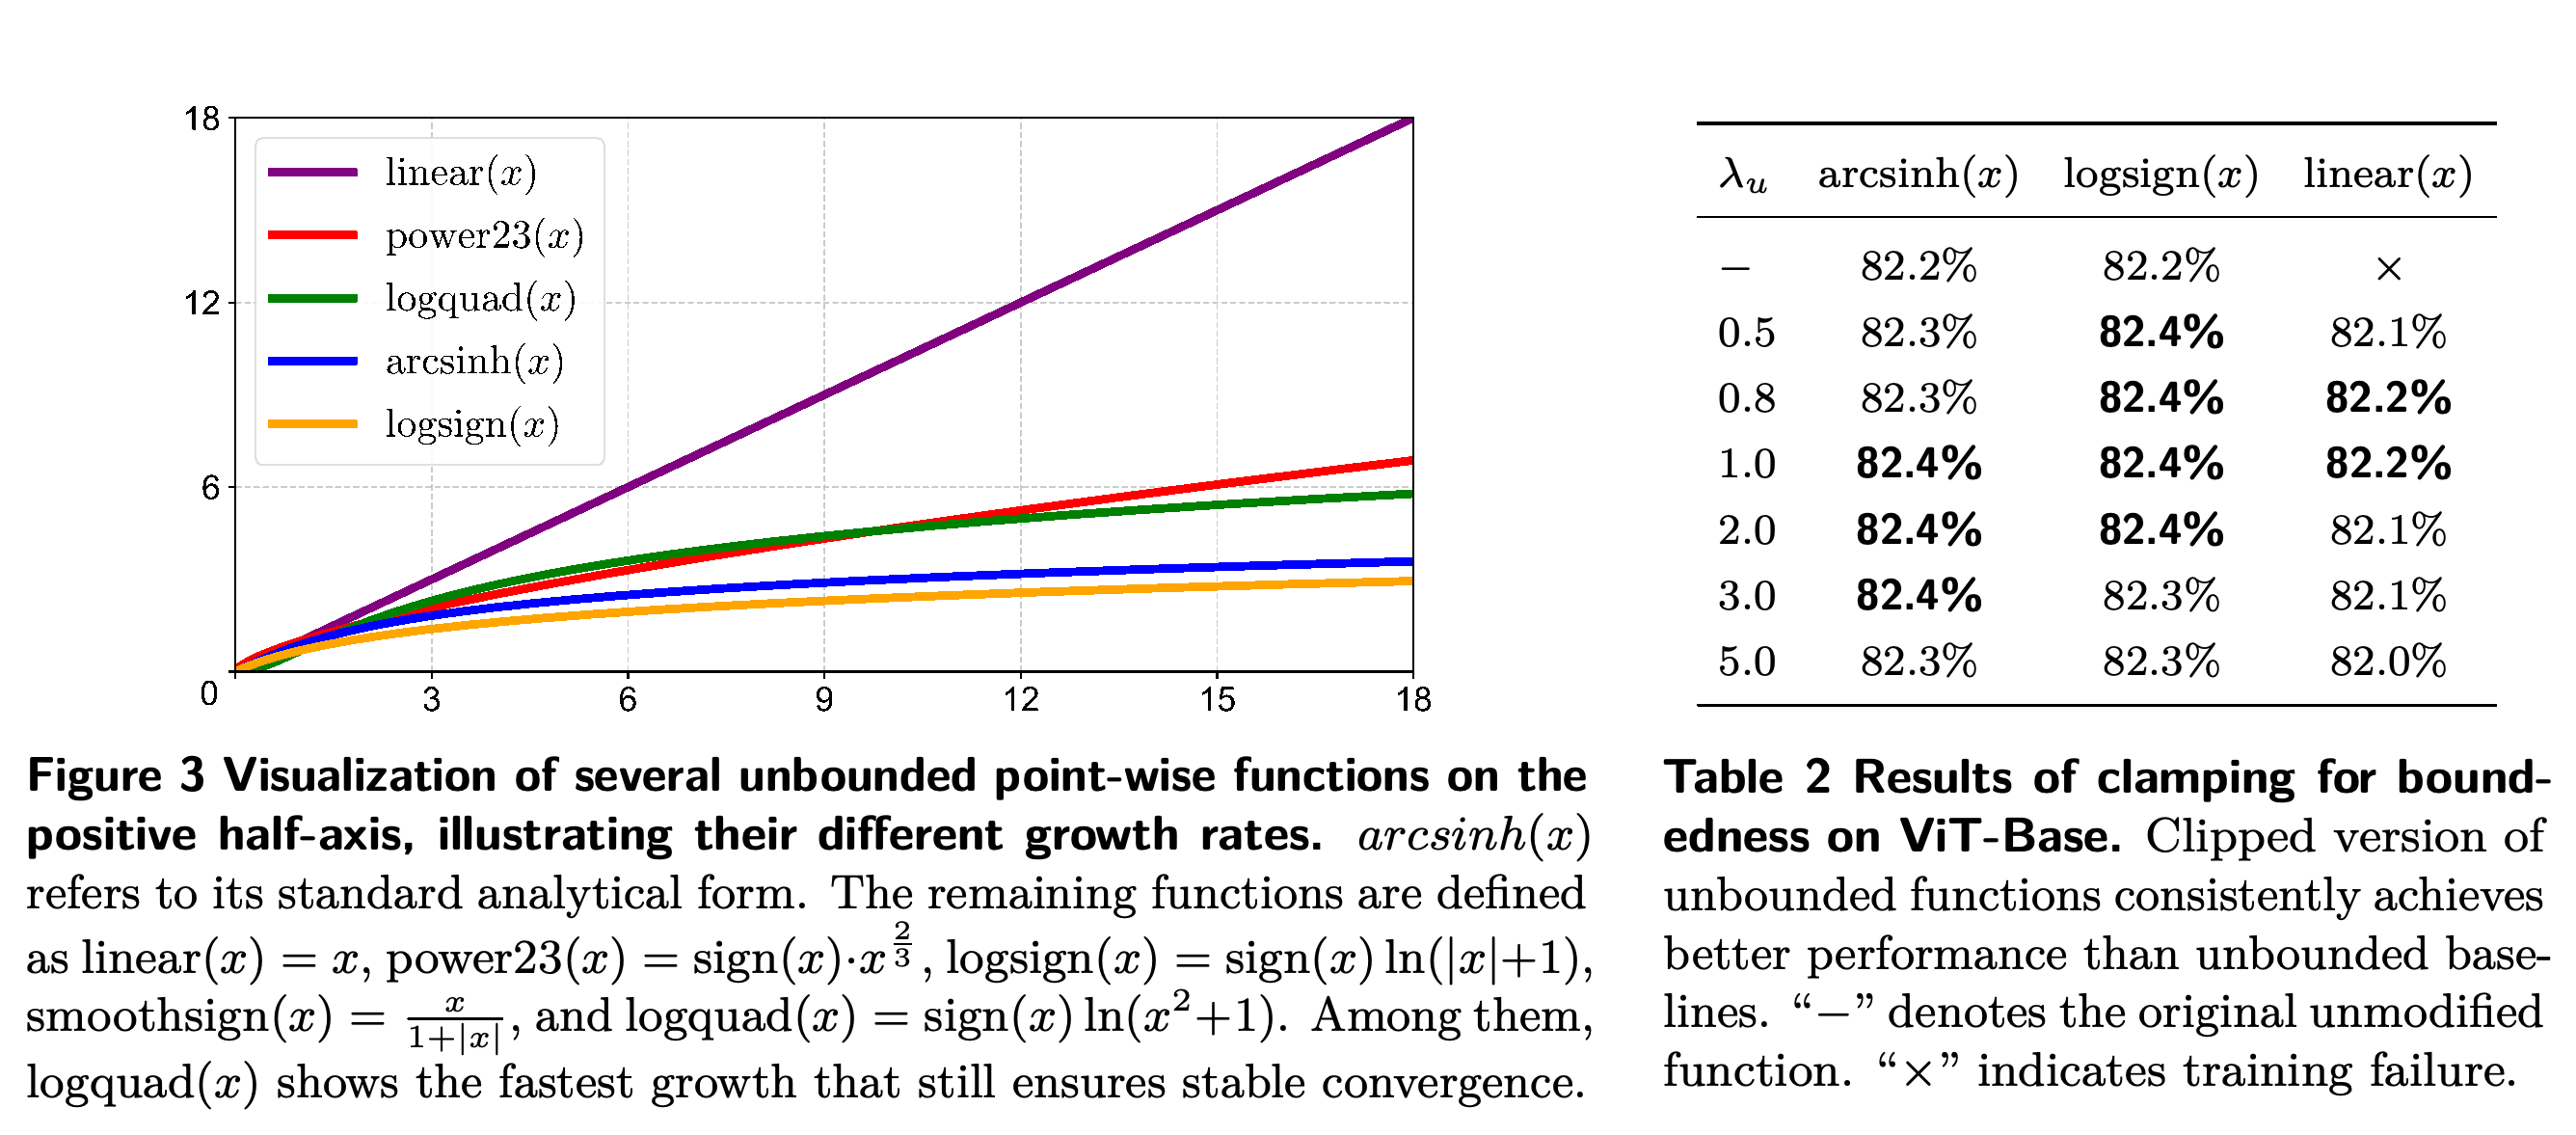
Clipping raises arcsinh and logsign from 82.2% to as much as 82.4%. The unmodified linear function fails, while its clipped variants reach 82.0%–82.2%, illustrating that constraining extreme outputs can enable training.
Adding a small linear component generally lowers accuracy from the bounded baselines. At λb = 0.5, all four tested functions fail, linking substantial linear growth to instability under this training configuration.
Logsign, arcsinh, and logquad converge at 82.2%, 82.2%, and 82.1%, respectively, while power23 and linear fail. The successful unbounded examples show that boundedness is not necessary for convergence in this setup.

3.3 Center Sensitivity
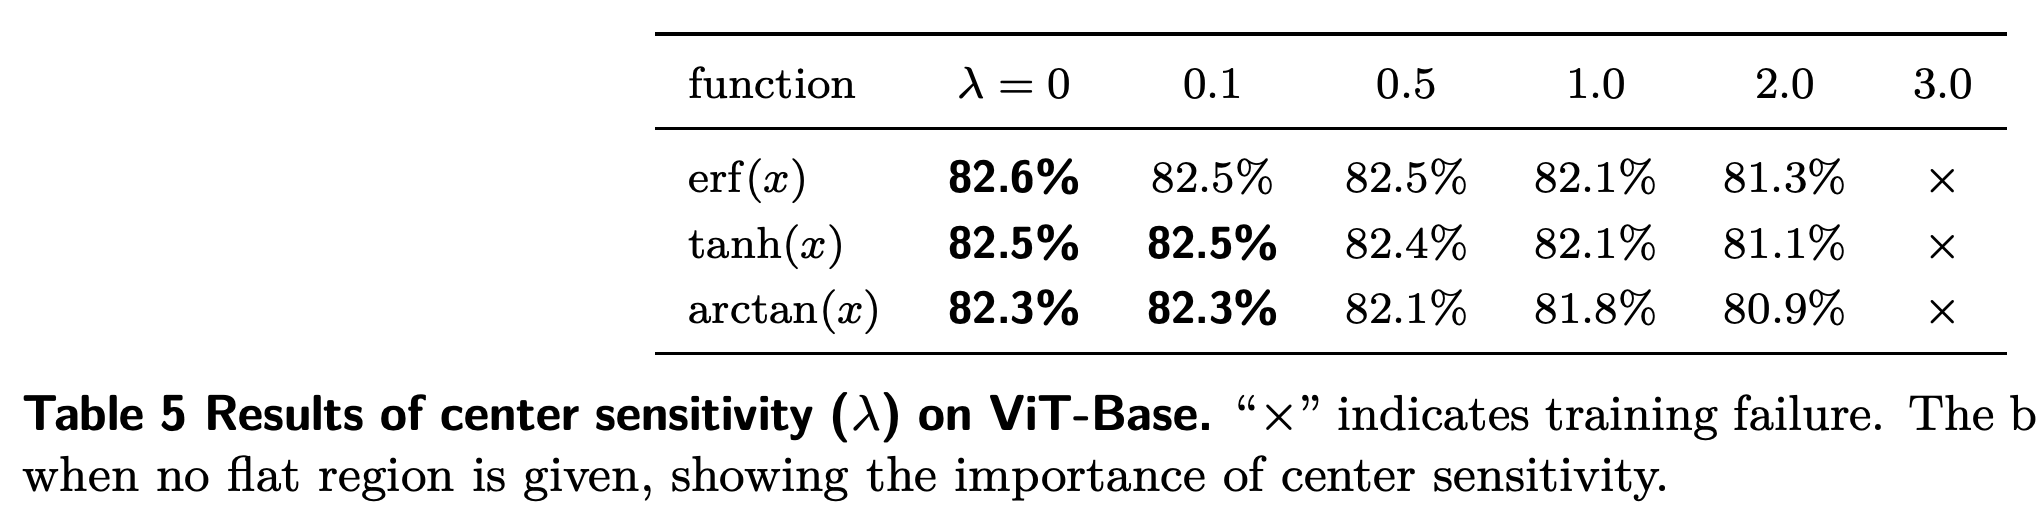
Center sensitivity is tested by imposing f(x) = 0 on [−λ, λ] and shifting the remaining branches outward continuously, with λ ∈ {0.1, 0.5, 1.0, 2.0, 3.0}. For erf, accuracy falls from 82.6% without a flat region to 82.1% at λ = 1.0 and 81.3% at λ = 2.0; all three base functions fail at λ = 3.0. The experiment supports preserving responsiveness near zero, although the authors acknowledge that this property is difficult to isolate independently.
Widening the inactive interval lowers accuracy for each base function, with erf dropping to 81.3% at λ = 2.0. All functions fail at λ = 3.0, supporting preservation of small signals near the origin.
3.4 Monotonicity
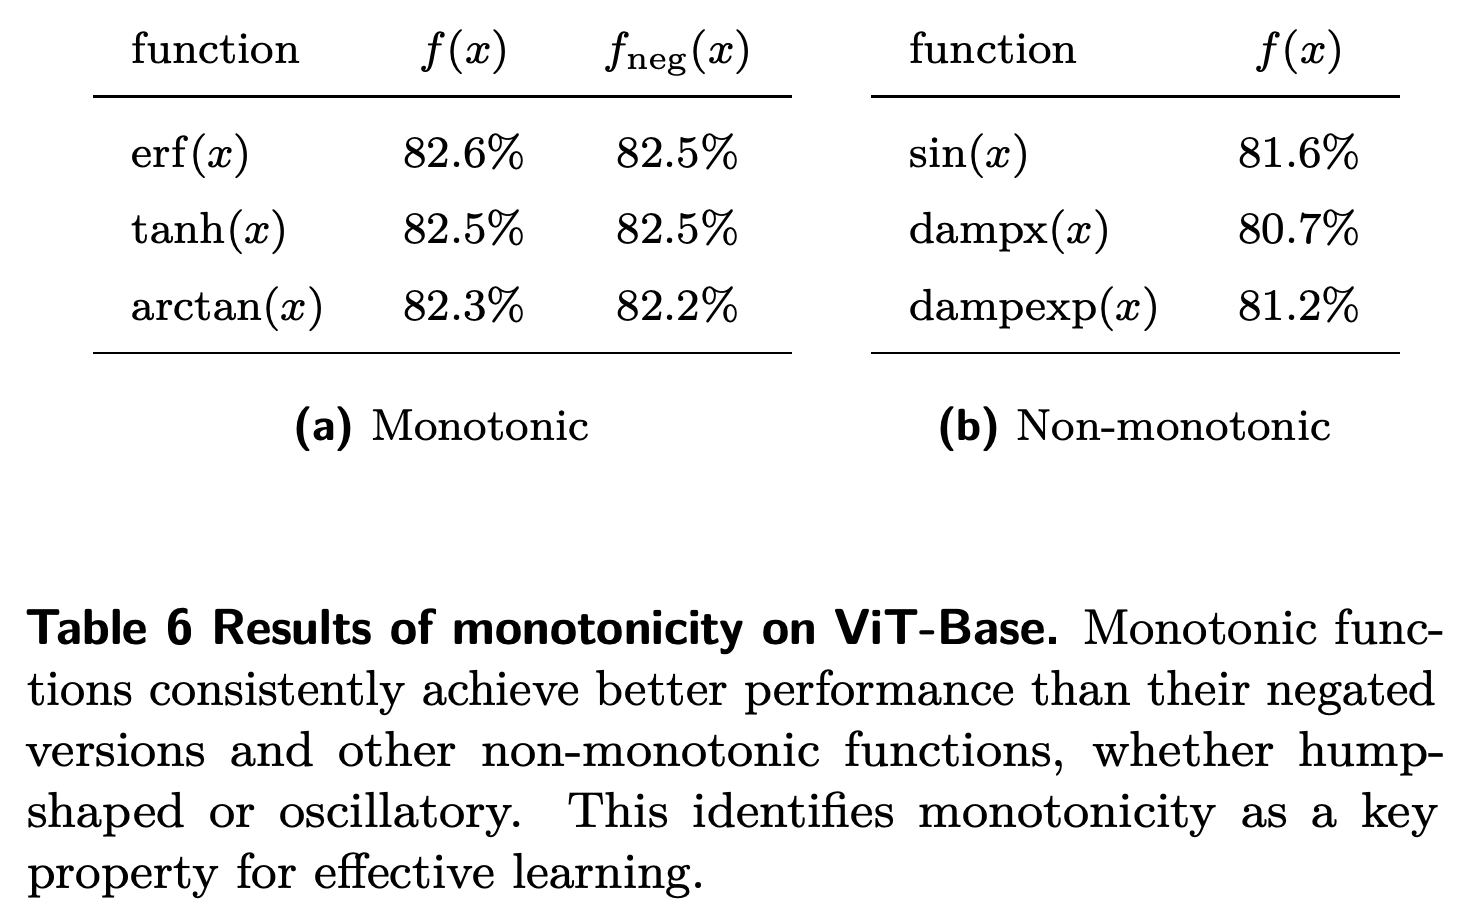
The monotonicity experiment compares increasing functions, their decreasing negations, and non-monotonic functions whose outputs oscillate or rise and then fall, with output ranges rescaled for comparison. Increasing and decreasing erf achieve 82.6% and 82.5%, respectively, while sin, the sine function, dampx, a rational hump-shaped function, and dampexp, an exponentially damped hump-shaped function, achieve 81.6%, 80.7%, and 81.2%. The evidence favors monotonic mappings and shows that a decreasing mapping can also train effectively.
The increasing, decreasing, oscillatory, and hump-shaped mappings differ in how they preserve input ordering despite comparable output ranges. Negated erf remains monotonic, so decreasing functions belong with the monotonic comparisons.
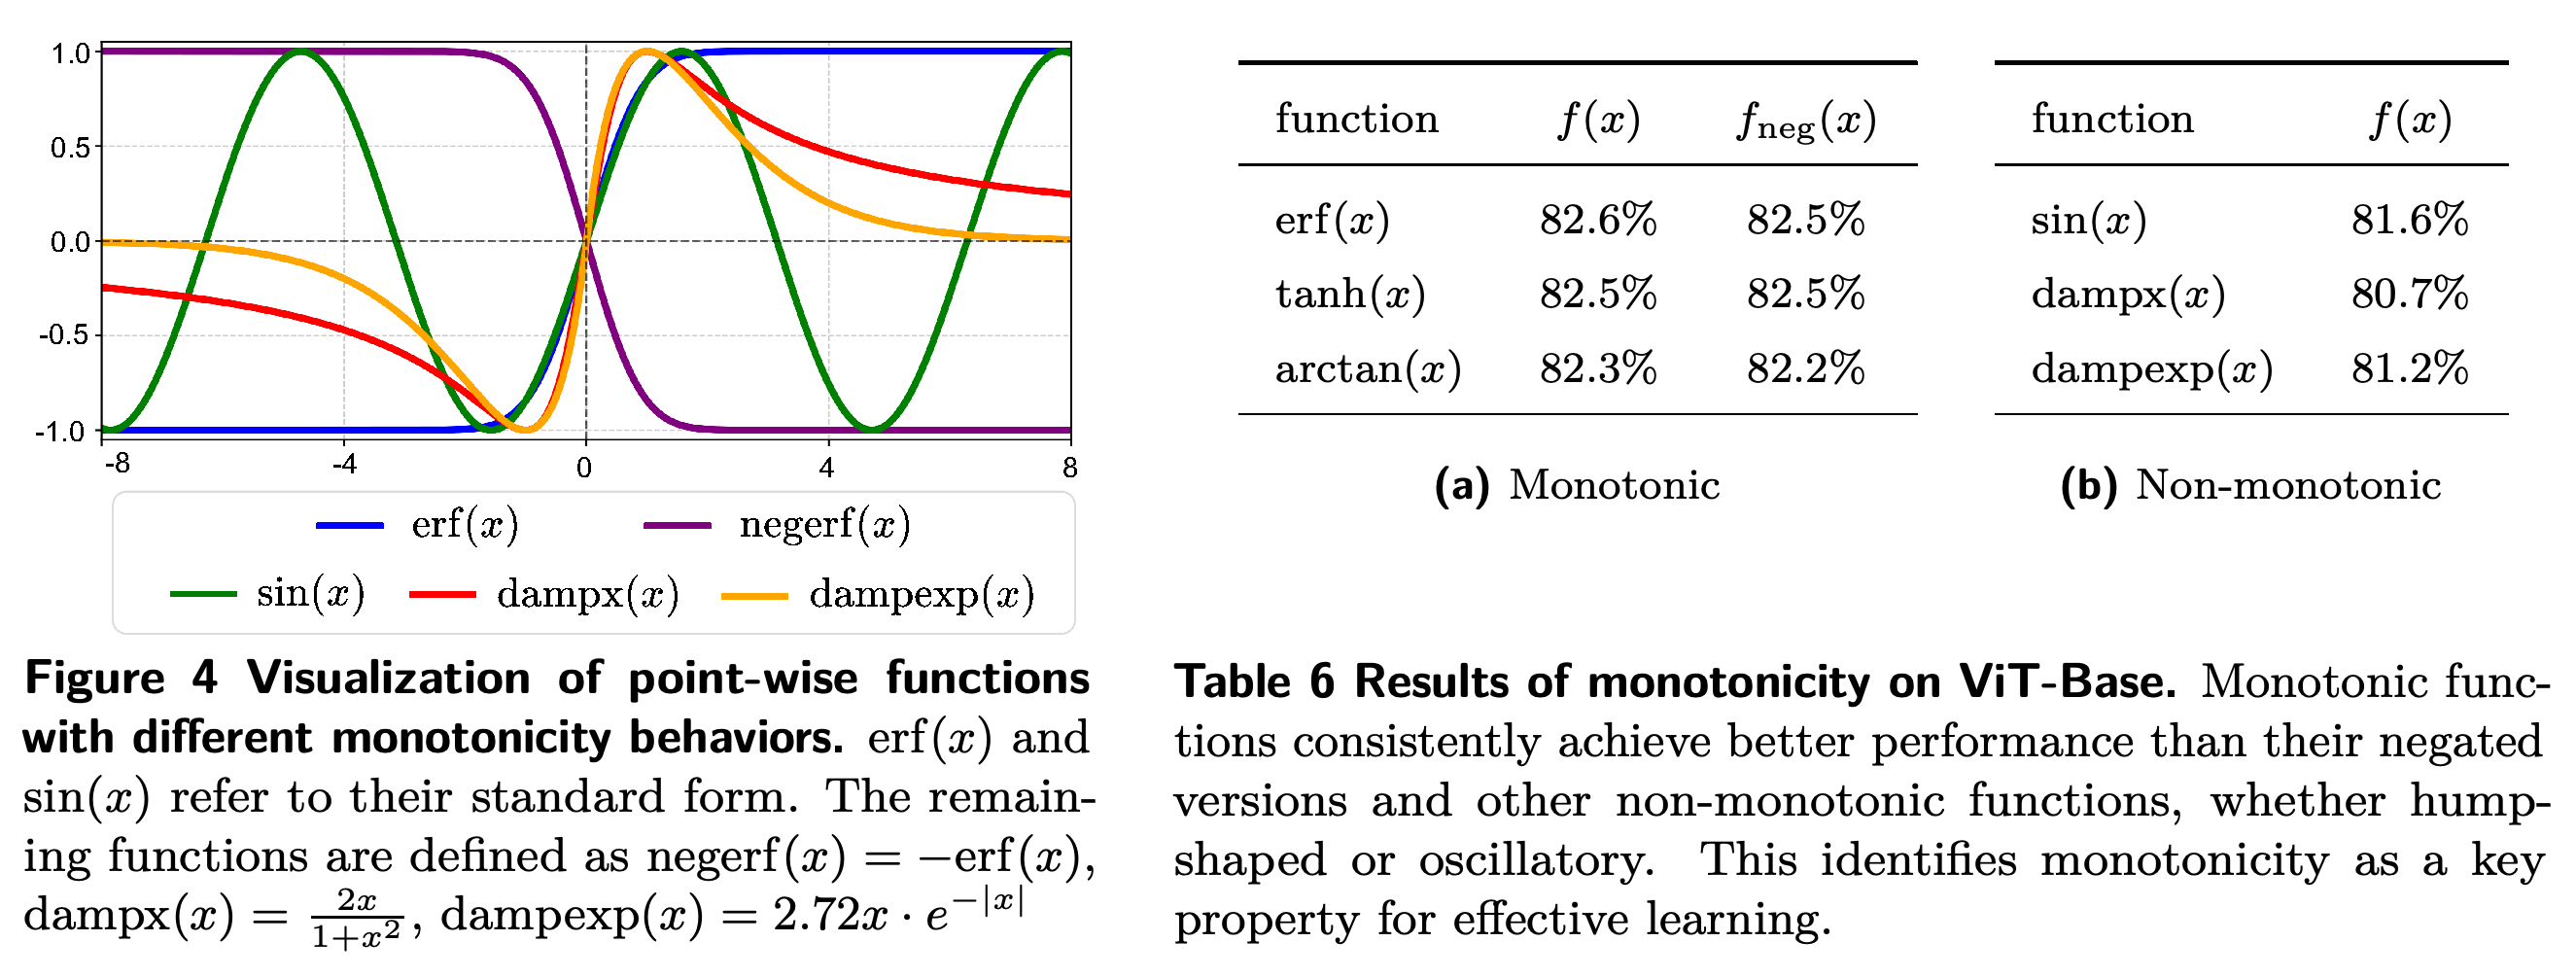
Increasing and decreasing monotonic functions perform similarly, including identical 82.5% results for tanh and its negation. The non-monotonic examples score lower, supporting monotonicity without requiring an increasing direction.
4 Function Search
The search constructs 16 candidates from standard scalar functions and cumulative distribution functions, which describe accumulated probability, using transformations such as scaling, mirroring, and clipping. Each candidate uses \(y=\gamma * f(\alpha x+s)+\beta\), with learned input scale α and shift s, and is tested on ImageNet-1K with ViT-Base and Diffusion Transformers (DiT), image-generating models that iteratively denoise samples. The erf candidate leads all reported candidates at 82.8% classification accuracy and Fréchet Inception Distance (FID), the reported image-generation quality metric with lower values preferred, of 63.23 for DiT-B/4 and 43.94 for DiT-L/4.
The erf candidate leads all 16 functions and LayerNorm on all three reported metrics: 82.8% ViT-Base accuracy, 63.23 DiT-B/4 FID, and 43.94 DiT-L/4 FID. Several candidates perform worse than LayerNorm in generation despite satisfying the proposed shape criteria, showing that those criteria do not fully determine performance.
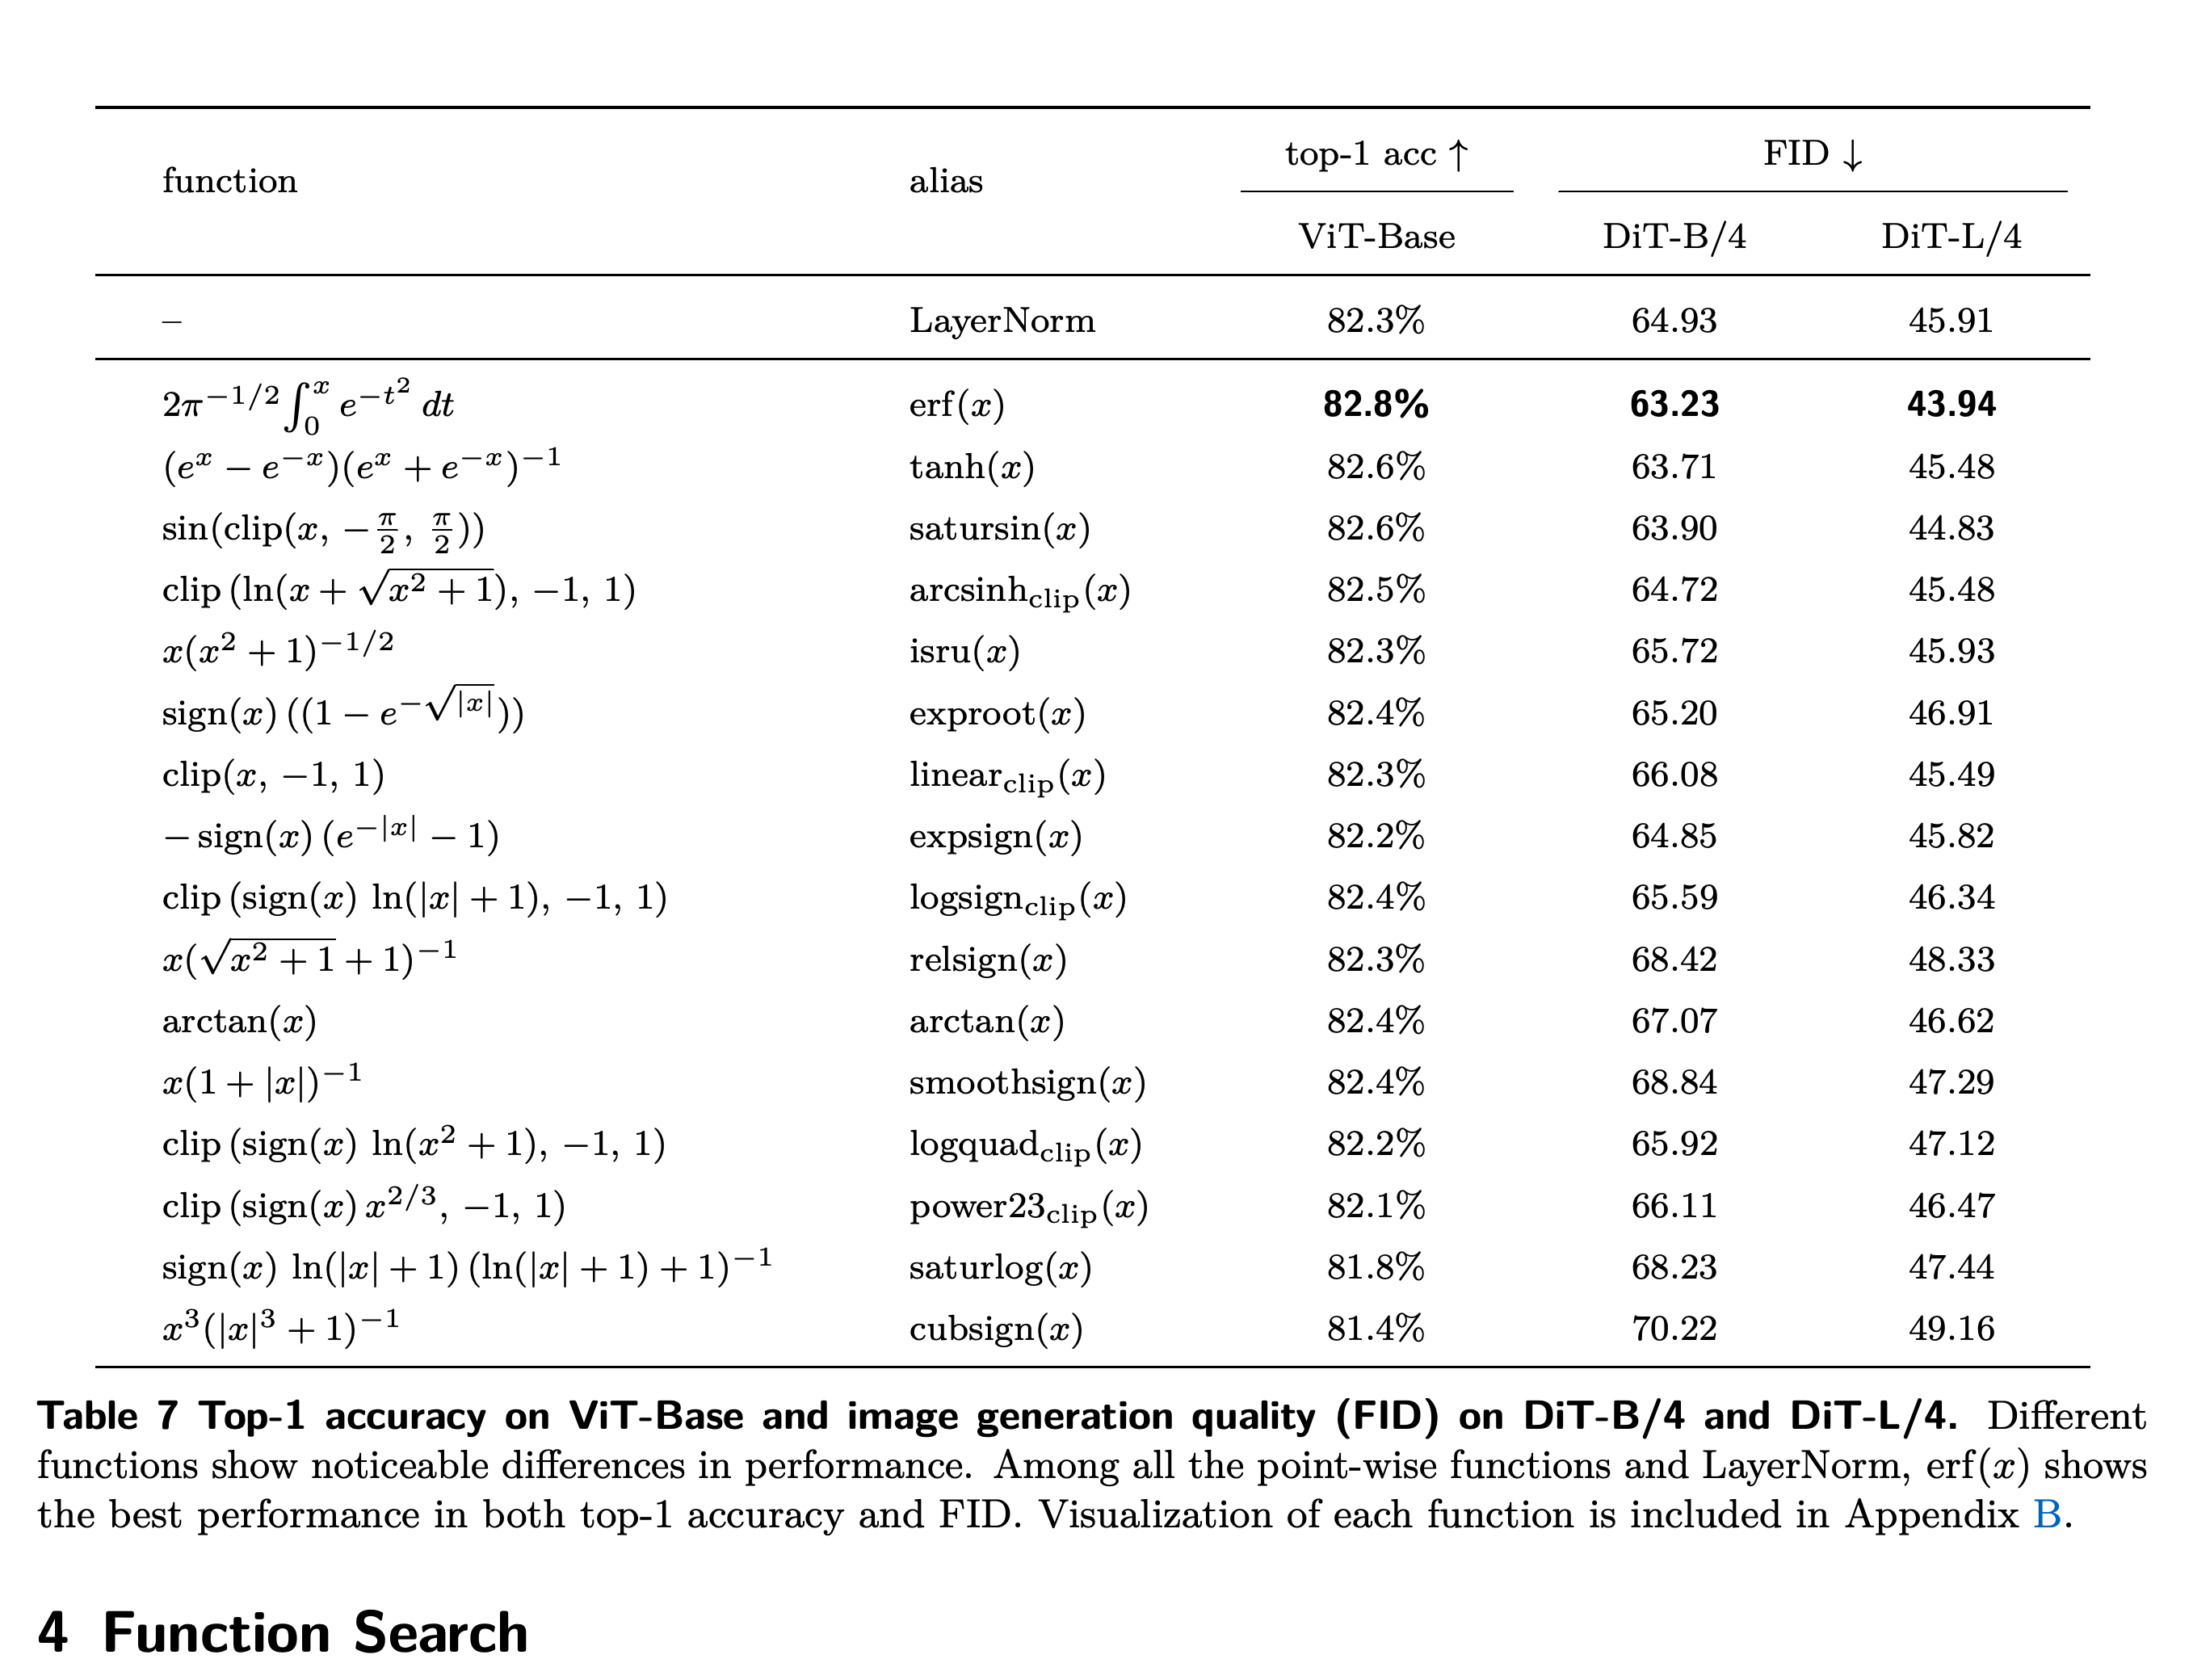
The candidates differ in near-zero response and saturation rate even when they share bounded, centered shapes. Their differing results in Table 7 support evaluating the detailed function form instead of relying on visual similarity.
5 Dynamic erf (Derf)
\(\operatorname{Derf}(x)=\gamma *\operatorname{erf}(\alpha x+s)+\beta\) uses learned scalar α and s and learned per-channel vectors γ and β. The error function is erf(x) = (2/√π) ∫₀ˣ exp(−t²) dt, an S-shaped function related to the Gaussian cumulative distribution; Derf replaces normalization before attention, before the feed-forward network, which transforms each token’s features, and at the model’s final normalization layer. Unless otherwise specified, initialization is α = 0.5, s = 0, γ = 1, and β = 0; code is available at https://github.com/zlab-princeton/Derf.
6 Experiments
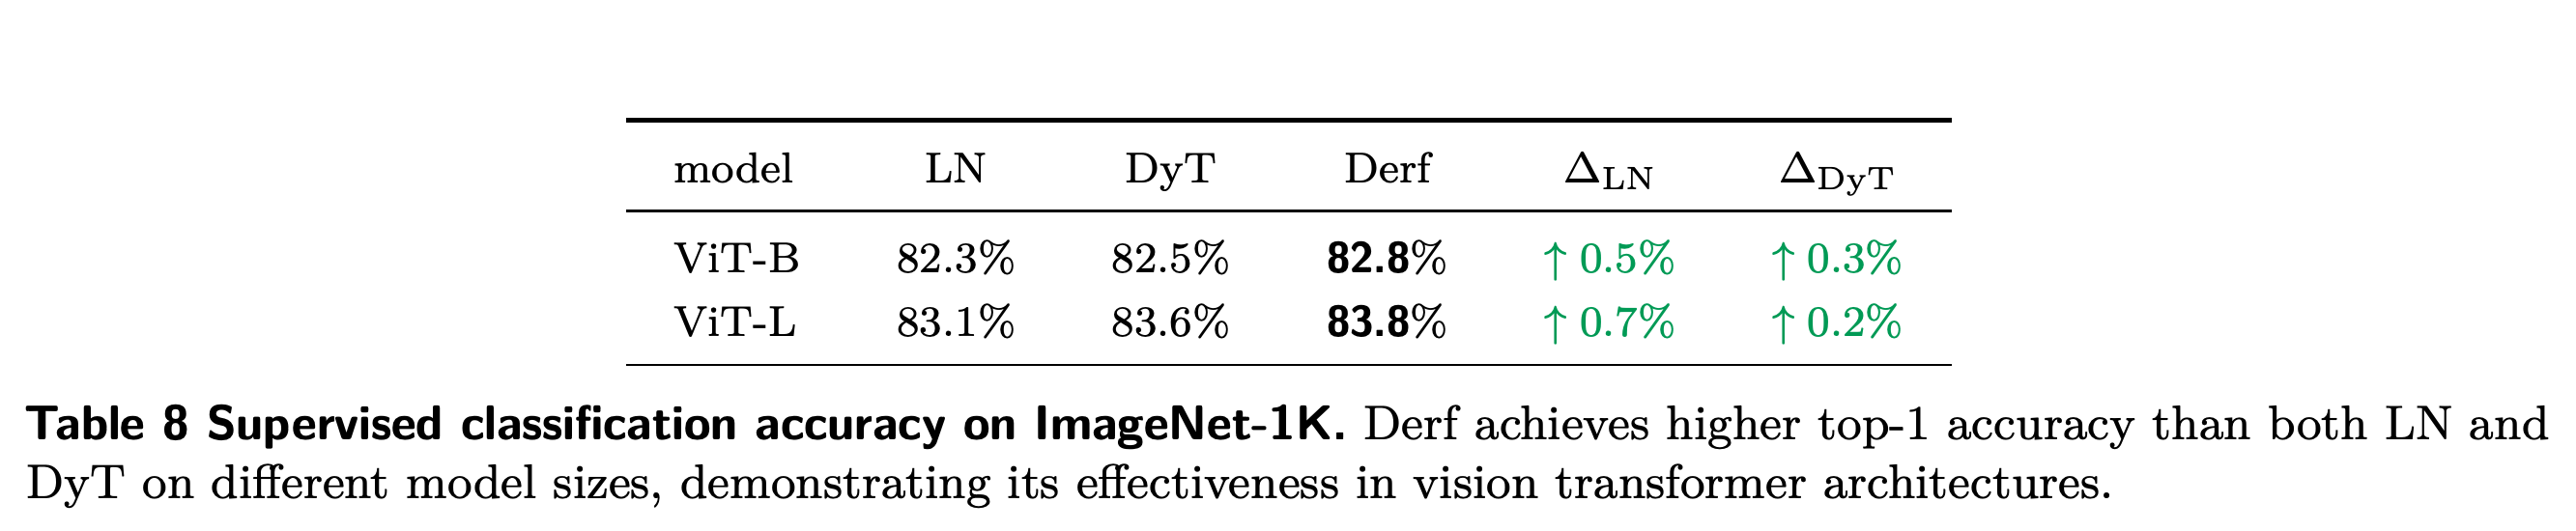
For supervised ImageNet-1K classification, Derf reaches 82.8% with ViT-Base and 83.8% with ViT-Large. LayerNorm reaches 82.3% and 83.1%, while DyT reaches 82.5% and 83.6%, giving Derf gains of 0.5 and 0.7 percentage points over LayerNorm.
Derf improves over LayerNorm by 0.5 percentage points for ViT-Base and 0.7 for ViT-Large. Its gains over DyT are 0.3 and 0.2 percentage points, respectively.
For ImageNet image generation, Derf obtains FID values of 63.23, 43.94, and 18.92 on DiT-B/4, DiT-L/4, and DiT-XL/2, respectively. The corresponding LayerNorm values are 64.93, 45.91, and 19.94, and DyT values are 63.94, 45.66, and 20.83. Class-conditioning affine parameters, which scale and shift features according to the target class, are retained across methods; Appendix C specifies learning-rate searches and different zero-initialization treatment for normalization and point-wise models.
Derf gives the lowest FID at every tested DiT size. For DiT-XL/2, it reaches 18.92 while LayerNorm reaches 19.94 and DyT reaches 20.83; DyT does not improve on LayerNorm at this size.

On the LibriSpeech speech dataset, wav2vec 2.0, a speech representation learning model, achieves validation losses of 1.93 and 1.90 with Derf for Base and Large, compared with LayerNorm’s 1.95 and 1.92. For DNA, the nucleotide sequences modeled in the genomic experiments, HyenaDNA and Caduceus are sequence models pretrained on the GRCh38 human reference genome and evaluated by average classification accuracy over GenomicBenchmarks subtasks. Derf reaches 85.7% and 87.3%, compared with 85.2% and 86.9% for each model’s default normalization and for DyT.
Derf lowers speech pretraining validation loss by 0.02 relative to LayerNorm for both model sizes. The table evaluates the pretraining objective and provides no downstream speech-recognition error rate.

Average genomic classification accuracy rises to 85.7% for Hyena and 87.3% for Caduceus. The normalization baselines use each architecture's default, LayerNorm for Hyena and RMSNorm for Caduceus.

GPT-2 (124M) is pretrained on OpenWebText. After searching the input-scale initialization for both point-wise methods, Derf matches LayerNorm’s 2.94 validation loss and improves on DyT’s 2.97. This establishes parity with LayerNorm in the reported language-model experiment.
Derf and LayerNorm both report 2.94 validation loss, while DyT reports 2.97. The reported language result establishes parity with LayerNorm after initialization tuning.

6.1 Stronger Generalization or Better Fitting?
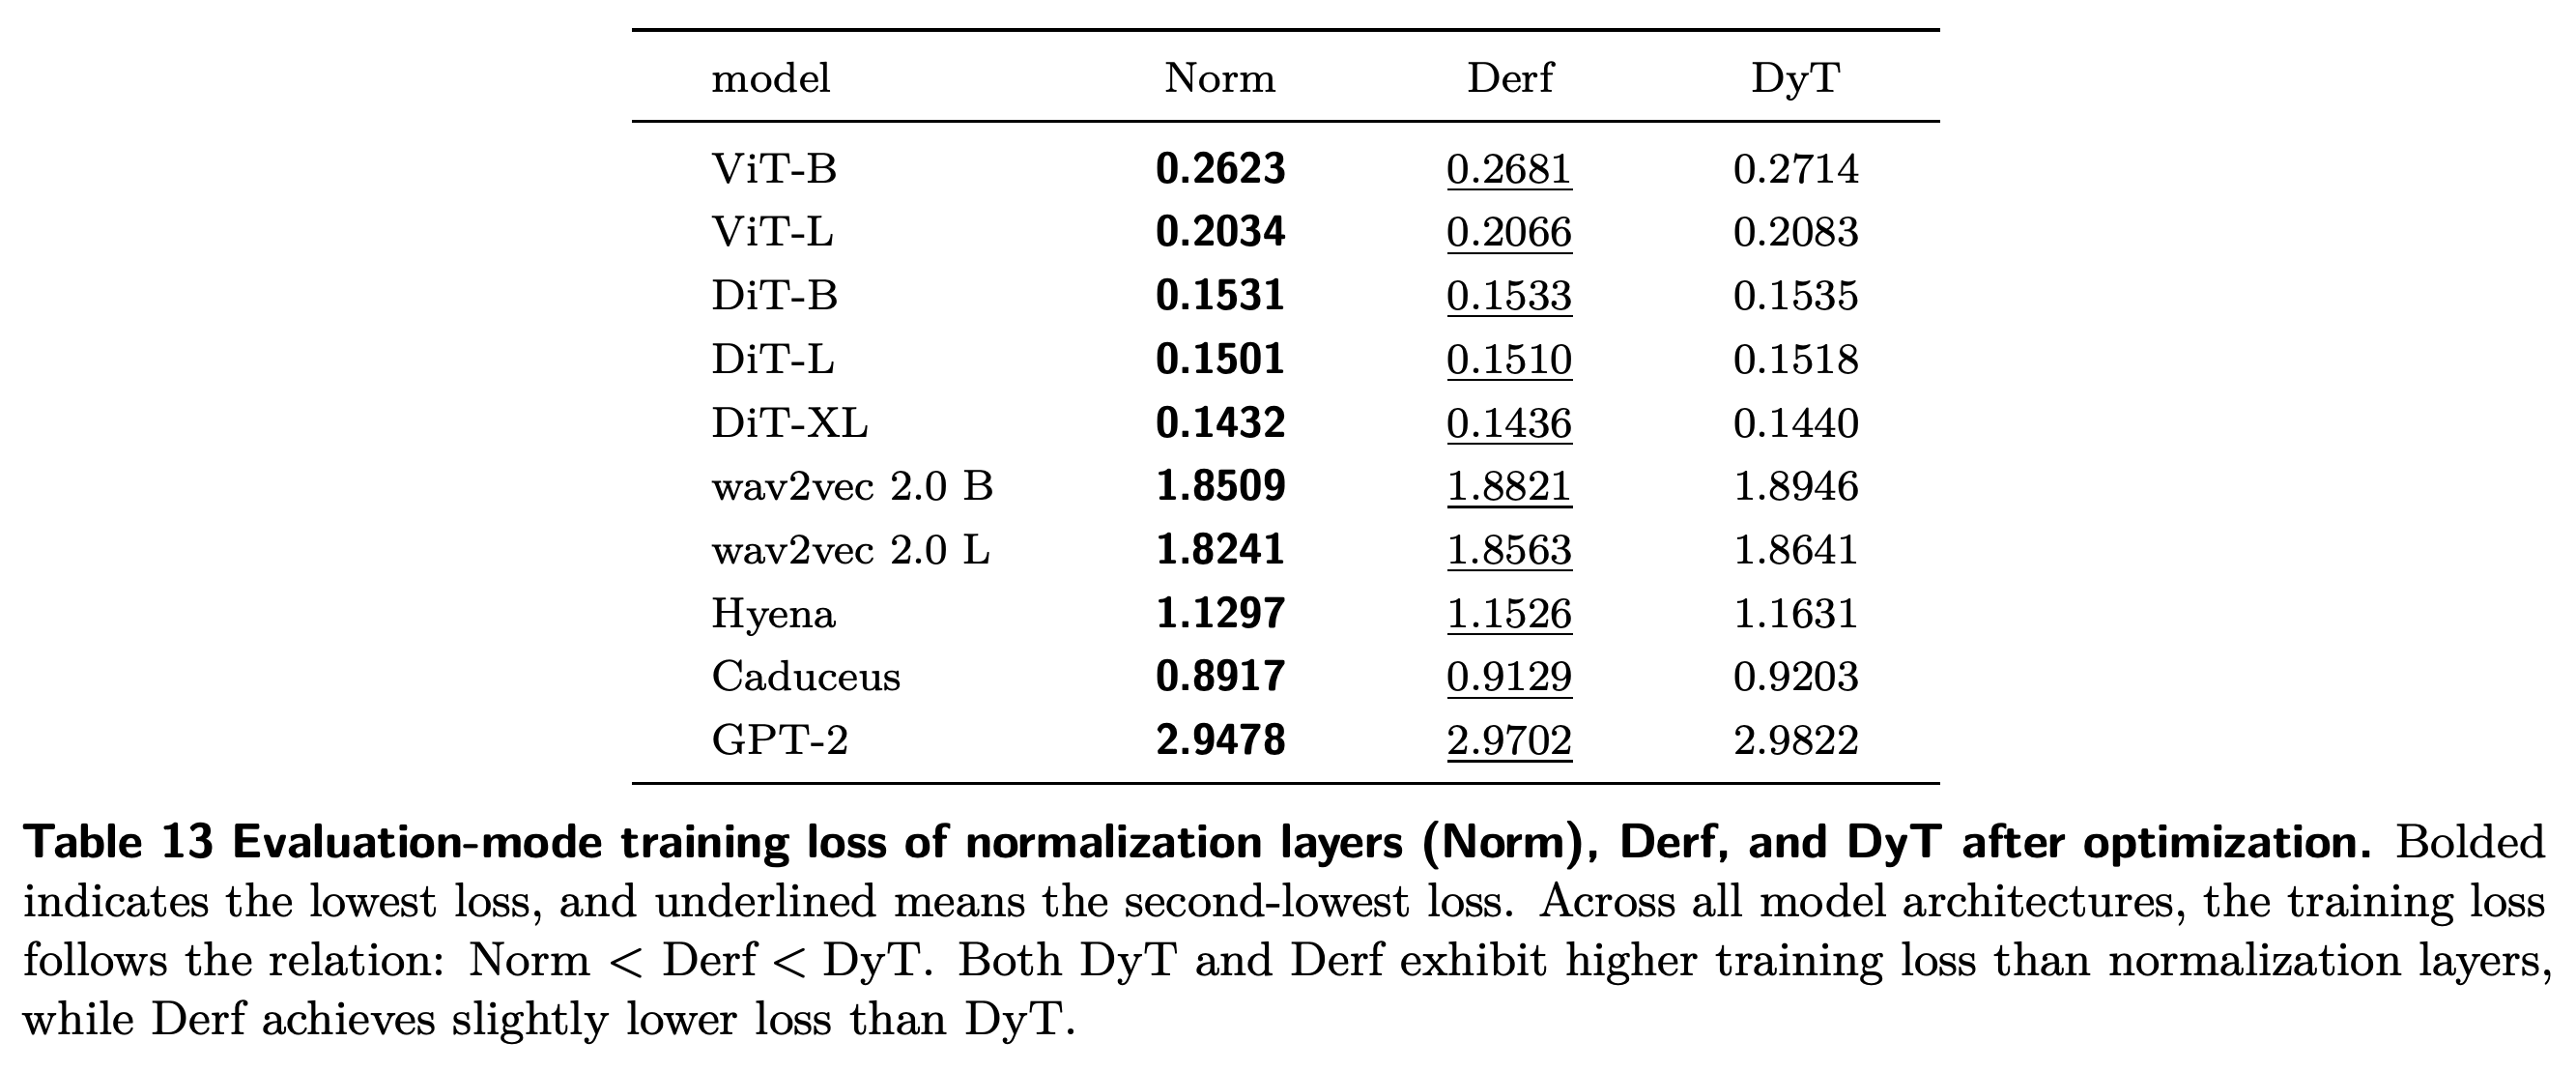
To distinguish fitting from generalization, performance on unseen data, the authors compute training-set losses after optimization in evaluation mode, disabling stochastic regularization, training procedures that randomly perturb the model, when present and using test-time preprocessing. Every reported model follows Norm < Derf < DyT; for example, ViT-Base losses are 0.2623, 0.2681, and 0.2714, respectively. Higher measured training loss alongside better held-out performance supports a generalization interpretation relative to normalization, while the proposed implicit regularization—reduced overfitting induced by the operator itself—remains a hypothesis.
Every row places normalization first, Derf second, and DyT third in evaluation-mode training loss. Derf's evaluation improvements therefore do not come with lower measured training loss than normalization, although this comparison does not isolate the cause.
7 Analysis
The analysis examines how much of Derf’s performance comes from the learned shift s and how much comes from the base function. It compares removing s, replacing scalar s with a per-channel vector, and approximating erf through a fixed rescaling of tanh.
7.1 Effect of s
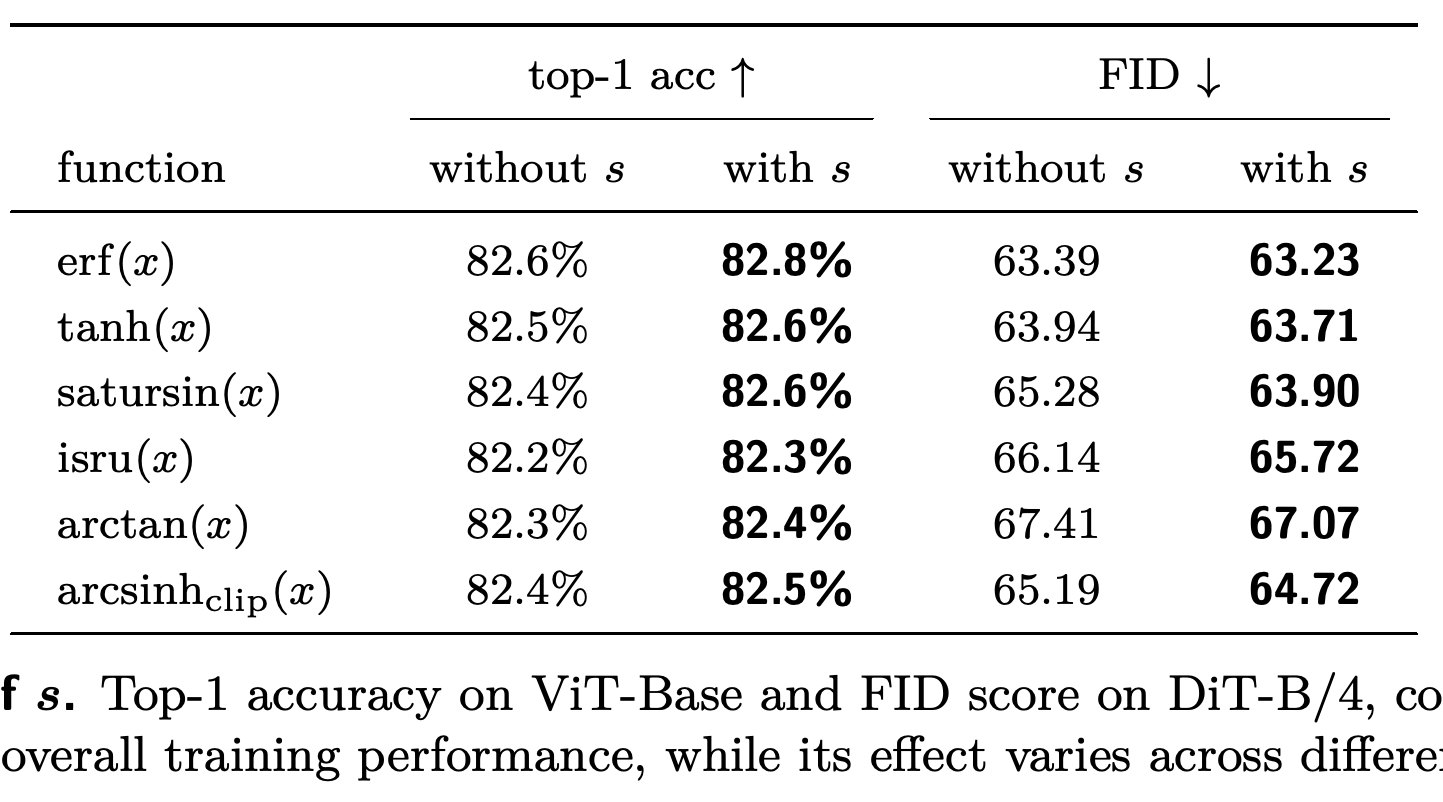
Adding s improves both reported metrics for every tested function in Table 14; for erf, ViT-Base accuracy rises from 82.6% to 82.8% and DiT-B/4 FID falls from 63.39 to 63.23. Erf without s still exceeds tanh without s, so the shift does not fully account for Derf’s advantage. Scalar and vector shifts both yield 82.8% for erf, supporting the simpler scalar design in this experiment.
Adding a learned shift improves all six reported functions on classification accuracy and generation FID. Erf without the shift already outperforms tanh without the shift, separating the contribution of function choice from that of the extra parameter.
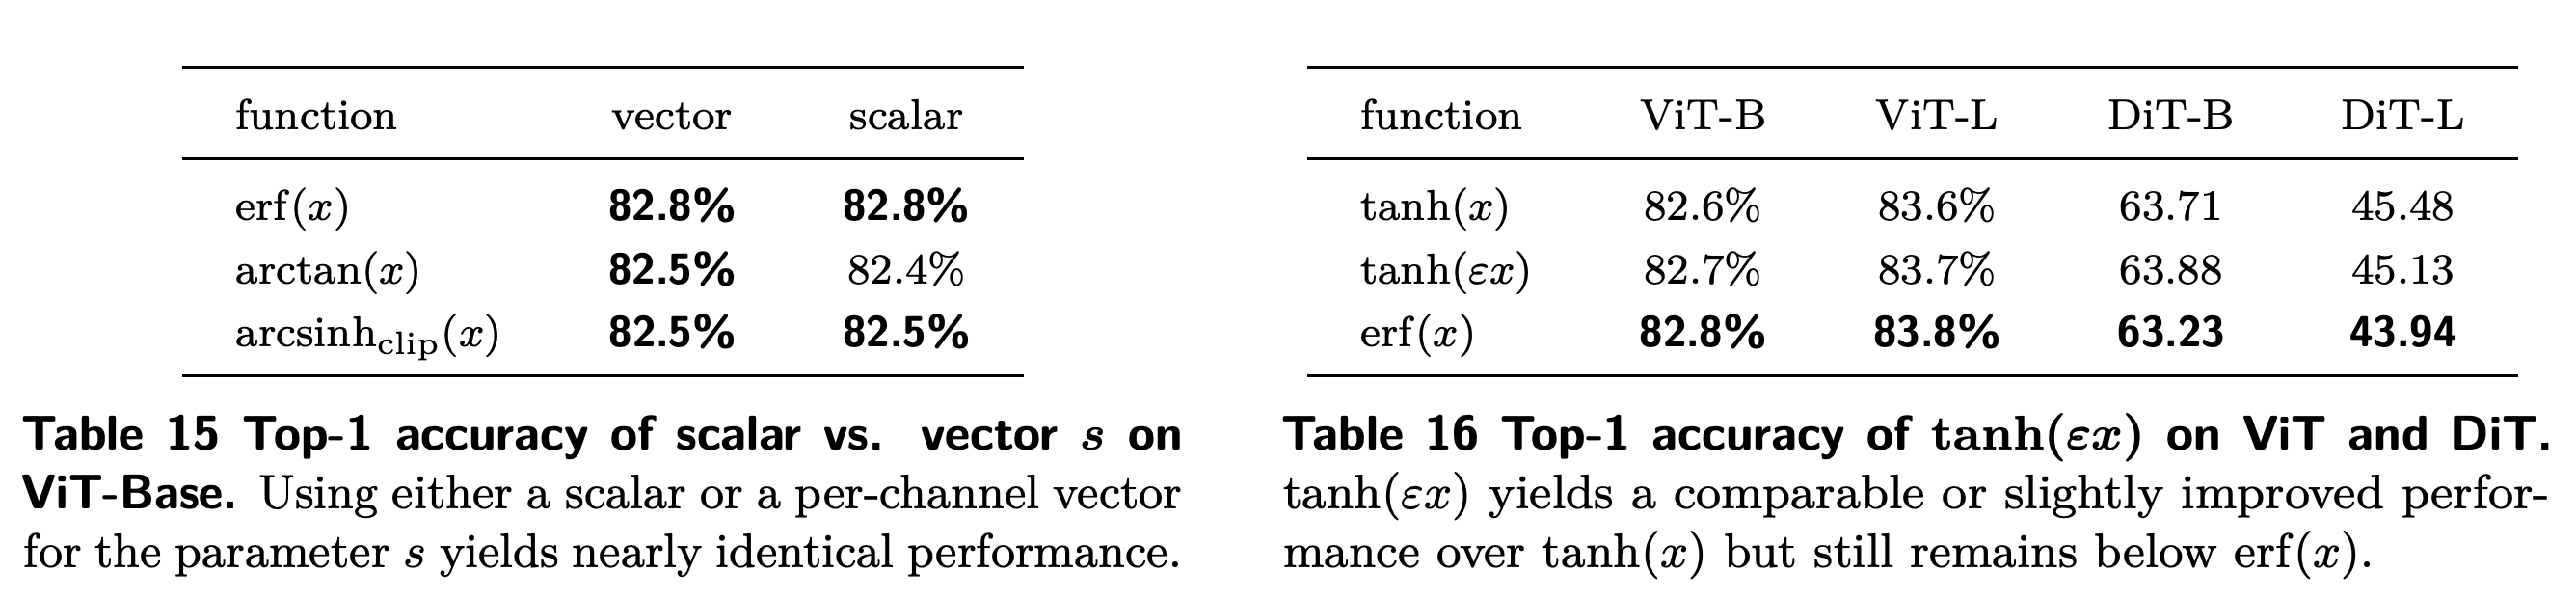
Scalar and per-channel vector shifts produce identical reported accuracy for erf and clipped arcsinh, with a 0.1 percentage-point difference for arctan. These results support the scalar choice in the tested models without establishing statistical equivalence.
7.2 Approximating Derf
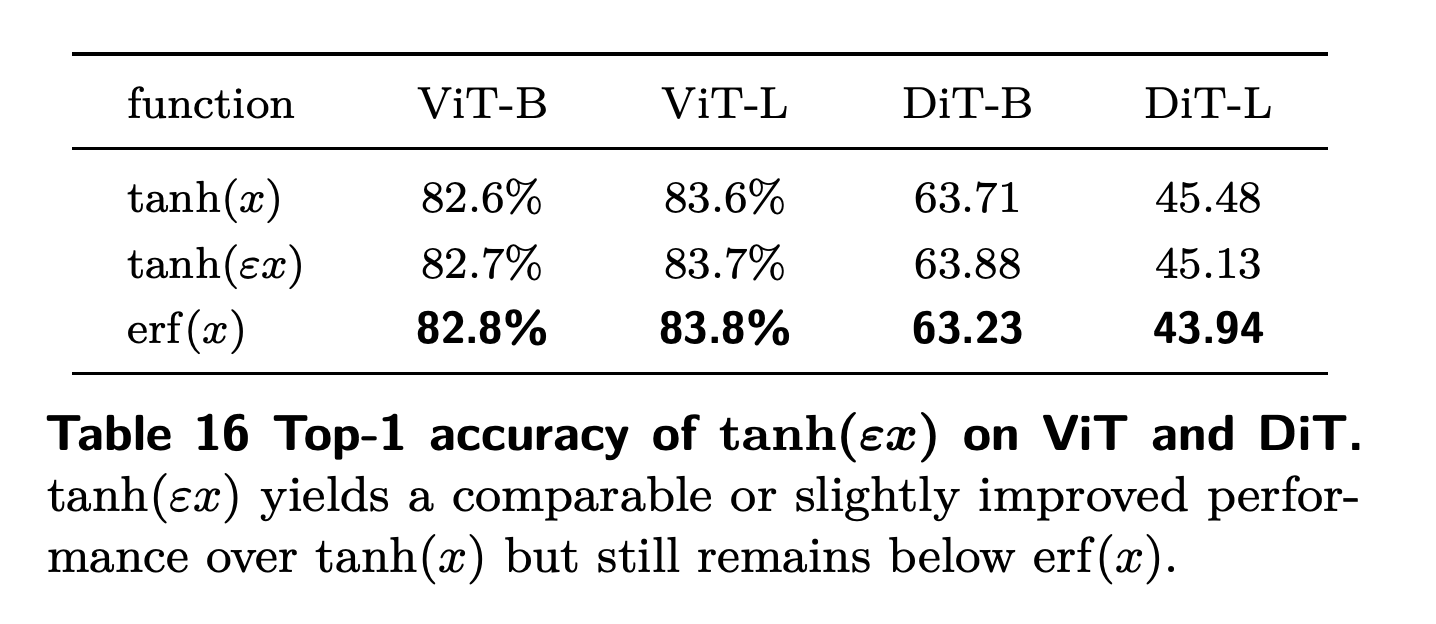
The authors choose \(\varepsilon\approx1.205\) by minimizing the integral of |tanh(εx) − erf(x)| over the real line. This scaled tanh reaches 82.7% and 83.7% on ViT-Base and ViT-Large, below erf’s 82.8% and 83.8%; its DiT-B/4 FID of 63.88 also worsens relative to unscaled tanh’s 63.71. The fixed scaling does not match erf’s reported performance.
Scaled tanh slightly improves both ViT accuracies and DiT-L FID, but worsens DiT-B FID from 63.71 to 63.88. Erf remains best in all four columns, so the fixed approximation does not reproduce its empirical advantage.
8 Related Work
The related work covers normalization variants, explanations based on gradient flow and the shape of the loss surface, and normalization-free approaches based on initialization, activation functions, gradient clipping, or architectural changes. Derf follows the point-wise replacement approach introduced by DyT, contributing a controlled function-property study and empirical selection of the error function.
9 Conclusion
The conclusion identifies zero-centeredness, boundedness, center sensitivity, and monotonicity as useful design properties and presents Derf as the strongest evaluated function. The reported tables support improvements across the tested vision, speech, and genomic settings, with language-model parity against LayerNorm.
Appendix
- A Property Analysis Details includes A.1 Zero-centeredness, A.2 Center Sensitivity, and A.3 Monotonicity. The additional training curves show that a small horizontal shift closely tracks the unshifted baseline, larger vertical shifts raise loss, wider near-zero flat regions raise loss, and increasing or decreasing monotonic functions achieve lower training loss than the tested non-monotonic alternatives.
- B Function Search Details groups the 16 candidates into three natural functions, six transformed basic functions, five clipped unbounded functions, and two canonical ratio functions, which divide a base function by its absolute magnitude plus one. Natural functions include erf, tanh, and rescaled arctan; clipping constrains unbounded functions to [−1, 1], while the ratio construction \(\frac{f(x)}{|f(x)|+1}\) produces the saturating smoothsign and saturlog candidates.
- C Experimental Settings specifies 300 training epochs, effective batch size 4096, and base learning rate 4e-3 for ViT. DiT uses 80 epochs and batch size 256, selects the best result from learning rates {1e-4, 2e-4, 4e-4} for every method, and retains zero initialization only for LayerNorm models. Speech experiments retain the initial GroupNorm, which normalizes grouped features, and the LayerNorm after the convolutional feature extractor, and run all compared models in fp32, 32-bit floating-point precision.
- The remaining C Experimental Settings uses sequence lengths 1024 for HyenaDNA and 131072 for Caduceus, with 10000 and 50000 training steps, respectively. GPT-2 uses 300,000 iterations and block size 1024, searching α initialization over {0.5, 1.0, 2.0, 4.0} for attention-associated layers and {0.1, 0.3, 0.5, 1.0} for other layers. The reported language results are the best validation losses obtained from the tested initialization combinations.
- D Additional Results compares RMSNorm and GroupNorm where applicable. Derf leads the added vision, generation, speech, and genomic comparisons; GPT-2 validation loss is 2.94 for both Derf and LayerNorm, 2.95 for RMSNorm, and 2.97 for DyT. For Caduceus, Table 25 distinguishes LayerNorm’s 87.0% from the default RMSNorm’s 86.9%, with Derf at 87.3%.
- E Loss Calculation Details computes ViT training loss over the full training set after disabling augmentation and stochastic regularization. DiT instead averages diffusion mean squared error, the squared prediction-error loss, over the first 100 training batches and retains random horizontal flips in preprocessing; other models use their full training sets. The fitting comparison therefore uses different loss-calculation procedures across model families.
- F Computation Cost benchmarks single-layer operations with custom Triton kernels, GPU implementations of the compared operators, under matched batch size, sequence length, precision, and comparable operator fusion. At the reported 15k hidden dimension, Derf and DyT each take 0.42 ms forward and 0.73 ms backward, versus 0.42 ms and 0.74 ms for LayerNorm. These results establish comparable operator runtime in the tested setup; the paper reports no end-to-end model throughput measurement.
Brief Thoughts
The function-property experiments give practical guidance for the tested ViT configuration, and the common candidate search tests whether functions satisfying that guidance actually perform well. The shift ablation also shows that erf’s advantage is not solely due to an added parameter. Successful unbounded functions and tolerance of small shifts keep these findings from becoming universal mathematical requirements.
The reported tables provide no uncertainty estimates across repeated runs with different random seeds, leaving the variability of small differences such as 0.1 percentage point or 0.01 validation loss unquantified. GPT-2 is evaluated only at 124M parameters, speech retains input-related normalization, and DiT changes initialization between operator families. These conditions limit claims about complete normalization removal or improvements attributable to a layer substitution alone.
Higher training loss and better evaluation performance are consistent with improved generalization, but the proposed implicit-regularization mechanism is not directly isolated. Derf’s measured single-layer cost is comparable to the alternatives, so the runtime results support using it for the reported accuracy and loss improvements without assuming substantial computational savings.
The single-layer runtime curves closely overlap for Derf and DyT. Derf's backward runtime becomes favorable relative to LayerNorm at larger hidden dimensions, but the plot does not measure end-to-end training or inference speed.
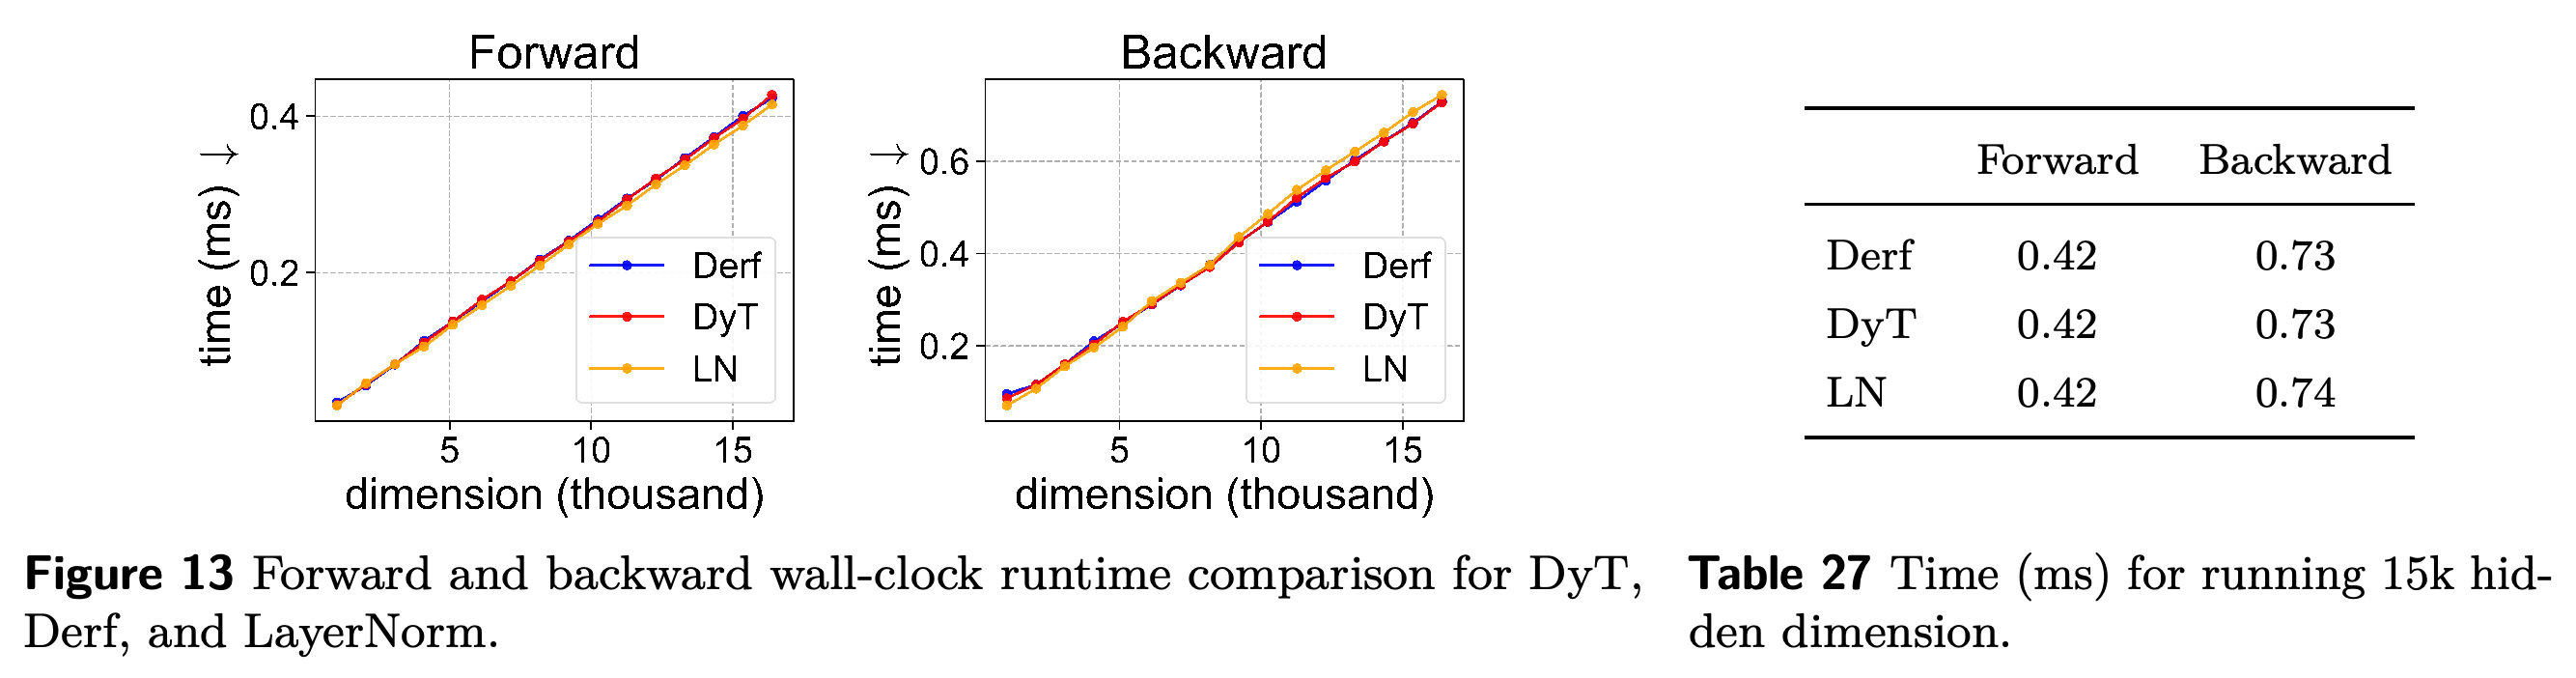
At the reported 15k hidden dimension, all operators take 0.42 ms forward; backward takes 0.73 ms for Derf and DyT and 0.74 ms for LayerNorm. The numerical difference supports comparable runtime rather than a large measured acceleration.