


Synthetic Sandbox for Training Machine Learning Engineering Agents | Summary
06 Apr 2026 | Paper Review Agent Learning Synthetic Environments Reinforcement LearningContents
- Summary
- 1 Introduction
- 2 Related Work
- 3 Preliminaries
- 4 SandMLE
- 5 Experiments
- 6 Analysis
- 7 Conclusion
- Appendix
- Brief Thoughts
This article explains the key points of Synthetic Sandbox for Training Machine Learning Engineering Agents.
- 2026-04-06 (arXiv)
- Zhou, Yuhang, Zhang, Lizhu, Wu, Yifan, Liu, Jiayi, Fan, Xiangjun, Zhao, Zhuokai, Yan, Hong.
- Meta AI
- Paper
Summary
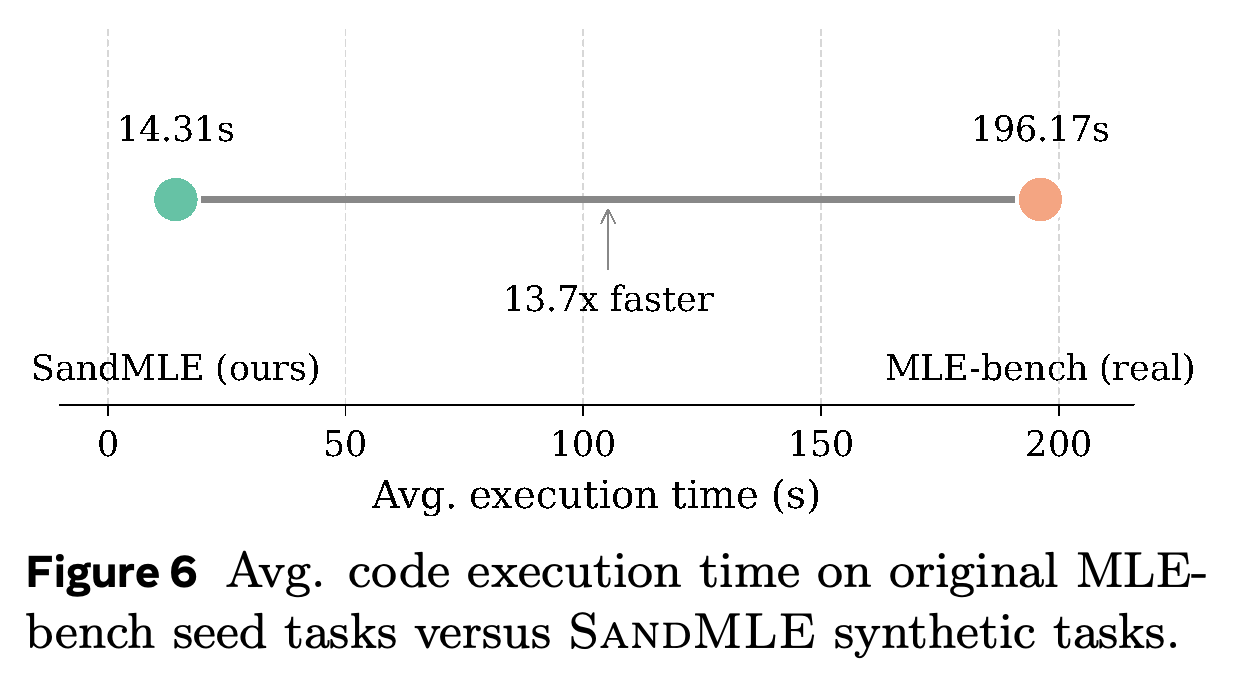
- Synthetic Sandbox for Training Machine Learning Engineering Agents introduces SandMLE, a framework for training MLE agents through trajectory-wise on-policy reinforcement learning. Its procedurally generated tasks target 50–200 samples, reducing measured average code execution time from 196.17 seconds on original seed tasks to 14.31 seconds on synthetic tasks.
- Four specialized agents generate task specifications, synthetic data, deterministic evaluators, and aligned descriptions. Execution checks and threshold-ordering verification produce 848 training tasks and 64 validation tasks for trajectory-level GRPO, with rewards for reasoning format, valid submissions, and progressively stronger performance milestones.
- On 22 unseen MLE-Bench-Lite tasks, pure SandMLE achieves Any Medal rates of 22.7%, 22.7%, and 27.3% for Qwen3-8B, Qwen3-14B, and Qwen3-30B-A3B, respectively. Evaluation under alternative scaffolds and on 62 MLE-Dojo tasks demonstrates transfer, although gains vary by scaffold and metric, and the experiments do not isolate which generation components enable that transfer.
1 Introduction
MLE agents repeatedly propose approaches, write code, execute training pipelines, inspect feedback, and revise their solutions. Unlike software-engineering unit tests, these actions can require training and inference over large datasets; the paper identifies execution latency as the principal obstacle to trajectory-wise on-policy RL.
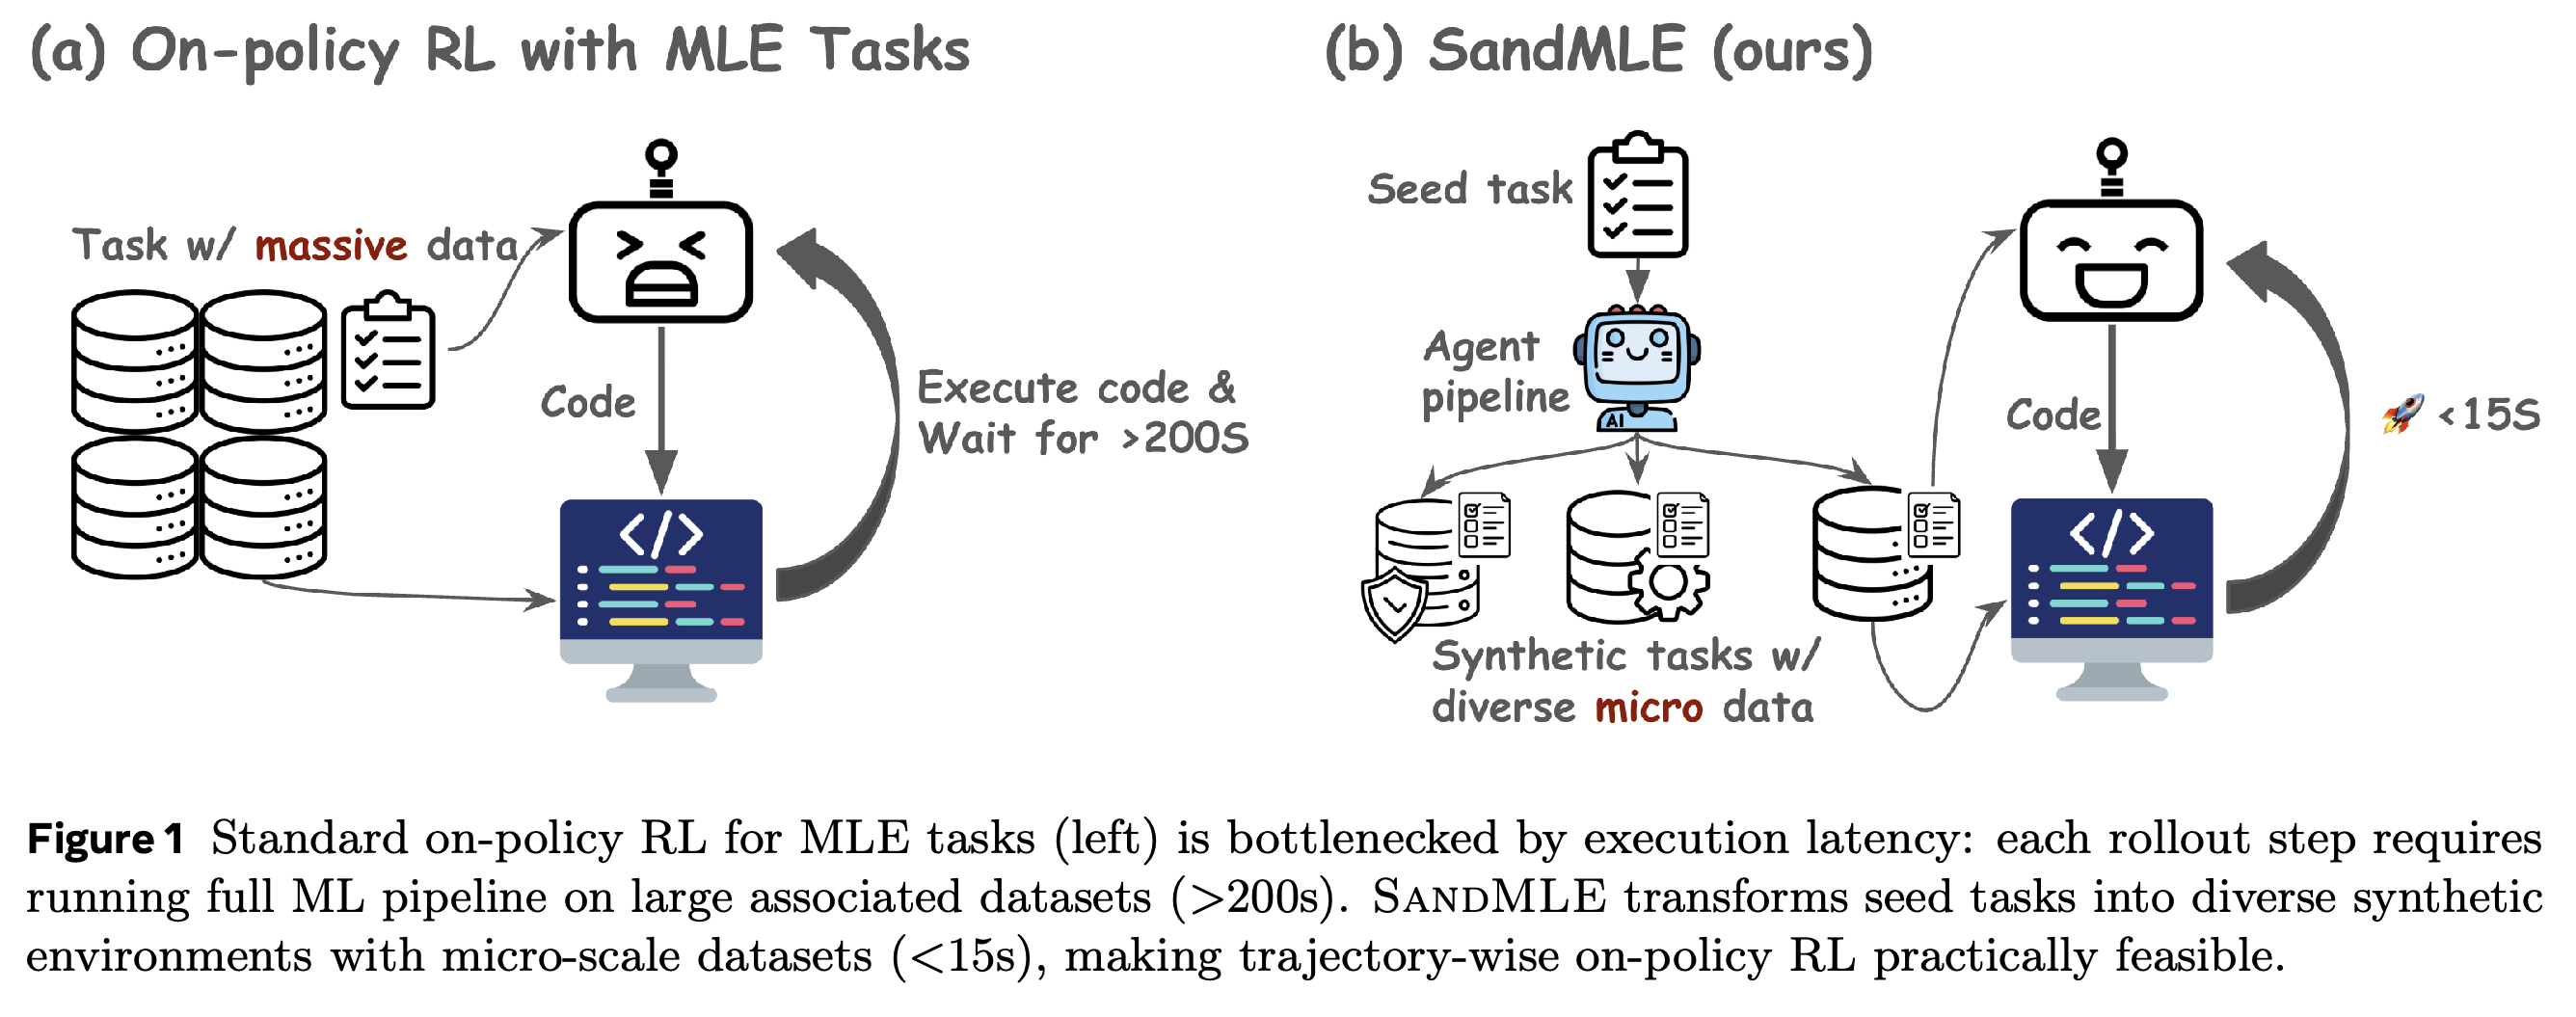
- Figure 1 contrasts real-data and synthetic micro-data interaction loops. Its >200s and <15s labels summarize the proposed difference; the measured averages reported later are 196.17 seconds and 14.31 seconds.
- The contributions are synthetic sandbox generation, trajectory-wise RL with milestone-based rewards, and evaluation beyond the ReAct scaffold used in training.
- SandMLE updates the underlying model policy rather than relying exclusively on inference-time scaffold design.
The diagram locates the bottleneck in repeated code execution and feedback, then shows SandMLE intervening through synthetic task construction. Its >200s and <15s labels summarize the intended latency difference and are distinct from the later measured averages.
2 Related Work
The related work distinguishes inference-time MLE scaffolds from execution-based policy training. SandMLE addresses the environment cost that limits the application of trajectory-level RL to MLE.
2.1 Machine Learning Engineering (MLE) for Agents
MLE-bench provides Kaggle-derived tasks and medal-based evaluation, while MLE-Dojo and MLE-Smith expand available task collections. AIDE, AIRA, ML-Master, R&D Agent, and FM Agent improve inference-time exploration and refinement; the paper emphasizes that their performance depends on scaffold design.
- The cross-framework results illustrate this dependence: Qwen3-14B-Base obtains a HumanRank Score of 9.62 with MLE-Agent and 37.73 with AIDE on MLE-Dojo.
- SandMLE trains model weights and then tests whether the resulting policy transfers to scaffolds absent from its RL rollouts.
2.2 Reinforcement Learning for MLE Agents
Prior trajectory-wise RL work in software engineering and web search learns from execution feedback, but MLE adds repeated model-training and evaluation costs. The authors contrast current-policy SandMLE rollouts with SFT, offline rewards, and asynchronous training that can collect trajectories from older policy states.
- Their rationale is to reduce environment latency rather than hide it through asynchronous execution.
- The experiments compare against Base and Seed-SFT models, not a matched asynchronous MLE RL baseline, so they do not directly measure the benefit of eliminating policy lag.
3 Preliminaries
The preliminaries formalize MLE as finite-horizon interaction with an executable environment and introduce GRPO. Expensive environment calls and rewards determined only after trajectory completion motivate the environment and reward designs.
3.1 MLE as a Sequential Decision Process
An MLE task is represented by (I, T, E): the initial specification, available tools, and execution environment. At each step, the policy conditions on the specification, tools, and prior action–observation pairs, generates an action, and receives execution output, errors, or metrics; the completed submission is scored on hidden test data.
- The Execution-Latency Bottleneck. Each rollout action can invoke preprocessing, training, and inference, making repeated environment calls expensive during on-policy collection.
- Interaction terminates through a designated submission action or a maximum step limit Tmax. Prior real-world MLE evaluations can allow up to 24 hours for one task.
3.2 Reinforcement Learning from Verifiable Rewards (RLVR)
GRPO samples N candidates per input and normalizes their rewards within the group using (\hat{A}_i = \frac{r_i-\mu_r}{\sigma_r}). Its clipped probability-ratio objective favors relatively better candidates without a separate critic; the general formulation includes a reference-policy KL penalty, which SandMLE disables in its implementation.
- Applying GRPO to Multi-turn, Trajectory-level Agentic Tasks. Each candidate is a complete action–observation trajectory rather than a single response, and policy gradients apply only to model-generated action tokens.
- The paper expresses environment-execution cost as O(N · Tmax · cexec) per training example. Reducing cexec lowers collection cost, while milestone thresholds differentiate completed trajectories that would otherwise receive sparse performance feedback.
- Advantages are computed at trajectory level; the method does not introduce a learned value function or turn-specific advantage estimator.
4 SandMLE
SandMLE constructs tasks, data, and evaluators together rather than merely downsampling competition datasets. The authors argue that downsampling existing tasks can disrupt fixed evaluation sets and leaderboard baselines while leaving the number of distinct training tasks unchanged.
- Synthetic construction permits coordinated design of hidden rules, data scale, baseline thresholds, and submission schemas.
- The real-task evaluations test whether these small environments teach behaviors useful on unseen competitions.
4.1 Synthetic Environment Generation
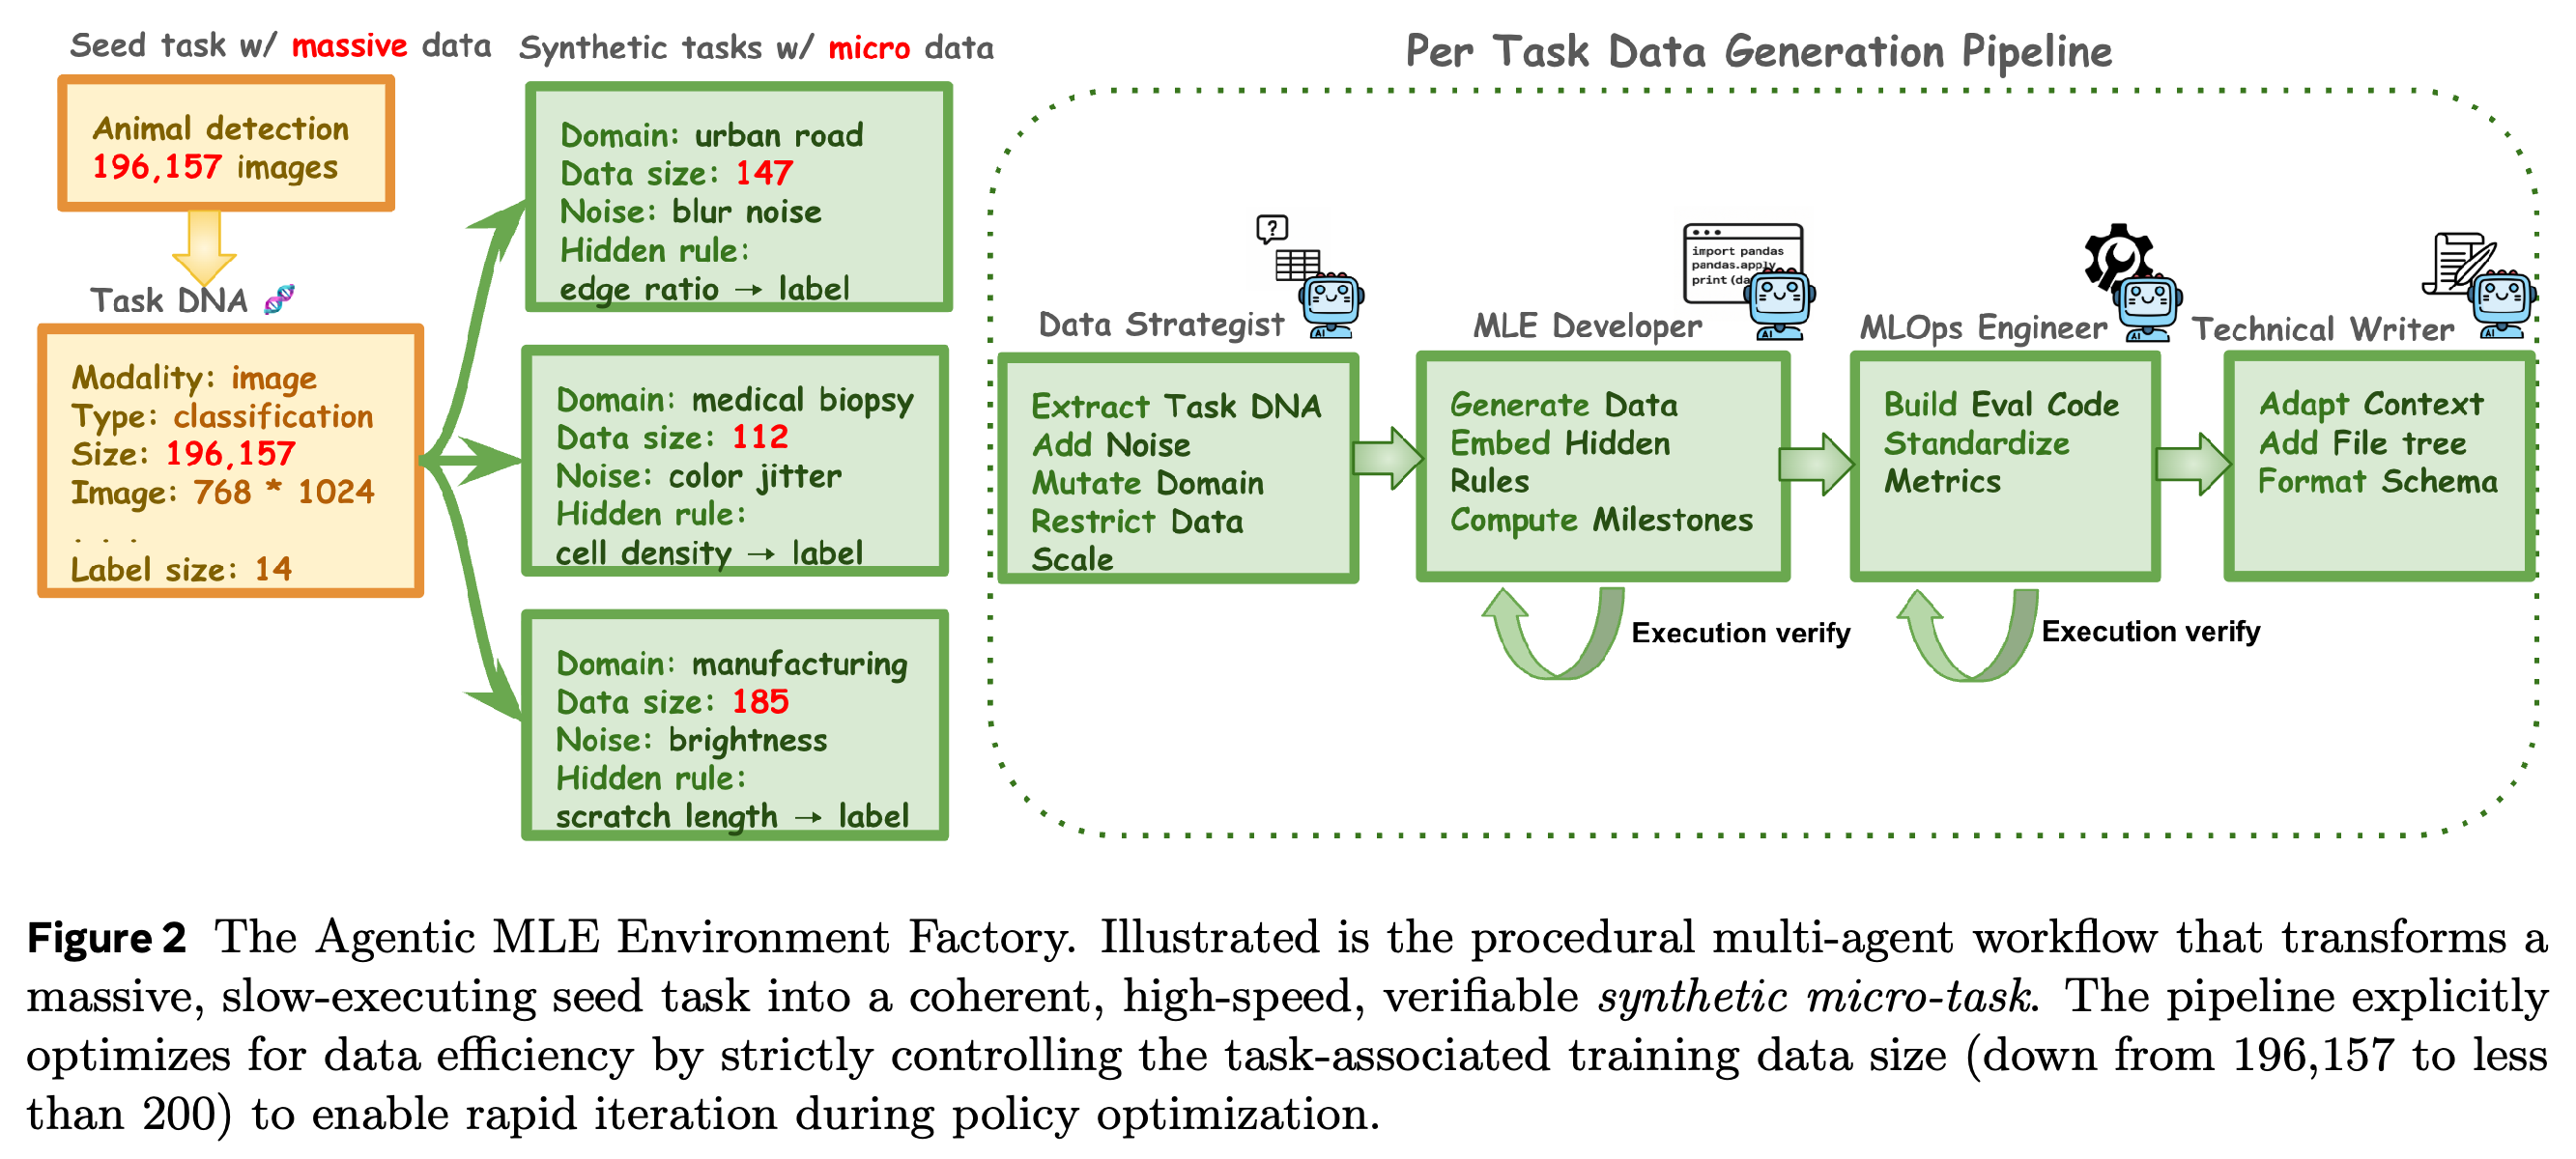
Pipeline Overview. The environment factory transforms seeds through task amplification and specification, agentic data generation, evaluation environment setup, and task description synthesis. Figure 2 shows the coordinated workflow and execution-based repair loops for generated data and evaluator scripts.
- Data Strategist: Seed Task Amplification and Specification. The agent extracts structural Task DNA, maps it to another application domain, injects modality-appropriate noise, and compiles a specification with a hidden rule (H:\ l=f(z)+\epsilon). It targets 50–200 samples and proposes baseline methods of increasing complexity.
- ML Developer: Synthetic Data Generation. A self-contained Python script generates assets and train/test partitions, implements hidden labeling rules, evaluates baseline methods to establish milestone thresholds, and produces a dummy sample submission. Failed executions are returned for debugging.
- MLOps Engineer: Evaluation Environment Setup. The evaluator fixes the metric, optimization direction, and thresholds, aligns predictions with hidden labels, and computes the score. It is tested against the dummy submission and repaired after execution failures.
- Technical Writer: Task Description Synthesis. The markdown description aligns the scenario, data formats, evaluation metric, and submission schema with generated files. Its public file listing omits hidden answers.
A 196,157-image seed is abstracted into Task DNA and expanded into examples with 147, 112, and 185 samples. The four-role workflow coordinates data, hidden rules, milestone thresholds, evaluation code, and documentation, with execution-verification loops at the developer and evaluator stages.
4.2 Environment Sanity Verification
Environment sanity verification rejects tasks whose milestone thresholds are not strictly ordered according to the metric’s optimization direction. With s1 denoting the strongest threshold and sk the weakest, lower-is-better tasks require s1 < s2 < ··· < sk and s1 < ssample; higher-is-better tasks require the reversed inequalities.
- The comparison with ssample requires the strongest threshold to improve on the dummy submission’s score.
- This check establishes threshold consistency, not exhaustive solvability, freedom from shortcuts, or equivalence to real-world task difficulty.
4.3 Trajectory-Level GRPO
Enable On-policy RL for MLE Tasks. ReAct rollouts alternate generated reasoning or code actions with environment feedback, subject to a per-step execution limit and maximum trajectory length. A trajectory ends with a final submission, the step limit, or a terminal error.
- Dense Reward Formulation. The trajectory reward is r = wformat · rformat + wexecute · Iexecute + Σ_i wsi · Isi. The format term measures the fraction of steps using <think>…</think> tags; the remaining terms indicate valid output generation and final-score threshold achievements.
- Weights sum to 1.0 and provide partial credit instead of requiring the highest performance tier. Although called dense, the execution and performance indicators evaluate the final environment state rather than assigning a separate performance reward at every turn.
- Selective Masking for Backpropagation. Loss applies to generated reasoning and action tokens, not observations or prompts. Entire trajectories whose code execution exceeds the time limit are masked.
5 Experiments
The experiments measure synthetic-environment execution efficiency, real-task performance, test-time scaling, and training behavior. The subsequent analysis evaluates transfer to alternative scaffolds and compares milestone-based rewards with a sparse formulation.
5.1 Experimental Setup
Dataset. Sixty MLE-bench questions from the Medium, Hard, and Dev splits seed the generation pipeline, yielding 848 synthetic training tasks and 64 held-out synthetic validation tasks. Real-world evaluation uses 22 unseen Easy-split questions in MLE-Bench-Lite and 62 additional MLE-Dojo tasks.
- Evaluation Metrics. MLE-Bench-Lite reports Valid Submission, Above Median, Bronze, Silver, Gold, and Any Medal, with Any Medal as the primary metric. MLE-Dojo reports submission validity and HumanRank Score.
- Agent Scaffolds. Training uses ReAct. Evaluation uses ReAct, AIRA, and AIDE on MLE-Bench-Lite, and MLE-Agent and AIDE on MLE-Dojo.
- Models and Baselines. Models are Qwen3-8B, Qwen3-14B, and Qwen3-30B-A3B-2507. Base is the original checkpoint; Seed-SFT learns from Claude-4.5-Sonnet trajectories on the 60 seeds; SandMLE applies GRPO from Base; SFT-SandMLE applies GRPO from Seed-SFT.
- Implementation Details. Reward weights are wformat = 0.1, wexecute = 0.3, wsmedian = 0.1, wsbronze = 0.2, wssilver = 0.2, and wsgold = 0.1. Training limits are Tmax = 20 and τmax = 90 seconds.
- Appendix A.2 specifies RLLM, group size n = 4, rollout temperature 1.0, learning rate 1 × 10⁻⁶, batch size 16, clipping ratio 0.28, and no KL penalty. Each task receives one NVIDIA H200 GPU; evaluation generation temperature is 0.0.
5.2 Statistics of Synthetic Training Data
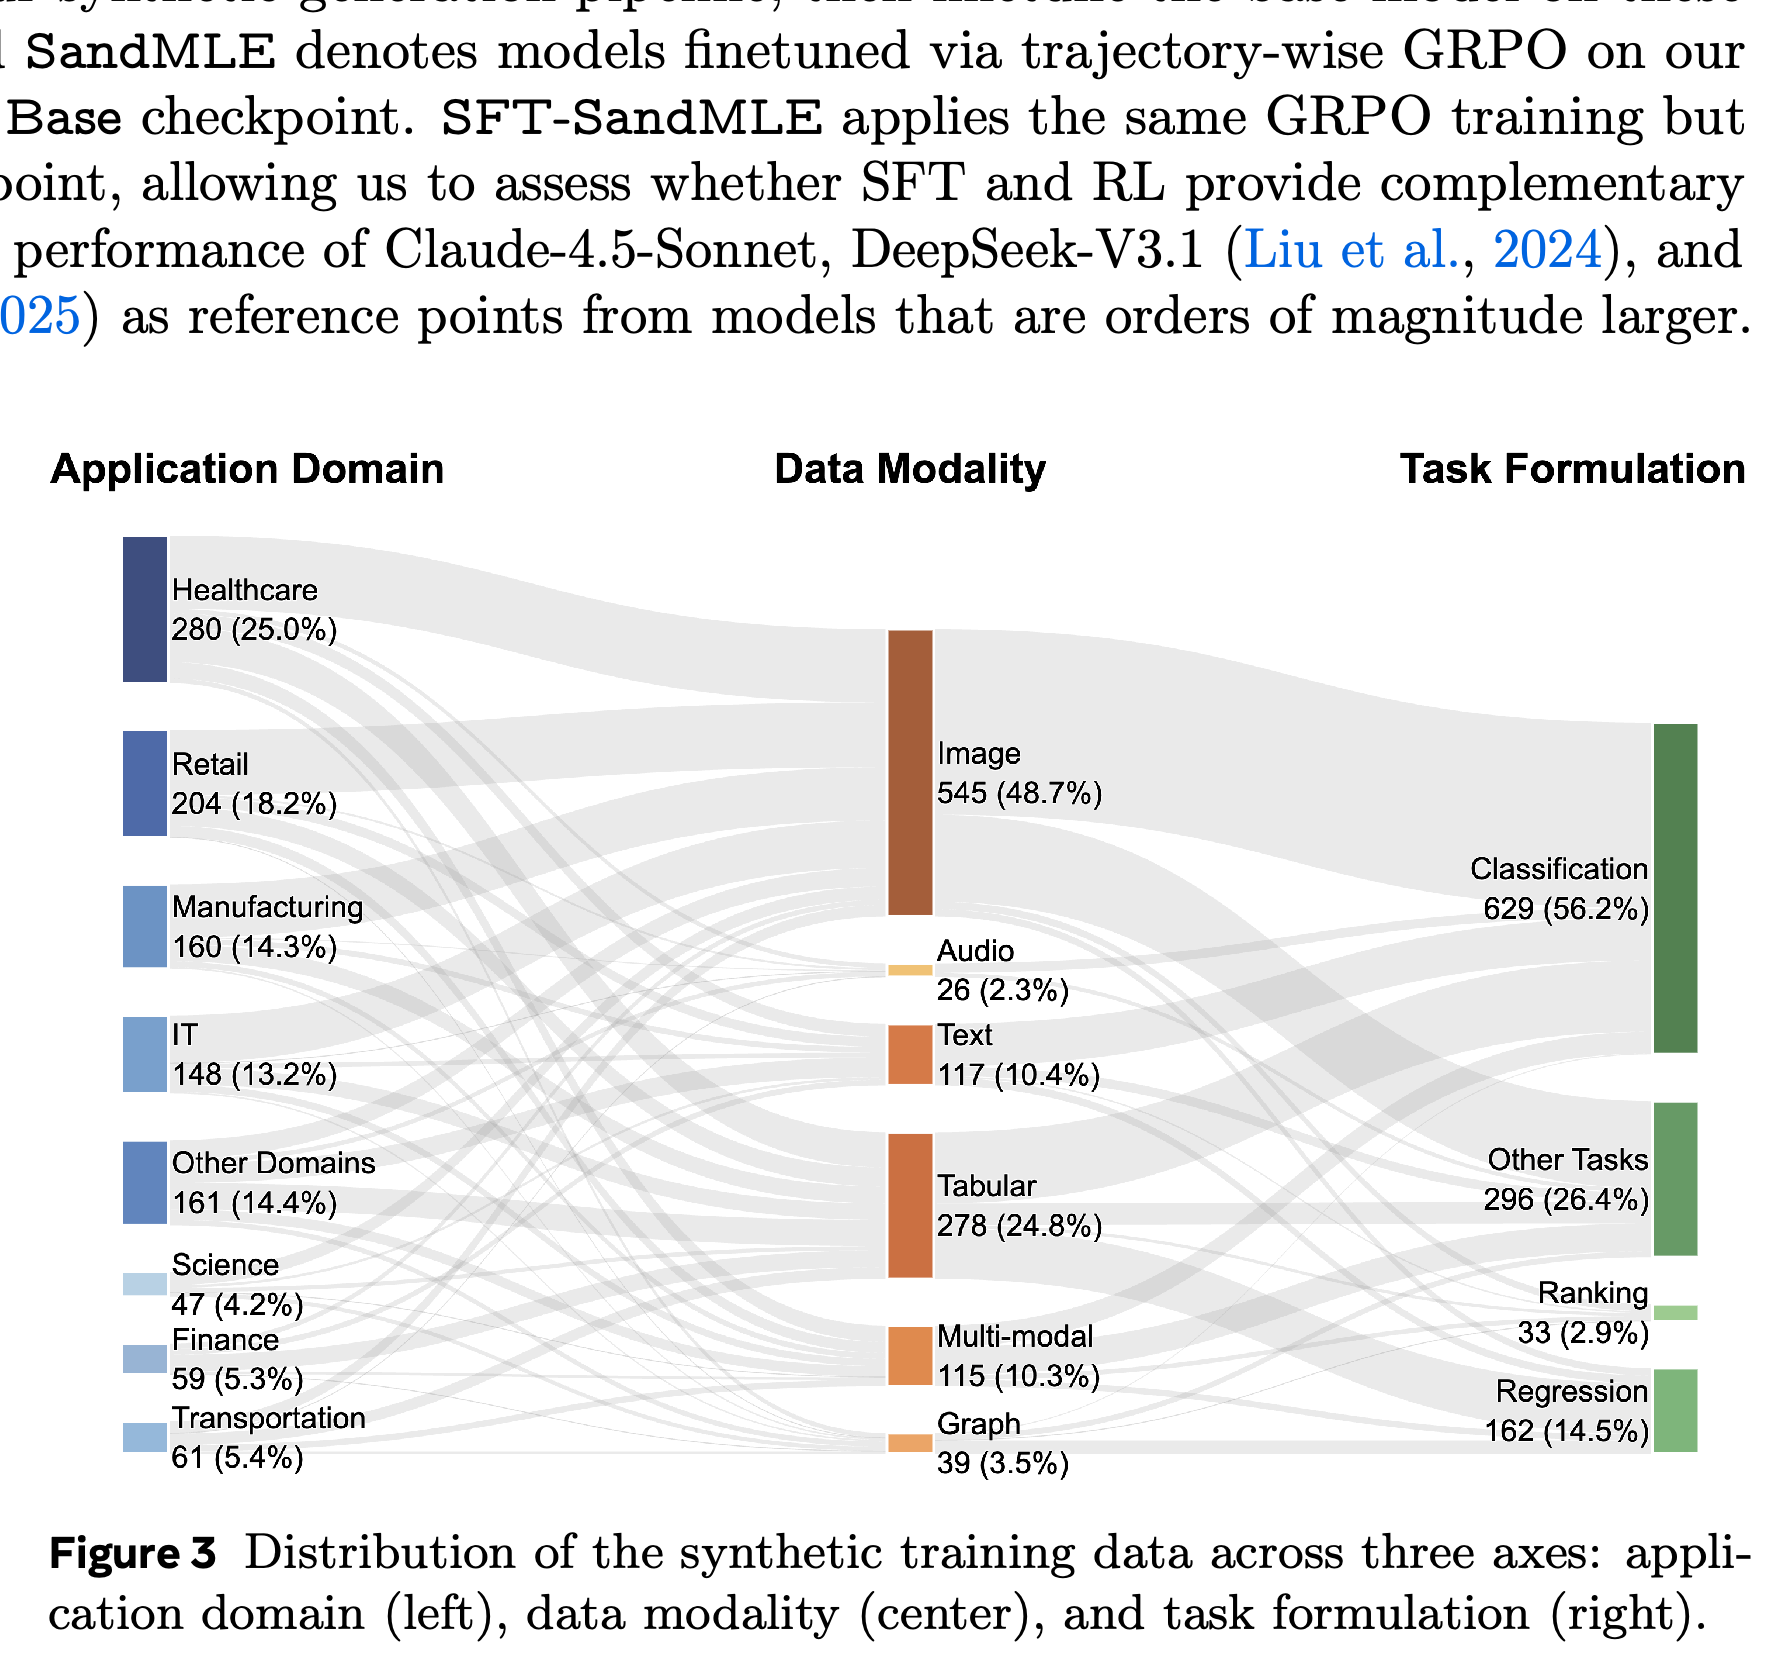
The generated tasks cover multiple application domains, modalities, and formulations, with images and classification forming the largest groups. Figures 3–6 report composition, pairwise model performance, dataset sizes, and execution latency.
- Domain, Modality, and Tasks. Healthcare accounts for 25.0%, retail 18.2%, manufacturing 14.3%, and IT 13.2%. Modalities are image 48.7%, tabular 24.8%, text 10.4%, multi-modal 10.3%, graph 3.5%, and audio 2.3%; formulations are classification 56.2%, regression 14.5%, ranking 2.9%, and other tasks 26.4%.
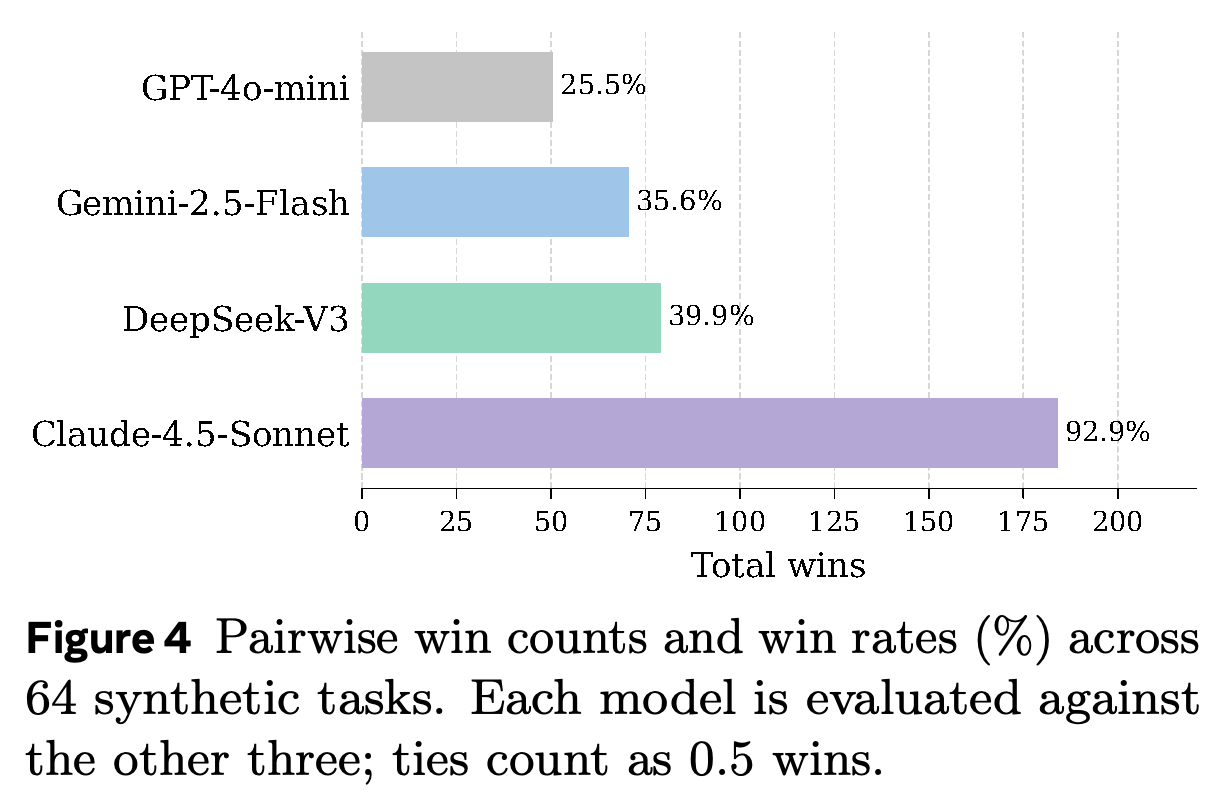
- Task Reliability and Difficulty Calibration. On 64 randomly sampled synthetic tasks, comparisons against three other models count wins as 1 and ties as 0.5. Win rates are 92.9% for Claude-4.5-Sonnet, 39.9% for DeepSeek-V3, 35.6% for Gemini-2.5-Flash, and 25.5% for GPT-4o-mini.
- These results show that the tasks discriminate among the tested models; they do not independently calibrate synthetic difficulty against real competition difficulty.
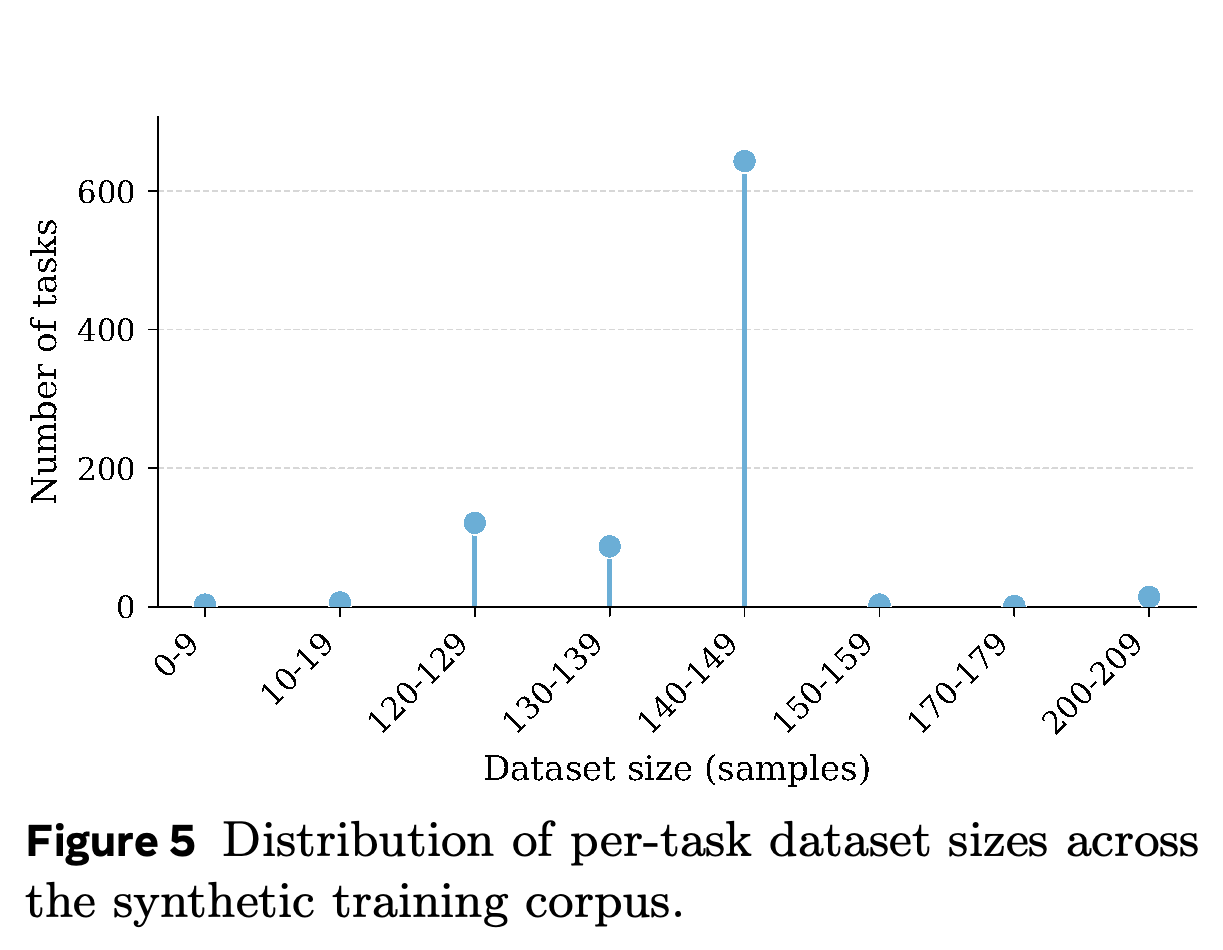
- Dataset Scale and Execution Latency. Most tasks contain 120–150 samples, compared with approximately 4.09 million samples per original seed task on average. For Gemini-2.5-Flash-generated implementations, average execution time falls from 196.17 seconds to 14.31 seconds, a reported 13.7× speedup.
- Figure 3’s modality counts total 1119 tasks, exceeding the final 912-task corpus. This matches the post-data-generation count in Appendix C, but the PDF does not explicitly identify the figure’s filtering stage; its percentages should not be assumed to describe the final 848-task training split.
The flows show cross-domain diversity alongside a concentration in images and classification. Modality counts total 1119 tasks, matching an intermediate generation count rather than the final 912-task corpus; the PDF does not explicitly establish which filtering stage the figure represents.
Pairwise comparisons on 64 synthetic tasks yield win rates of 92.9%, 39.9%, 35.6%, and 25.5% for Claude-4.5-Sonnet, DeepSeek-V3, Gemini-2.5-Flash, and GPT-4o-mini. The ordering shows discrimination among these models, not direct calibration against real competition difficulty.
The 140–149-sample bin dominates, consistent with the text's statement that most tasks contain 120–150 samples. Small counts also appear in the 0–9 and 10–19 bins, below the nominal design range; the 200–209 bin extends beyond that range but does not establish whether its tasks exceed 200 samples.
For Gemini-2.5-Flash-generated implementations, average execution time is 196.17 seconds on original seed tasks and 14.31 seconds on synthetic tasks, a reported 13.7× speedup. The measurement concerns code execution, not end-to-end training cost including environment generation, model inference, and optimization.
5.3 Main Results
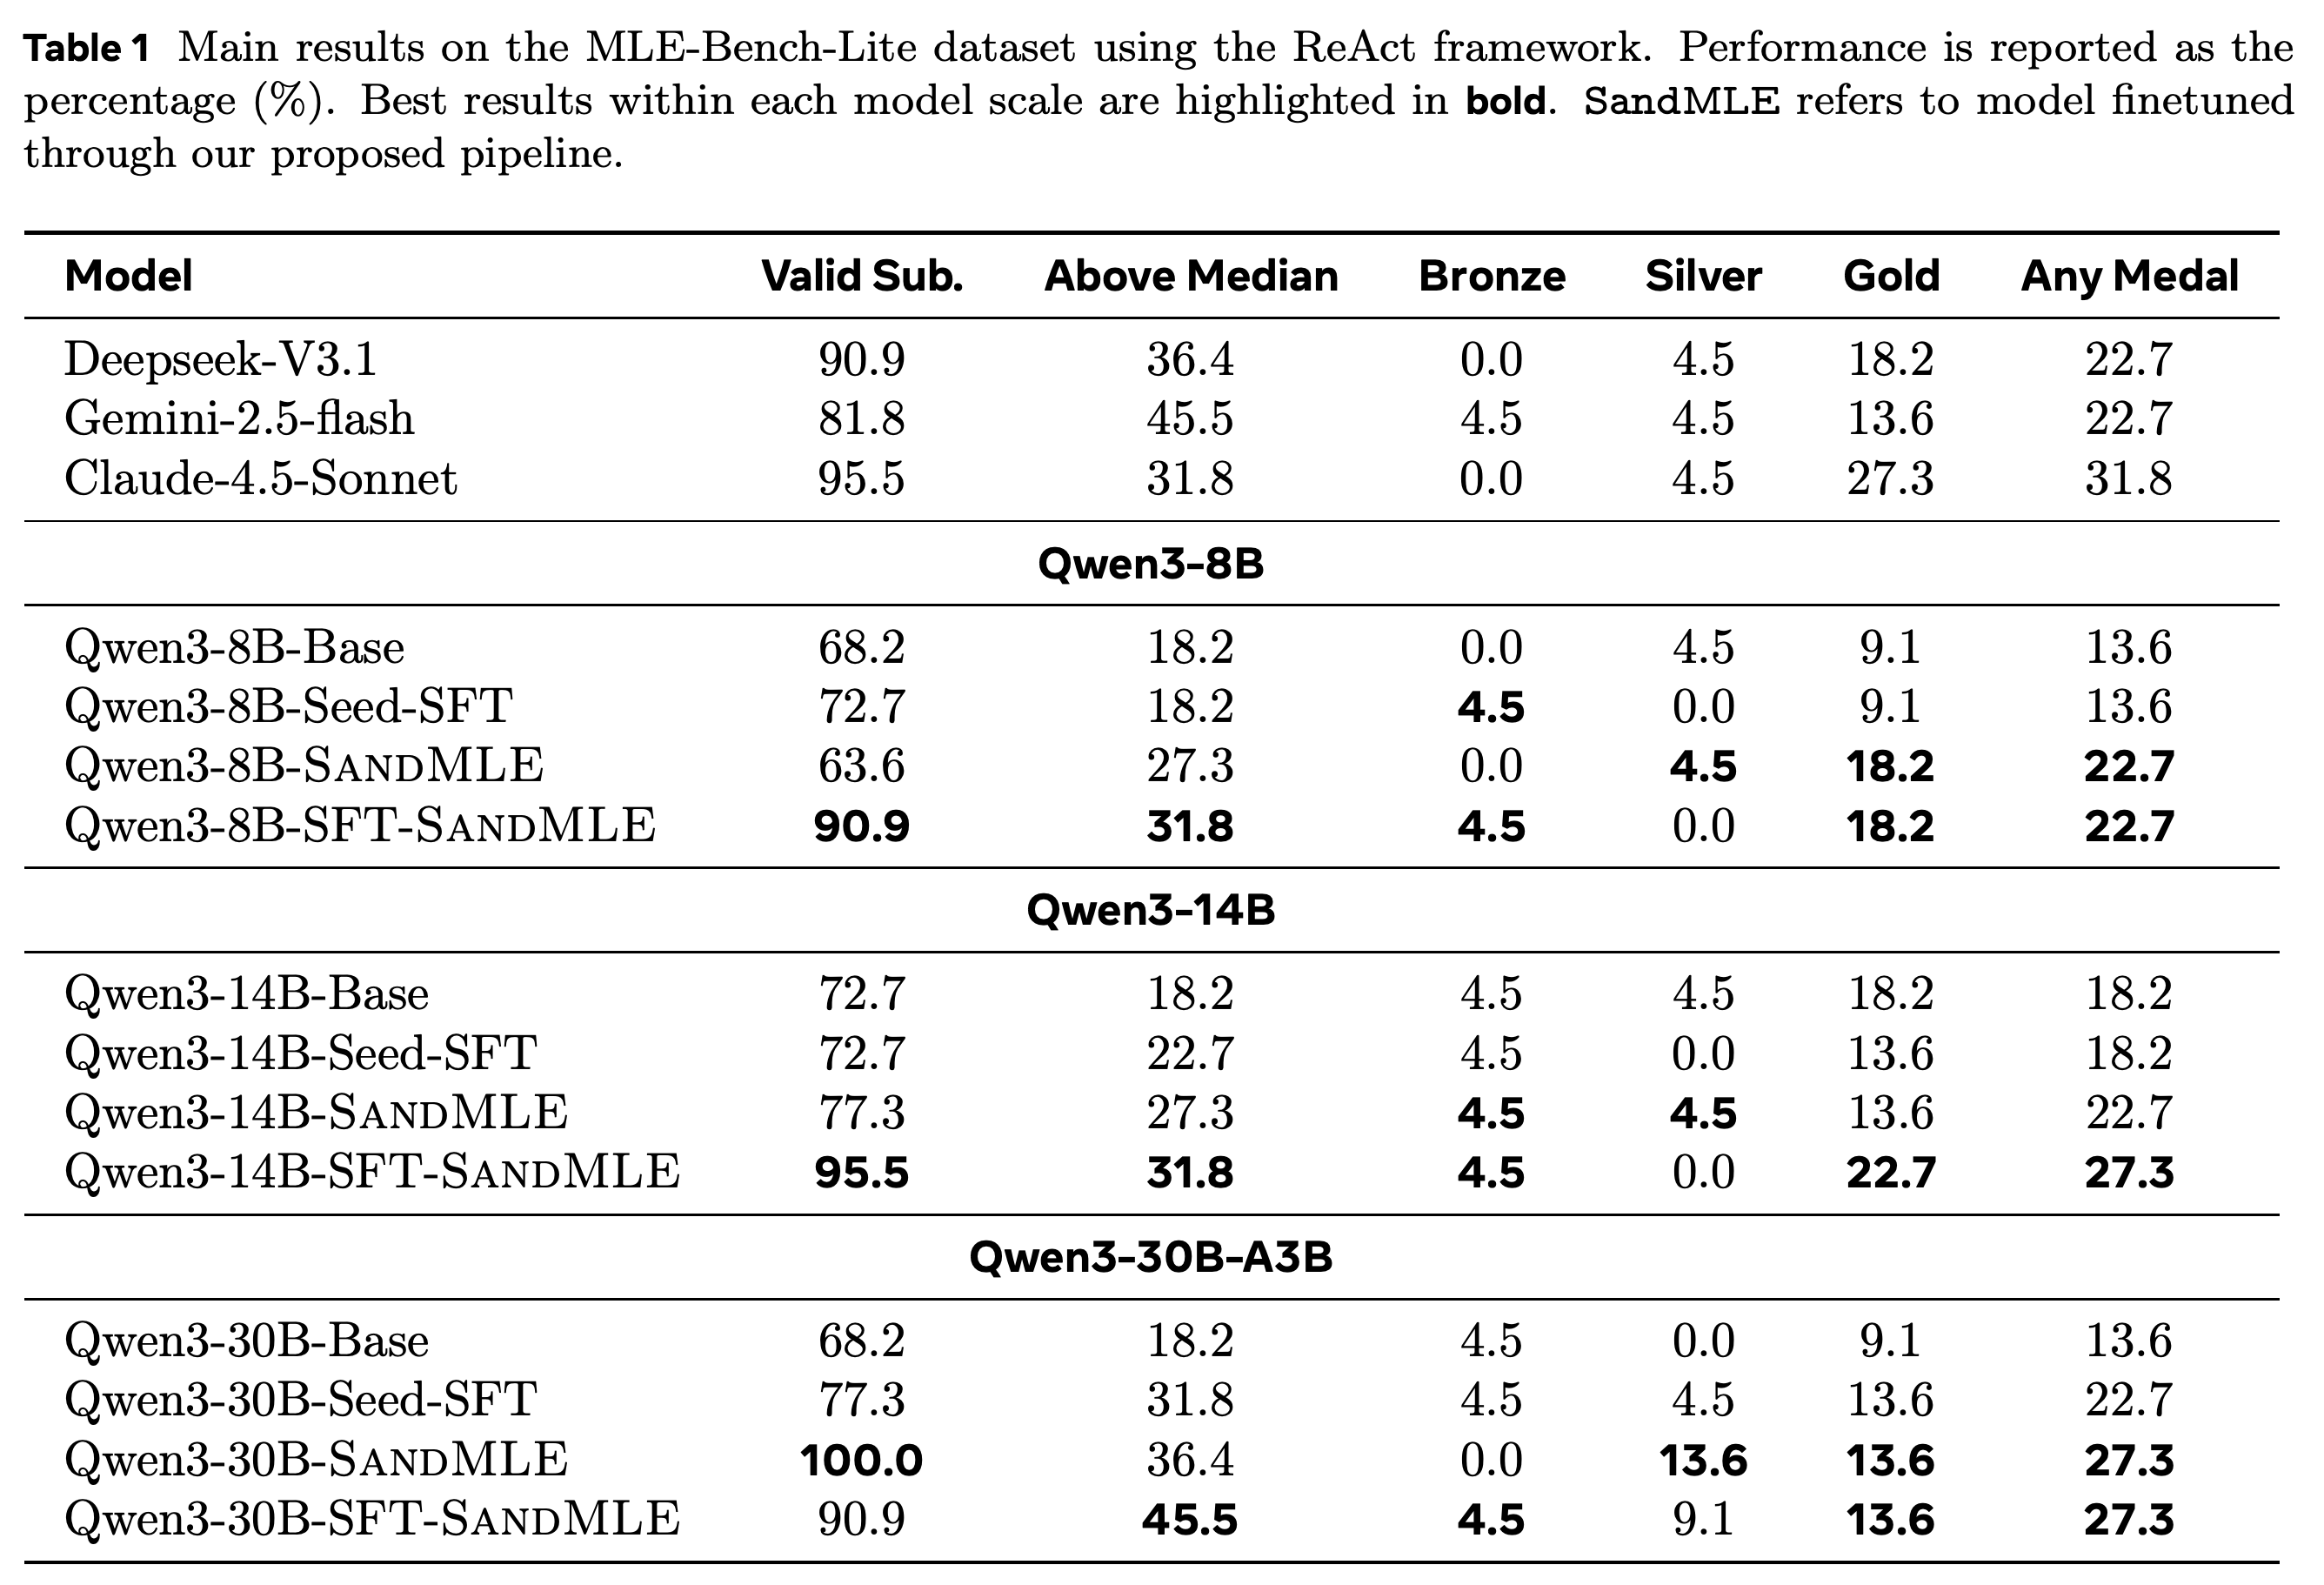
Comparison with Baselines. Table 1 reports pure SandMLE Any Medal rates of 22.7%, 22.7%, and 27.3% at 8B, 14B, and 30B, compared with Base rates of 13.6%, 18.2%, and 13.6%. The paper reports relative improvements of 66.9%, 24.7%, and 100.7% over Base and a range of 20.3%–66.9% over Seed-SFT.
- Seed-SFT Any Medal rates are 13.6%, 18.2%, and 22.7% in the table. The 30B result contradicts the accompanying statement that its Seed-SFT rate remains at 13.6%; the table supports a substantial 30B SFT gain over Base.
- Combining SFT and RL. Relative to pure SandMLE, SFT-SandMLE raises 8B Valid Submission from 63.6% to 90.9% without changing the 22.7% medal rate. At 14B, validity rises from 77.3% to 95.5% and medals from 22.7% to 27.3%; at 30B, validity falls from 100.0% to 90.9% while medals remain at 27.3%.
- Scaling with Model Sizes. Pure SandMLE validity rises from 63.6% to 77.3% to 100.0%, and Above Median rises from 27.3% at 8B to 36.4% at 30B. These are trends within the tested model family, not evidence of a universal scaling law.
- The 8B SandMLE medal rate matches the 22.7% reference results for Deepseek-V3.1 and Gemini-2.5-flash. Claude-4.5-Sonnet reaches 31.8%, exceeding every tested SandMLE variant in Table 1.
- The Qwen3-14B-Base row reports 4.5% Bronze, 4.5% Silver, and 18.2% Gold but 18.2% Any Medal. Unlike most rows, these entries do not add to Any Medal; the PDF does not explain the tier-counting convention or reconcile this row.
- Tables 2 and 3 extend evaluation to other scaffolds. Section 6.1 discusses both improvements and unchanged primary metrics.
Synthetic RL raises Any Medal rates over Base at all three scales, but SFT initialization has size-dependent effects on validity. The table contradicts the narrative's 30B Seed-SFT medal rate; the 14B Base medal entries also do not add to Any Medal, unlike most rows.
5.4 Test-Time Scaling of SandMLE Models
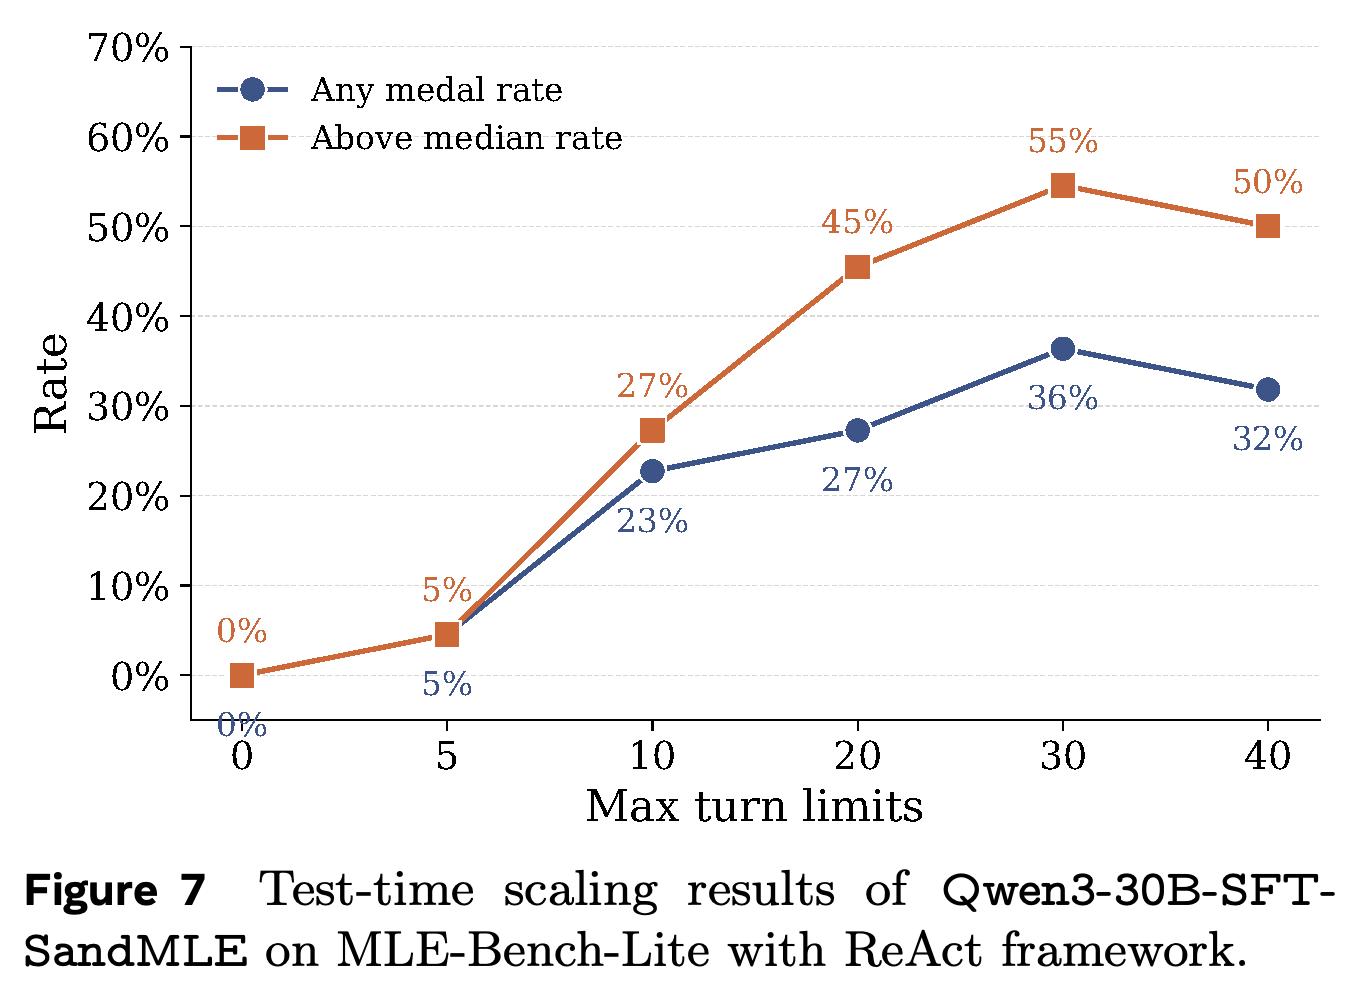
For Qwen3-30B-SFT-SandMLE with ReAct, the maximum compute budget remains 24 GPU hours per task while the allowed turn count varies. Figure 7 shows Any Medal and Above Median reaching their plotted maxima of 36% and 55% at 30 turns, then falling to 32% and 50% at 40 turns.
- At turn limits 0, 5, 10, 20, 30, and 40, plotted Any Medal rates are 0%, 5%, 23%, 27%, 36%, and 32%; Above Median rates are 0%, 5%, 27%, 45%, 55%, and 50%.
- When context capacity is reached, older messages containing failed executions are removed. The authors attribute the decline beyond 30 turns to context loss and repetitive loops despite this eviction strategy.
- The experiment demonstrates benefits from additional iteration up to 30 turns, but does not isolate context loss from other possible causes of the subsequent decline.
Under a fixed 24 GPU-hour maximum budget, the plotted metrics improve through 30 turns, where Any Medal reaches 36% and Above Median reaches 55%. Both decline at 40 turns; the authors attribute this to context overflow and lost execution history, without a controlled test of that explanation.
5.5 Training Dynamics
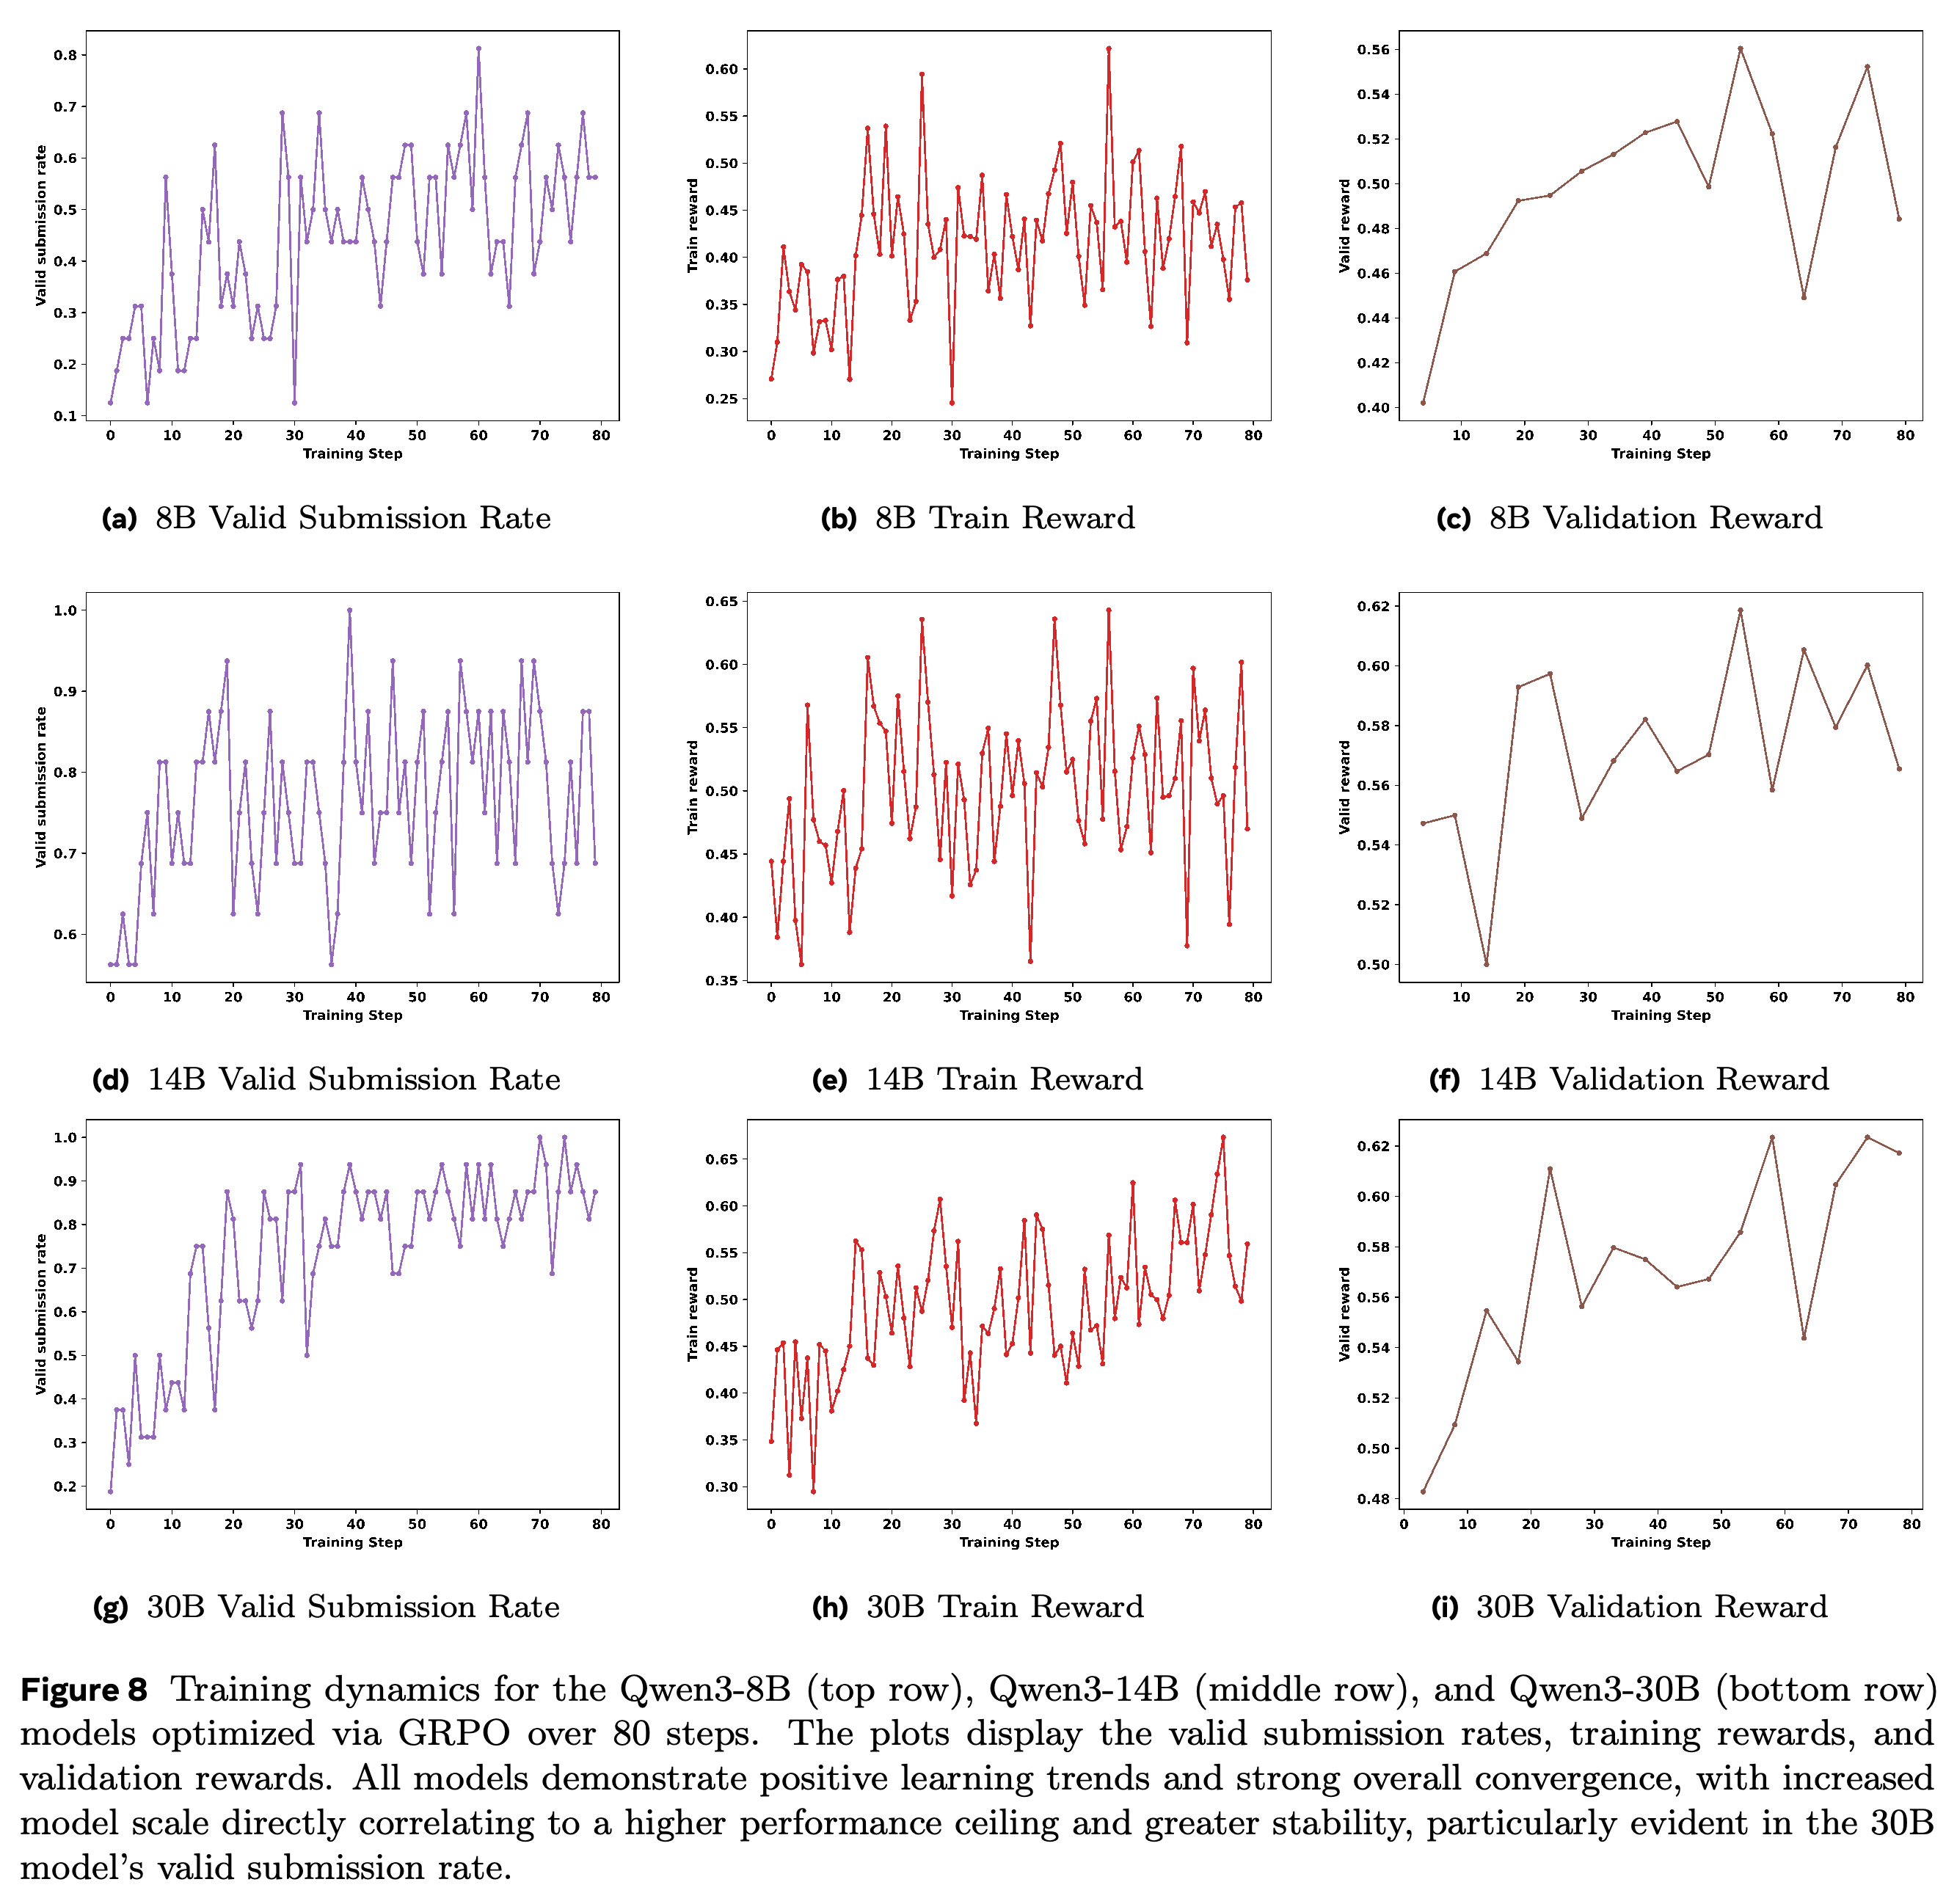
Training and validation rewards generally improve across the three model scales, but individual curves fluctuate substantially. Figure 8 shows greater late-training submission reliability for the 30B model than for the smaller models.
- Appendix B.1 describes training-reward peaks near 0.67 for 30B and 0.62 for 14B, with 8B submission rates fluctuating between approximately 0.1 and 0.8. The plotted 14B training curve reaches roughly 0.65, so the appendix’s peak description is approximate.
- These curves measure learning on synthetic environments, not real-task generalization throughout training.
- Appendix A.2 specifies 100 training steps, whereas Figure 8 and Appendix B.1 describe 80-step curves. The PDF does not explain the difference.
The nine panels show generally improving rewards over 80 steps with substantial fluctuations, rather than uniformly smooth convergence. Late-training submission validity is more reliable for 30B than for the smaller models; the plotted duration differs from the 100-step setup in Appendix A.2.
6 Analysis
The analysis tests transfer from ReAct training to other agent architectures and compares progressive achievement rewards with a sparse alternative. It does not ablate dataset size, domain mutation, hidden-rule complexity, or individual generation roles.
6.1 Framework Generalization
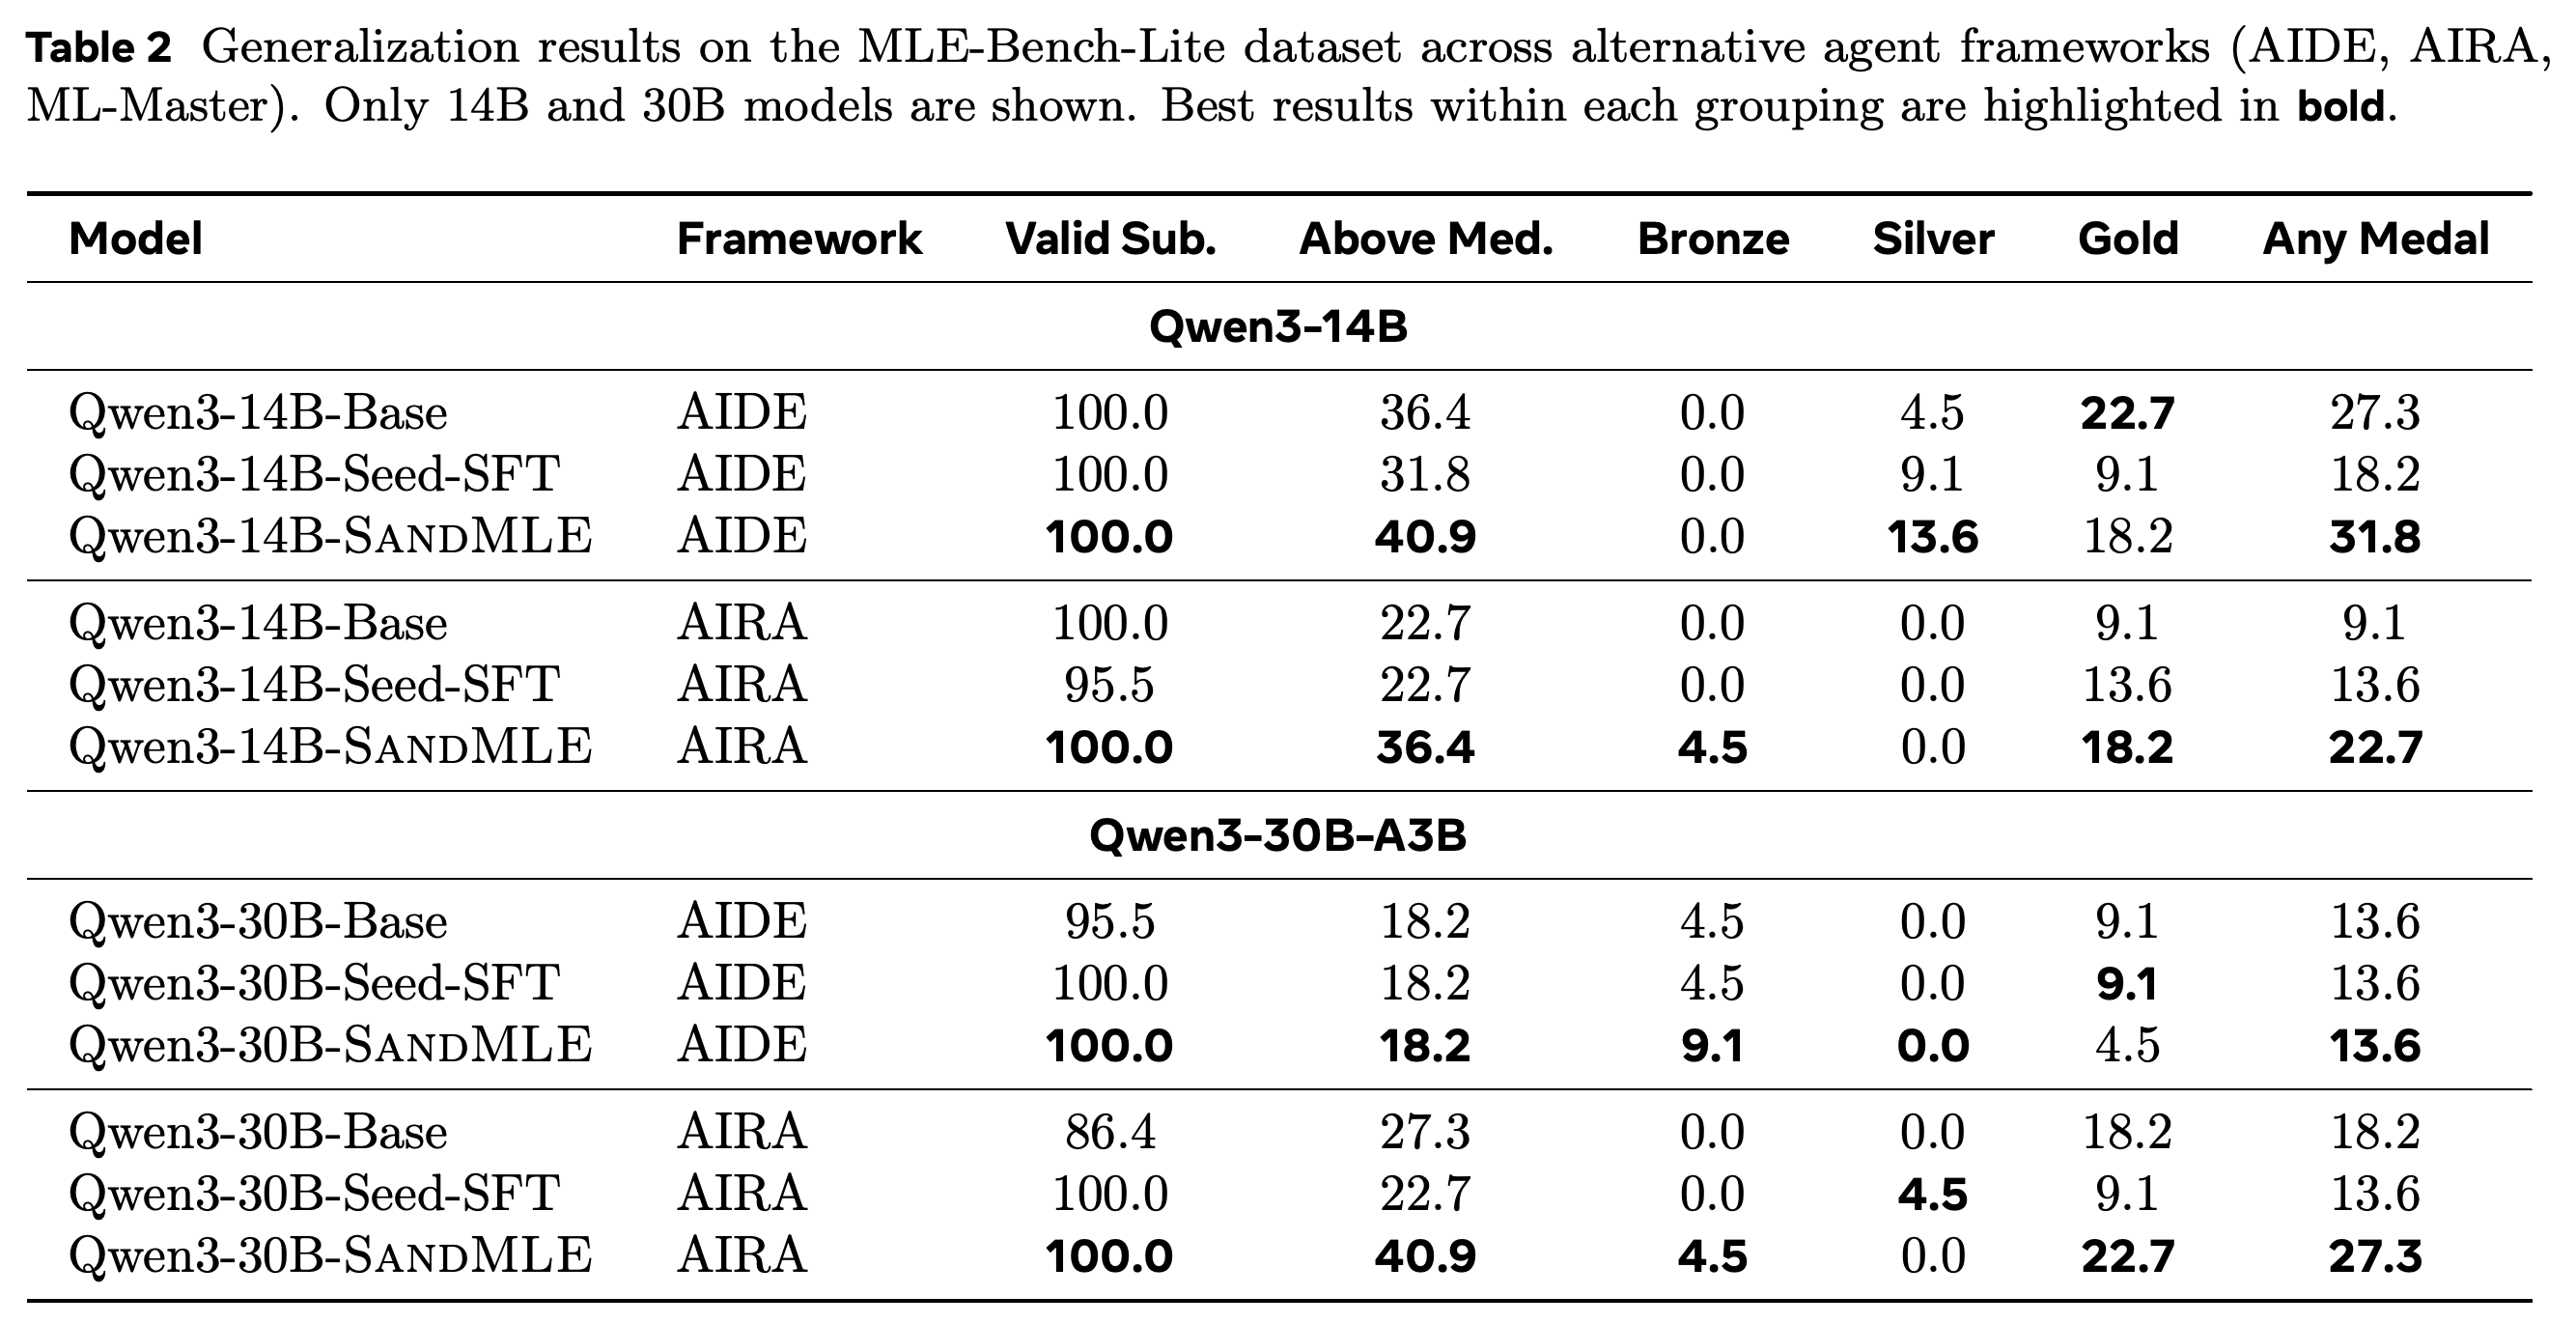
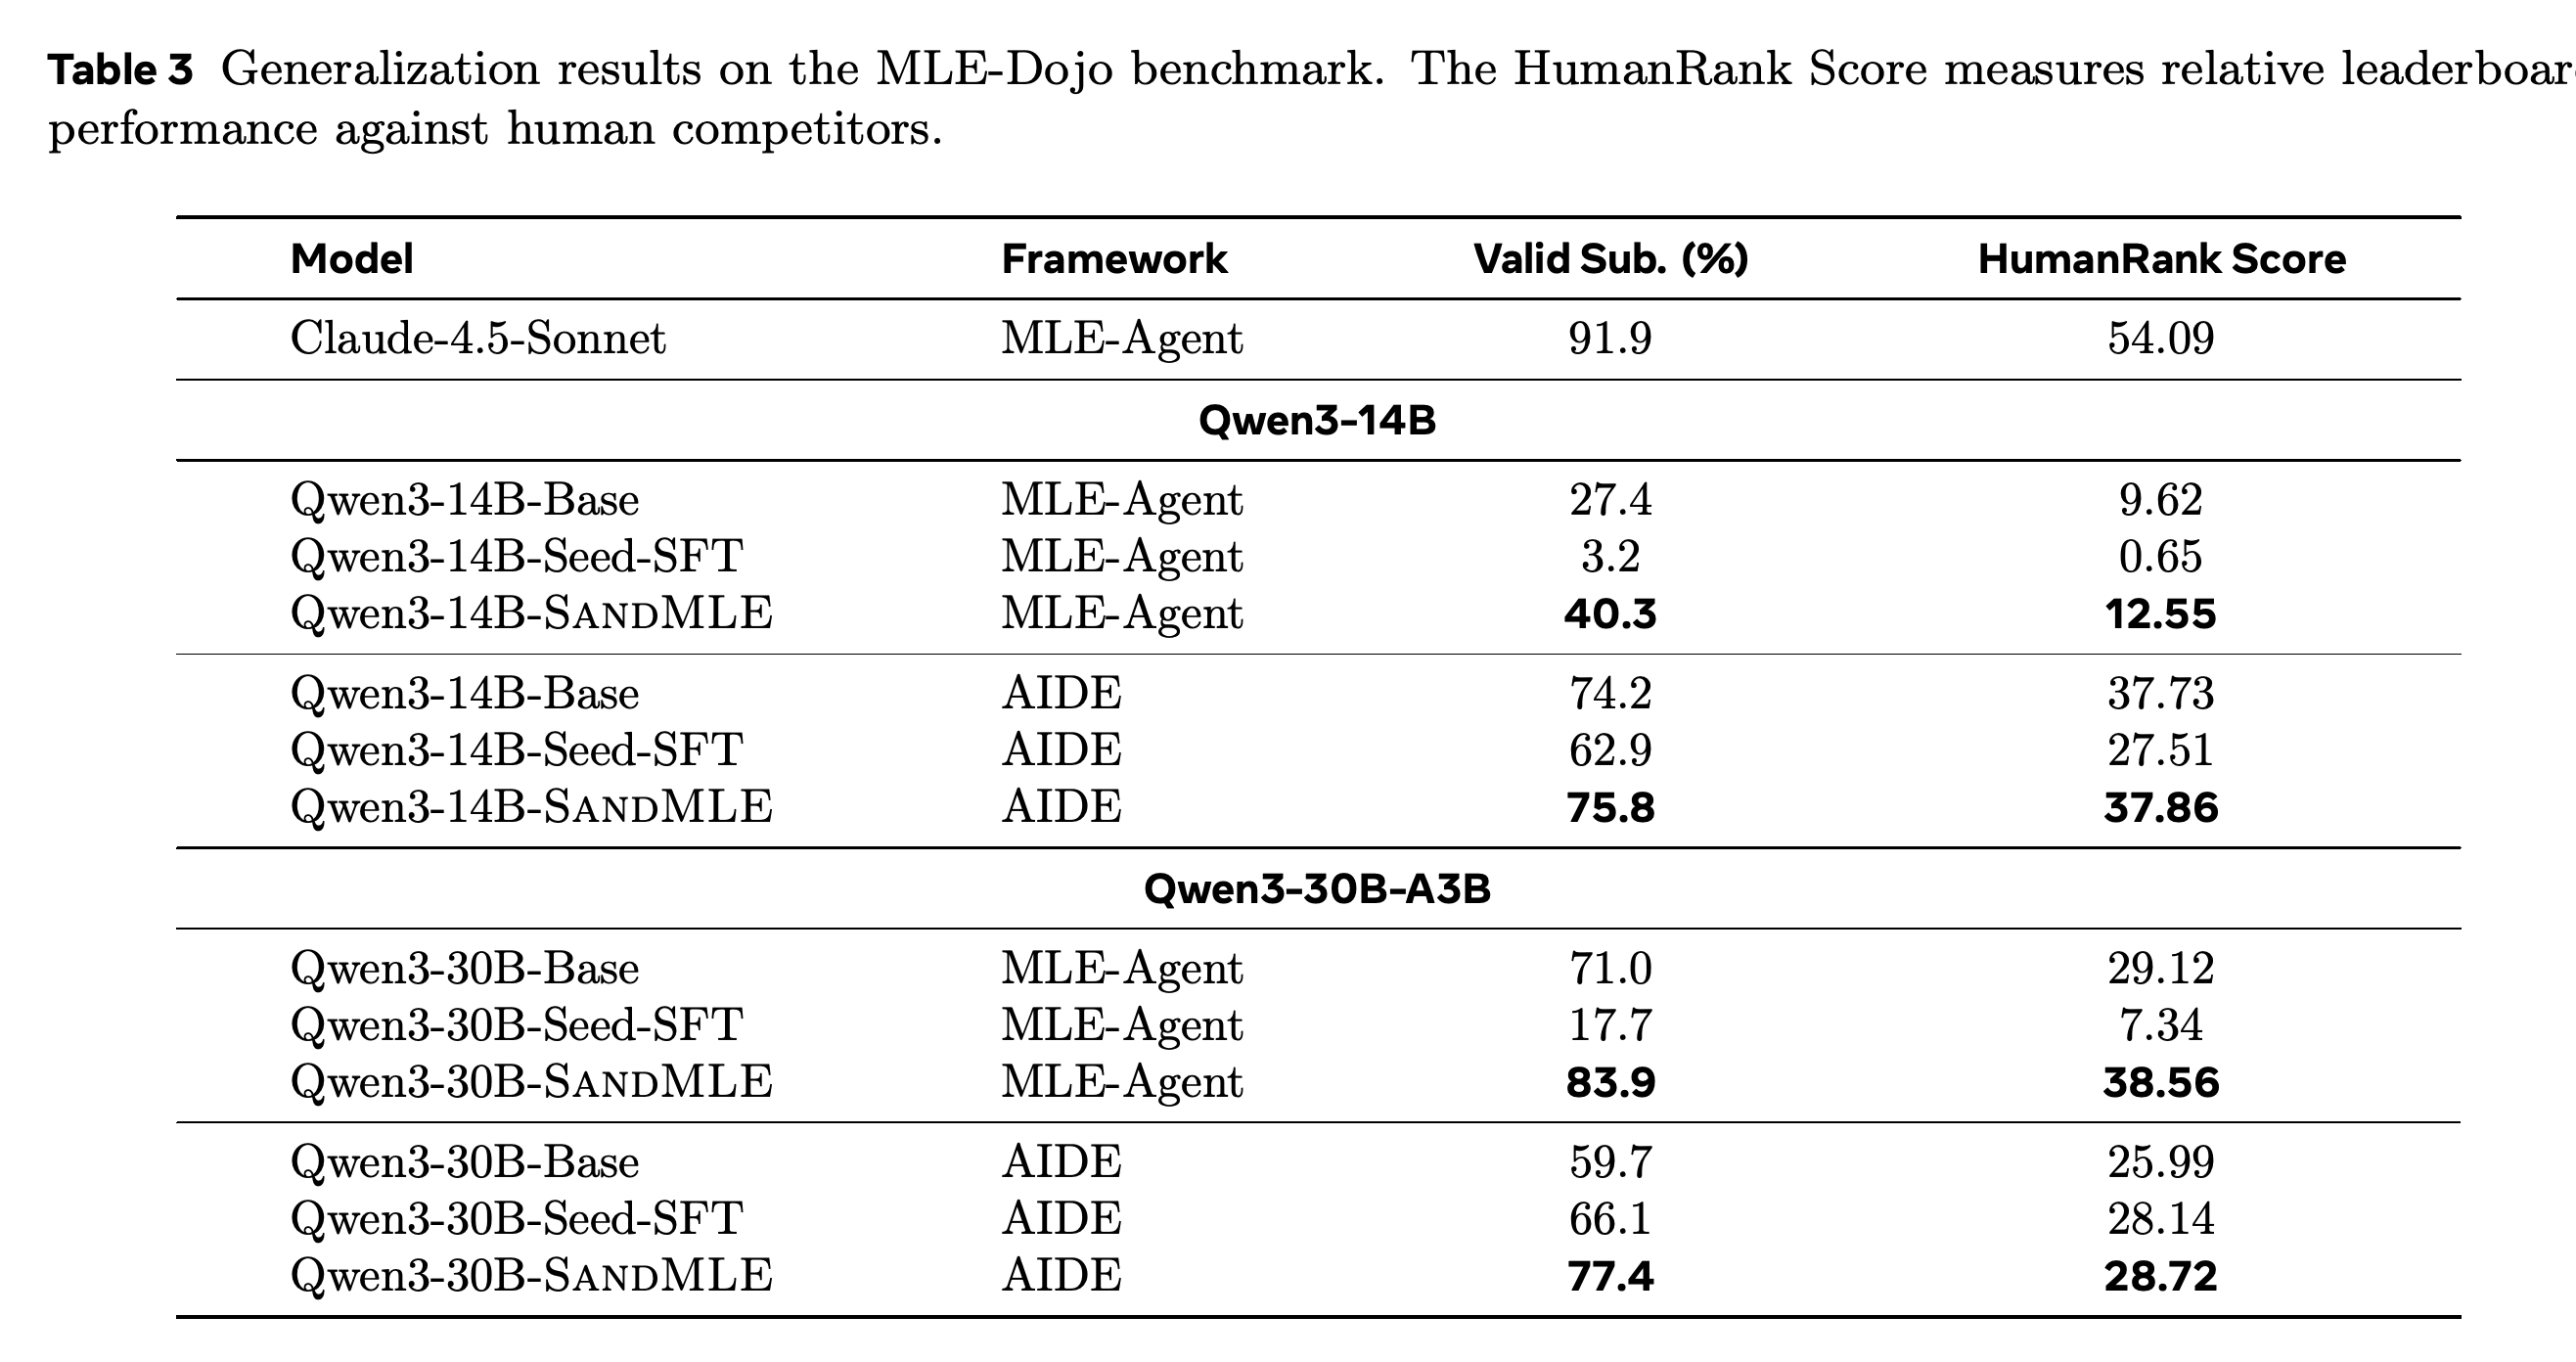
Framework Generalization. SandMLE transfers to AIDE and AIRA on MLE-Bench-Lite and to MLE-Agent and AIDE on MLE-Dojo. Tables 2 and 3 show gains in several settings, but do not support the stronger claim that primary metrics improve in every scaffold–benchmark combination.
- On MLE-Bench-Lite, 14B Any Medal rises from 27.3% to 31.8% with AIDE and from 9.1% to 22.7% with AIRA. At 30B, AIRA improves from 18.2% to 27.3%, while AIDE remains at 13.6% for Base, Seed-SFT, and SandMLE.
- With MLE-Agent on MLE-Dojo, 14B HumanRank rises from 9.62 to 12.55 and Valid Submission from 27.4% to 40.3%. At 30B, HumanRank rises from 29.12 to 38.56 and validity from 71.0% to 83.9%, corresponding to the reported approximately 32.4% relative HumanRank gain.
- With AIDE on MLE-Dojo, 14B HumanRank changes from 37.73 to 37.86 and 30B from 25.99 to 28.72. Absolute performance therefore remains strongly scaffold-dependent.
- Seed-SFT is brittle with MLE-Agent: validity is 3.2% at 14B and 17.7% at 30B, below the corresponding Base rates. SandMLE transfers better than this specific SFT baseline.
- Table 2’s caption lists ML-Master, but the displayed rows contain only AIDE and AIRA; it provides no ML-Master result.
SandMLE improves 14B medal rates under AIDE and AIRA and improves 30B under AIRA. The 30B AIDE Any Medal rate remains 13.6% across all three variants, an exception to uniformly improved primary-metric performance; no ML-Master rows appear despite its inclusion in the source caption.
The 30B MLE-Agent HumanRank result rises from 29.12 to 38.56, while validity rises from 71.0% to 83.9%. HumanRank gains with AIDE are smaller, especially at 14B, showing that transfer does not remove sensitivity to scaffold choice.
6.2 Effectiveness of Milestone-Based Rewards
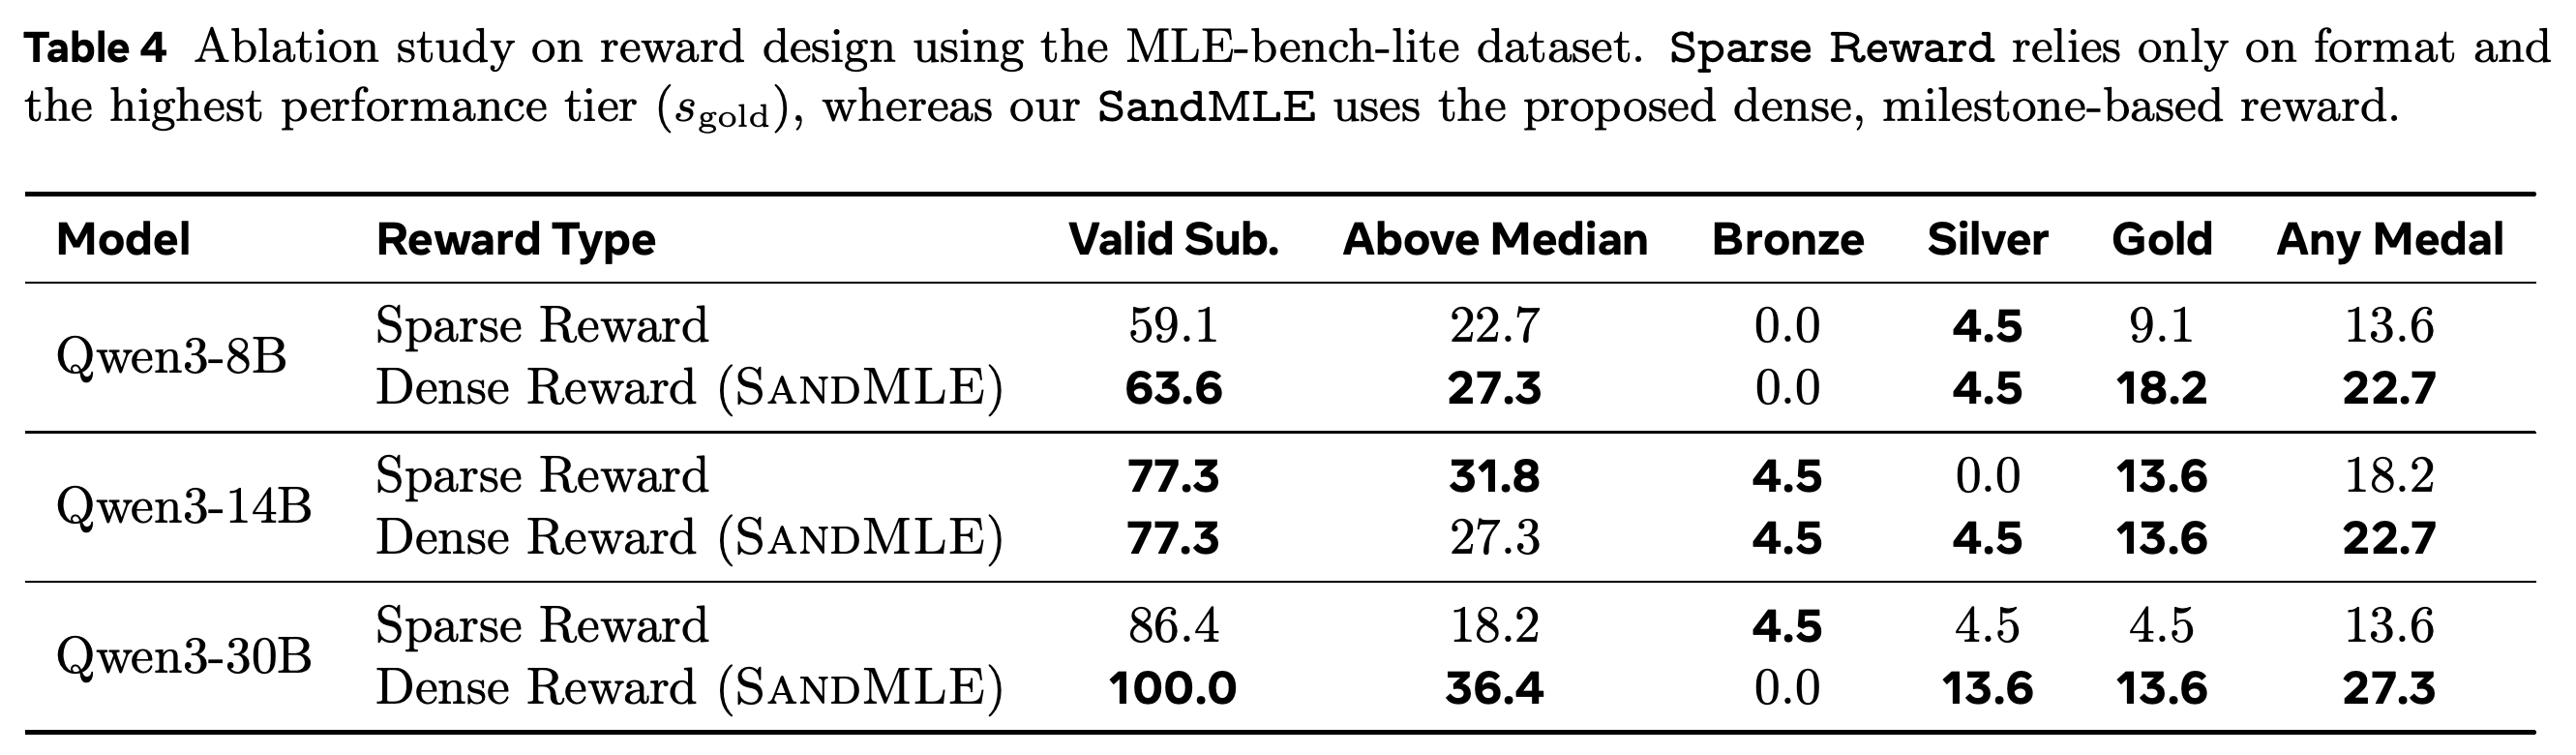
The reward ablation compares the full milestone formulation with Sparse Reward, defined as r = 0.1 · rformat + 0.9 · Isgold. Table 4 reports higher Any Medal rates for milestone rewards at every tested scale: 22.7% versus 13.6% at 8B, 22.7% versus 18.2% at 14B, and 27.3% versus 13.6% at 30B.
- At 30B, milestone rewards also raise Valid Submission from 86.4% to 100.0% and Above Median from 18.2% to 36.4%. These results are consistent with a benefit from partial credit for execution and intermediate performance.
- The improvement is not uniform across metrics: both 14B variants have 77.3% validity, and Sparse Reward has higher Above Median, 31.8% versus 27.3%.
- The ablation simultaneously removes execution and intermediate-tier rewards and increases the Gold weight. It tests the full formulation against this alternative, not the separate causal contribution or necessity of each term.
Milestone rewards outperform the format-plus-Gold alternative on Any Medal at every scale. At 30B, medals rise from 13.6% to 27.3%; however, 14B Above Median is higher with sparse rewards, and the comparison does not isolate individual reward terms.
7 Conclusion
The paper concludes that synthetic micro-scale environments make trajectory-wise on-policy RL practical for MLE agents while retaining task structure useful for transfer. The measured execution reduction, improved real-task medal rates, and results under unseen scaffolds support the combined pipeline, but do not establish equivalence between synthetic and real-data training environments.
Appendix
- A Supplementary Implementation Details. A.1 Metric Definition Details defines valid submissions, performance above the human median, medal thresholds, and Any Medal for MLE-bench-lite. For MLE-Dojo, a submission ranked p among N submissions receives (s=1-\frac{p}{N}), and HumanRank averages position scores computed independently on the public and private leaderboards.
- A.2 Hyperparameter Setup specifies 100 training steps and extends the single-execution limit from 90 seconds during RL to 4 hours during final MLE-bench evaluation. AIDE and AIRA use one NVIDIA H200 GPU, a 24-hour wall-clock cap, a 4-hour execution limit, and a 5-minute grace period. MLE-Agent evaluations allow 15 interaction steps and 12 hours, with full interaction histories, maximum input length 50,000 tokens, and per-round output capped at 8,192 tokens.
- B Supplementary Results and B.1 Training Dynamics describe the 80-step curves shown in Figure 8. They report increasing rewards and greater submission reliability at larger scales, although validation rewards fluctuate and the documented curve length differs from the 100-step implementation setting.
- C Supplementary Analysis of the Generated Synthetic Dataset documents reliability-driven filtering: 1200 initial tasks become 1119 after data-generation verification with up to five attempts, 1106 after evaluator generation with up to three attempts, and 912 after final sanity checks. C.2 Qualitative Analysis follows Urban Road Surface Damage Classification Under Motion Blur, derived from iwildcam-2019-fgvc6. Its Task Derivation and Mutation Strategy transfers a long-tail image-classification structure to road damage, while Data Generation and Hidden Rules produces 147 synthetic RGB images at 1024×768 resolution using Perlin-noise textures, temporal sequences of 1–5 frames, increasing motion blur, and deterministic damage-label rules.
- Evaluation and Alignment uses Macro-F1 to address class imbalance and gives Gold = 0.68 and Silver = 0.55 as example thresholds. The construction links the metric and thresholds to the generated data, but the claim that winning requires deblurring, frequency-domain features, or sequence aggregation is not supported by a comparative solver study.
- D Prompt Details supplies D.1 React framework templates for iterative execution and scoring and D.2 SandMLE Method templates for the four generation roles. The generation templates specify structural extraction and mutation, generate_task_env.py, threshold.json, sample_submission.csv, hidden answer.csv, evaluator.py, and an aligned description.md. These templates document implementation choices rather than add performance evidence.
Brief Thoughts
SandMLE’s useful contribution is coordinated environment redesign: data generation, evaluation, and reward thresholds are rebuilt together rather than shrinking datasets in isolation. The measured 13.7× execution speedup and transfer to real competitions provide evidence beyond improvements in synthetic validation reward.
The experiments support the combined pipeline more strongly than its individual design explanations. The 22-task primary benchmark, absence of reported uncertainty estimates, and unmatched task exposure between Seed-SFT and synthetic RL limit causal attribution; matched-data SFT, generation-component ablations, and repeated evaluations would help distinguish the contributions of on-policy learning, task diversity, and reward shaping.