


Nexus : An Agentic Framework for Time Series Forecasting | Summary
14 May 2026 | Paper Review Time Series Multi-Agent Coordination ReasoningContents
- Summary
- 1. Introduction
- 2. Problem Formulation
- 3. The Nexus Framework
- 4. Experiments
- 5. Related Works
- 6. Conclusion
- Appendix
- Brief Thoughts
This article explains the key points of Nexus : An Agentic Framework for Time Series Forecasting.
- 2026-05-14 (arXiv)
- Das, Sarkar Snigdha Sarathi, Goyal, Palash, Parmar, Mihir, Peng, Nanyun, Tirumalashetty, Vishy, Li, Chun-Liang, Zhang, Rui, Yoon, Jinsung, Pfister, Tomas.
- Google, Pennsylvania State University
- Paper
Summary
- Nexus : An Agentic Framework for Time Series Forecasting proposes a fully LLM-driven pipeline that combines numerical histories with timestamped textual context when available. It separates historical contextualization, macro- and micro-level forecasting, and final synthesis instead of assigning the entire task to one prompt.
- A calibration agent reviews historical prediction errors and generates forecasting guidelines without updating model parameters. Guidelines shared across historical folds are used only when they improve performance by at least 5% on a held-out validation fold; experiments use six backtest splits.
- Evaluation covers weekly Zillow sale inventory counts for 15 US metropolitan areas and weekly closing prices for seven stocks, using Gemini-3.1-Pro and Claude-4.5-Sonnet. Nexus improves horizon-averaged MAPE and RMSE over the CoT baseline in every reported model–dataset–input combination, but individual horizons contain exceptions and comparisons with TimesFM-2.5 are restricted to numerical-only forecasting.
- Cross-model judges prefer Nexus explanations overall in 63.5%–97.1% of comparisons, depending on model and dataset. The evidence is limited by two datasets, single-run evaluations, unequal explanation-length instructions, and the absence of causal validation.
1. Introduction
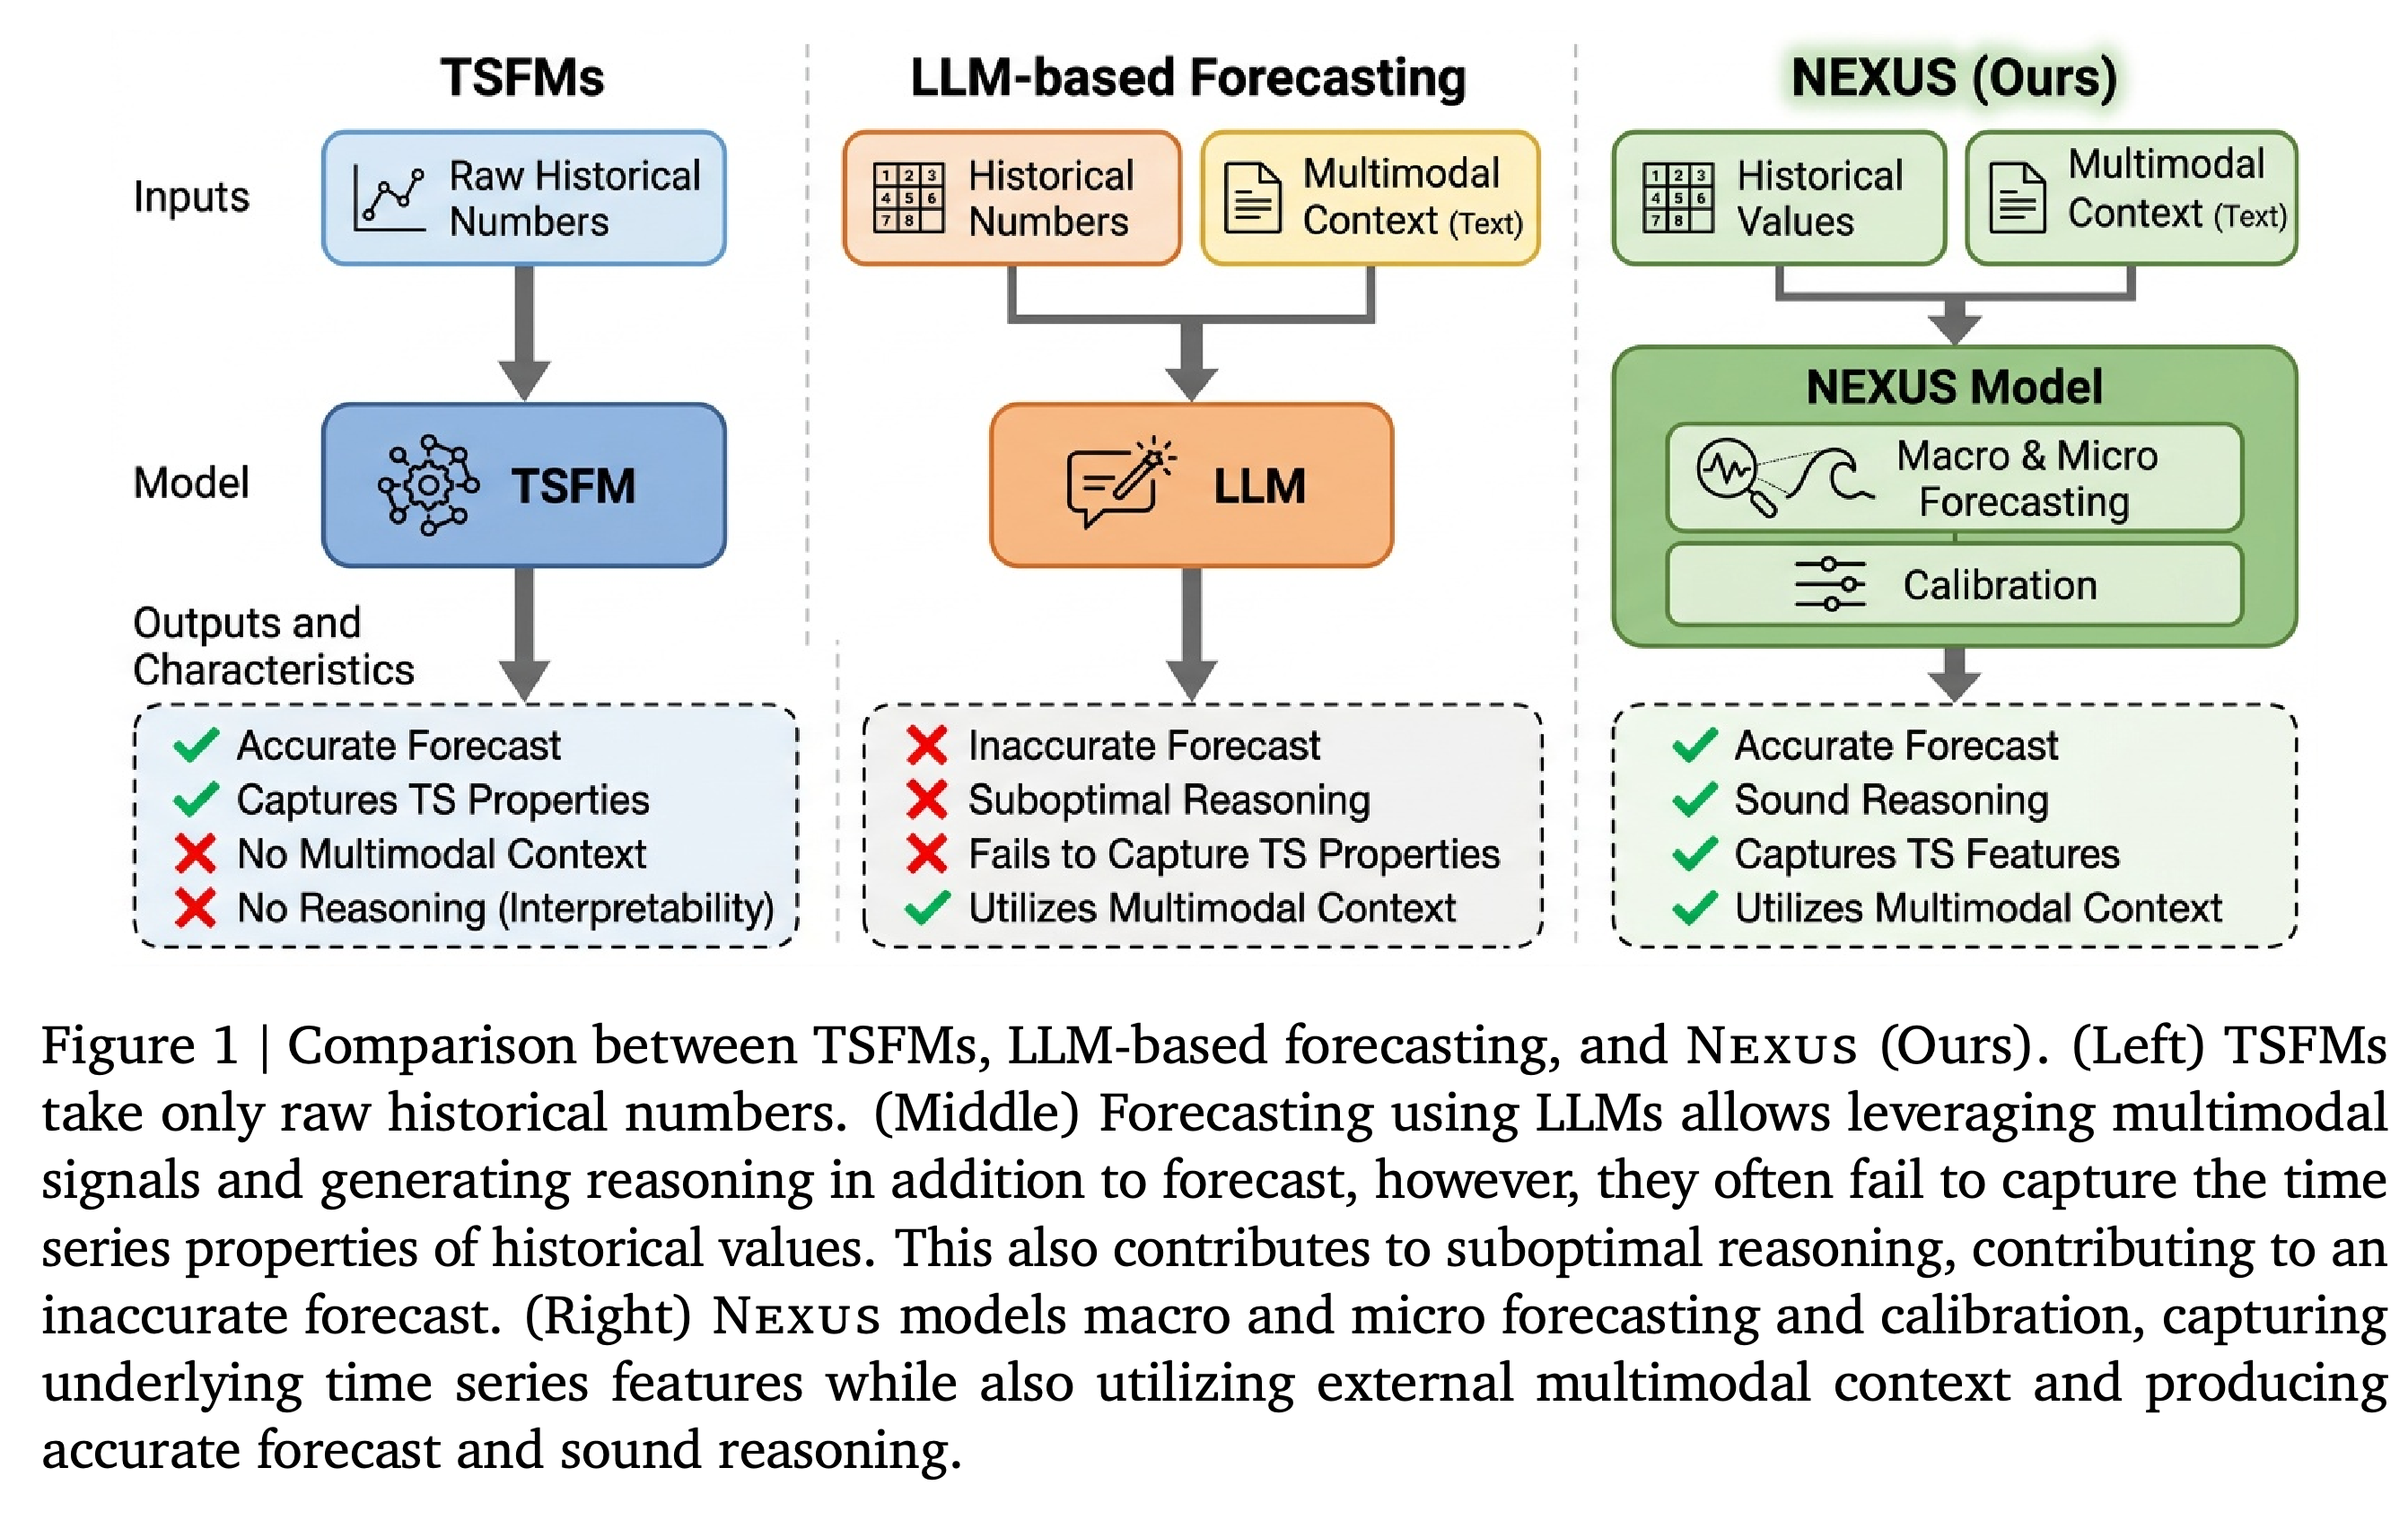
The introduction identifies a mismatch between numerical forecasting and contextual interpretation: Time Series Foundation Models (TSFMs) capture temporal patterns but do not directly process unstructured textual evidence, while directly prompted LLMs can interpret that evidence yet struggle with numerical dynamics. Figure 1 positions Nexus as combining these capabilities through task decomposition rather than arbitration among statistical models.
- The authors distinguish Nexus from agentic systems that primarily automate model selection, diagnostics, or tool use: textual evidence and temporal reasoning contribute directly to prediction.
- The proposed contributions are separate coarse and granular outlooks, their synthesis into a final forecast, and historical-error feedback for adapting the synthesis strategy.
The diagram presents the intended design trade-off: numerical TSFMs model temporal structure, directly prompted LLMs admit text, and Nexus adds separate temporal outlooks and calibration. Its checkmarks express the authors' conceptual positioning rather than measured guarantees; the experimental tables contain horizon-level exceptions.
2. Problem Formulation
The task takes a univariate numerical history X₁:τ and aligned textual observations E₁:τ, forming the historical context (\mathcal{C}{1:\tau}=(\mathbf{X}{1:\tau},\mathbf{E}{1:\tau})). It outputs values for the next T timesteps together with natural-language justifications: (\mathcal{F}(\mathbf{X}{1:\tau},\mathbf{E}{1:\tau})\rightarrow(\mathbf{X}{\tau+1:\tau+T},\mathbf{R})). The paper describes these justifications as causal rationales, although its evaluation measures plausibility and consistency rather than identifying causal effects.
3. The Nexus Framework
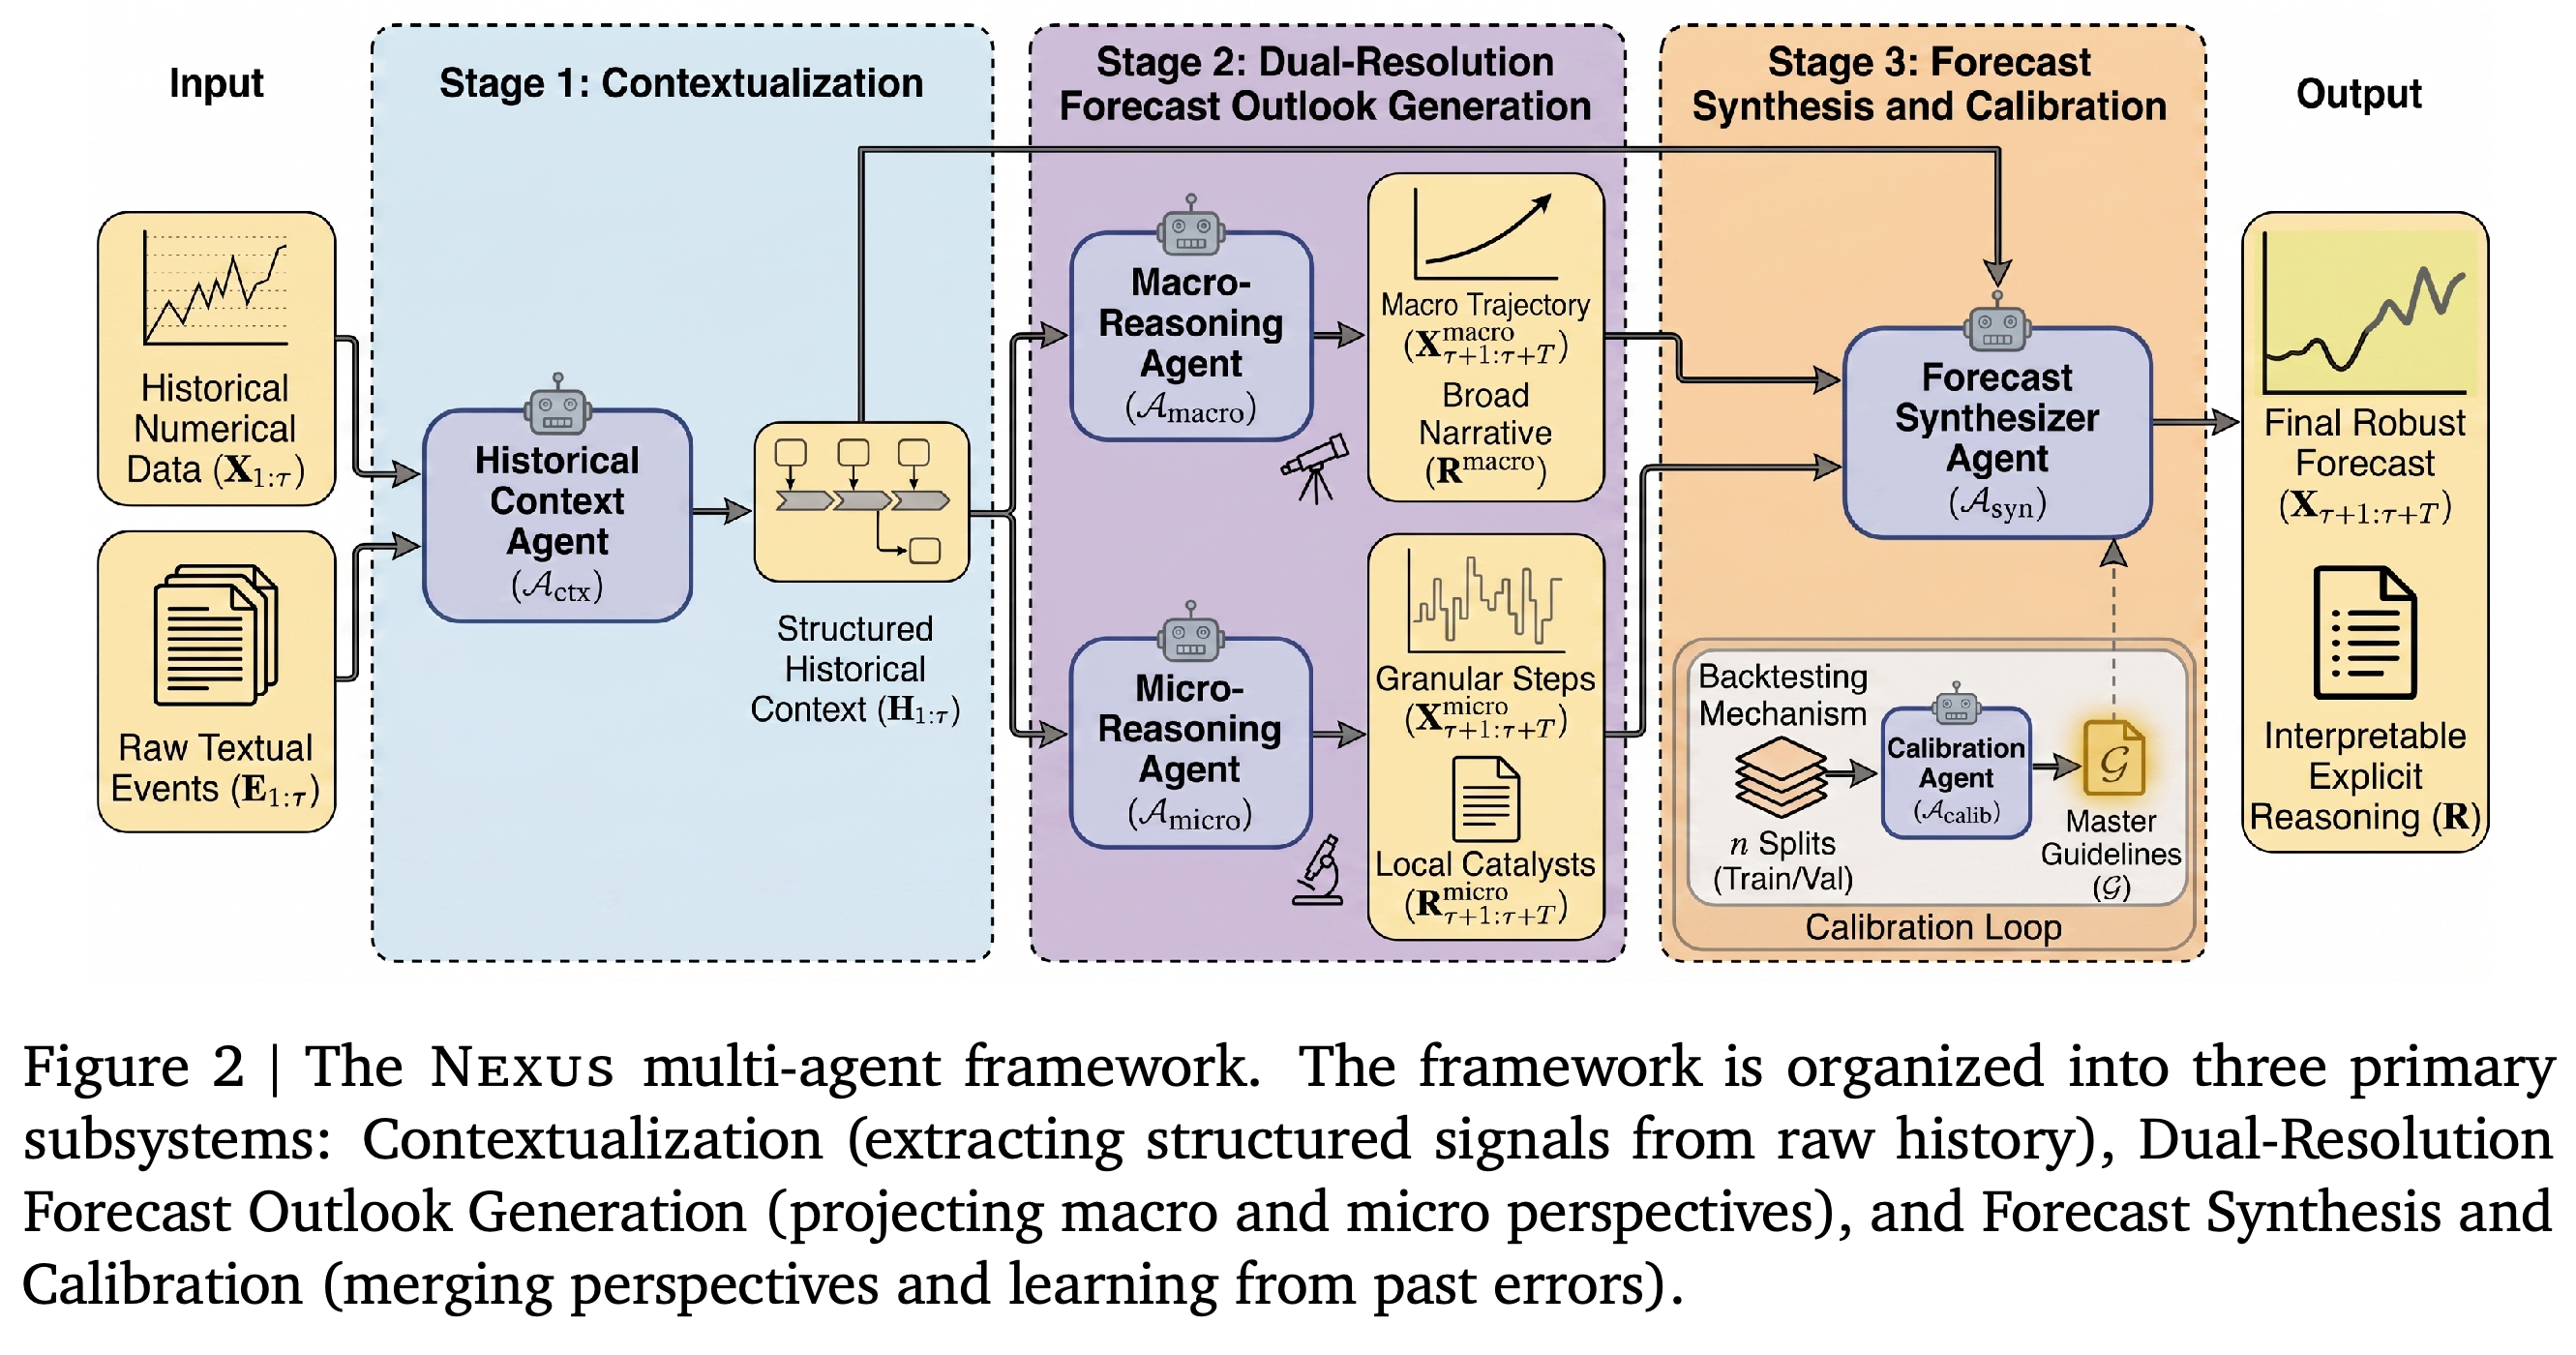
Nexus implements three stages: Contextualization, Dual-Resolution Forecast Outlook Generation, and Forecast Synthesis and Calibration. Figure 2 shows a Historical Context Agent feeding two complementary forecasters, whose numerical outlooks and explanations are combined by a Forecast Synthesizer Agent conditioned on calibration guidelines.
- LLMs produce the forecasts without an external TSFM prediction as an anchor.
- Calibration changes the textual guidance supplied to the synthesizer; it is neither model-weight training nor probabilistic uncertainty calibration.
Structured history is shared by macro and micro agents and passed to the synthesizer, while historical backtesting supplies master guidelines through a separate calibration loop. The outputs are a numerical sequence and an explanation; no external TSFM prediction is shown as an anchor.
3.1. Contextualization
The Historical Context Agent transforms raw values, associated text, and basic time-series features into a chronological timeline H₁:τ. Each entry links a timestamp and numerical value to an organized account of relevant events, with the aim of reducing long-context parsing demands for downstream agents.
- The main description emphasizes filtering noise and retaining important drivers, whereas the Appendix B.1 template explicitly asks the agent not to omit any supplied fact, event, or detail.
- The paper does not separately evaluate timeline fidelity or specify how the supplied basic time-series features are calculated.
3.2. Dual-Resolution Forecast Outlook Generation
The Macro-Reasoning Agent projects the broad trajectory and expected regime over the entire forecast horizon. The Micro-Reasoning Agent generates a numerical prediction and event-based explanation for each future timestep, considering immediate catalysts, short-term shifts, and localized volatility.
- Both agents use the same structured historical context but organize their outlooks differently to preserve long-range direction and local detail.
- The supplied macro prompt also requests reasoning across future steps, making the implemented distinction less explicit than the conceptual coarse-versus-granular description.
3.3. Forecast Synthesis and Calibration
The Forecast Synthesizer Agent combines structured history, both outlooks, and a guideline set G to produce final values and explain how it reconciles the two perspectives. Calibration generates critique rules Gᵢ from preceding backtest folds and intersects them as G = ⋂ᵢ₌₁ⁿ⁻¹ Gᵢ, reserving the final historical fold for validation.
- Baseline forecasts are generated across all folds in parallel; critiques inspect prediction errors and the reasoning used to translate anticipated events into numerical changes.
- Guidelines are applied to the final test set only if they improve performance on the hidden validation fold by at least k%; the experiments set n = 6 and k = 5.
- The paper does not specify how to compute the intersection of natural-language guideline sets or which performance metric governs the validation gate, limiting exact reproduction.
4. Experiments
The experiments test numerical-plus-text forecasting and numerical-only forecasting, followed by pairwise explanation evaluation and component ablations. These settings assess the contribution of textual context and whether the agent decomposition also improves forecasting without it.
4.1. Experimental Setup
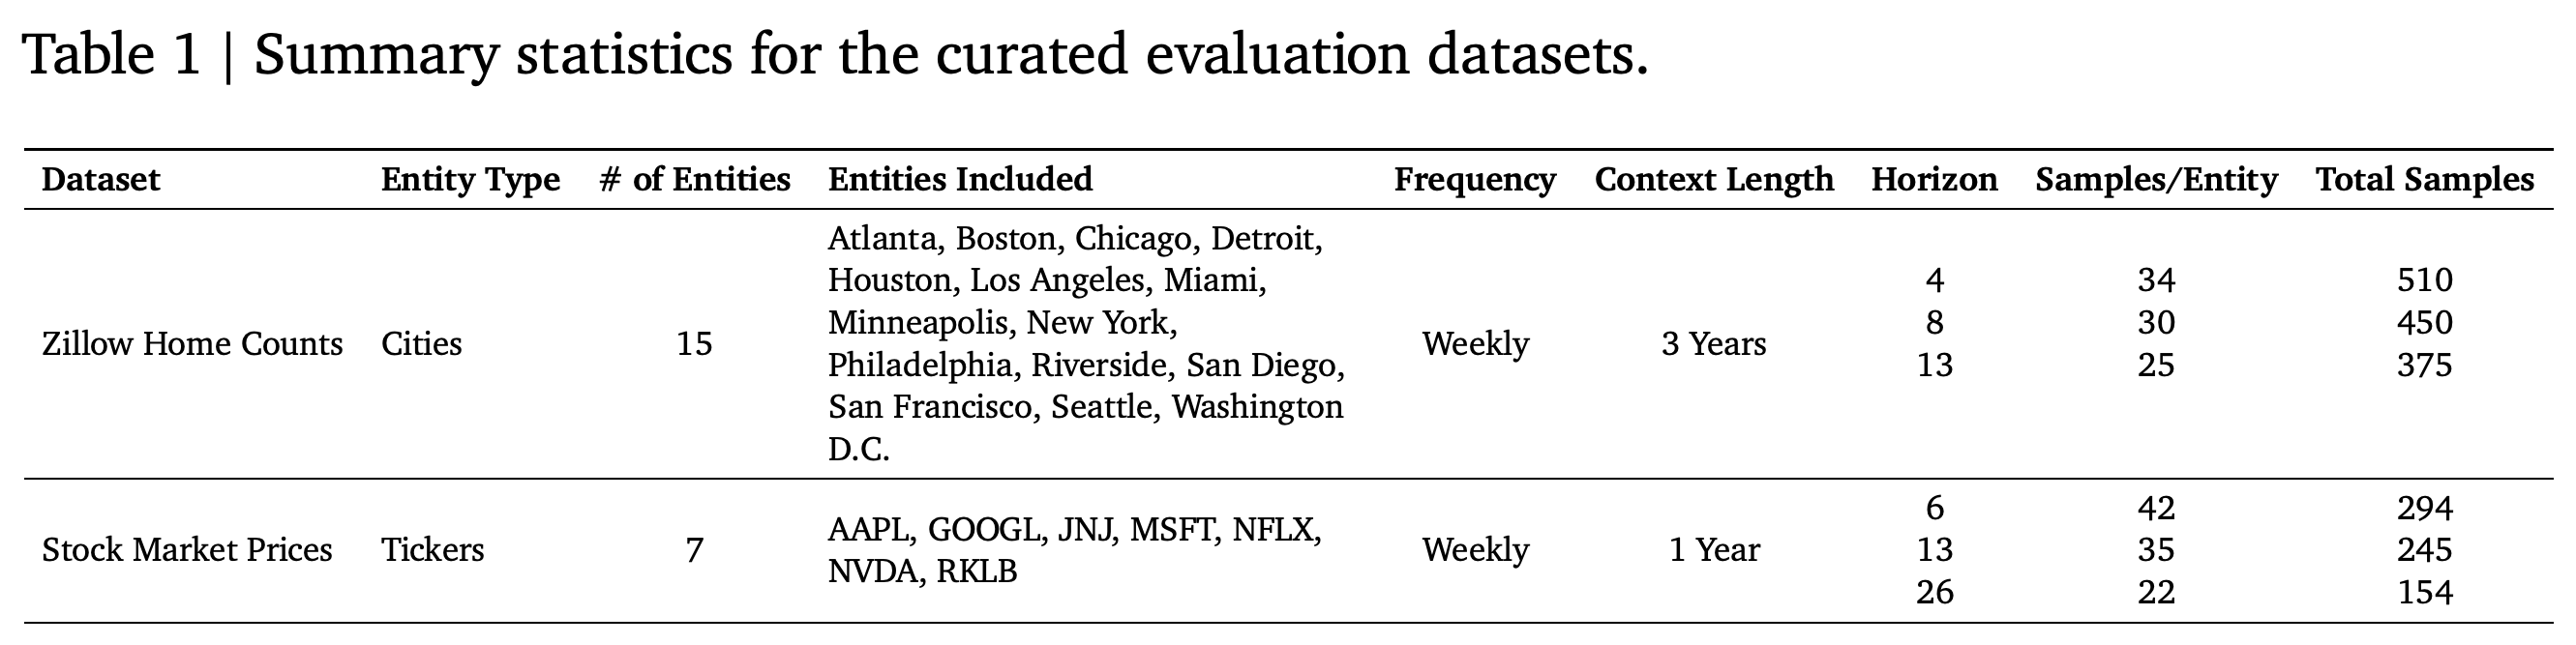
Zillow evaluation uses weekly sale inventory counts from February 2025 to October 2025, with three years of numerical history and 4-, 8-, and 13-week horizons. Stock evaluation uses weekly closing prices from February 2025 through December 2025, with one year of history and 6-, 13-, and 26-week horizons; Table 1 reports entity coverage and horizon-dependent sample counts.
- The 15 metropolitan areas are Atlanta, Boston, Chicago, Detroit, Houston, Los Angeles, Miami, Minneapolis, New York, Philadelphia, Riverside, San Diego, San Francisco, Seattle, and Washington D.C. The seven tickers are AAPL, GOOGL, JNJ, MSFT, NFLX, NVDA, and RKLB.
- Zillow has 510, 450, and 375 samples for its three horizons, respectively; stocks have 294, 245, and 154. Samples per entity are 34, 30, and 25 for Zillow and 42, 35, and 22 for stocks.
- Gemini-3.1-Pro and Claude-4.5-Sonnet are accessed through Vertex AI at temperature 0.1, with supported context lengths of 1M and 200K tokens. The authors report January 2025 knowledge cutoffs and select subsequent evaluation periods to mitigate pretraining leakage; the PDF does not independently establish that leakage is absent.
- Numerical-only inputs contain values and timestamps; multimodal inputs additionally contain chronologically aligned text following TFRBench. Baselines are TimesFM-2.5 and a researcher-curated zero-shot CoT prompt; forecasting metrics are MAPE and RMSE.
The evaluation spans 15 metropolitan areas and seven equities at weekly frequency but remains limited to two domains. Longer horizons have fewer samples: Zillow totals decrease from 510 to 375, and stock totals from 294 to 154, so horizon comparisons do not use identical sample counts.
4.2. Forecasting with Multimodal Context
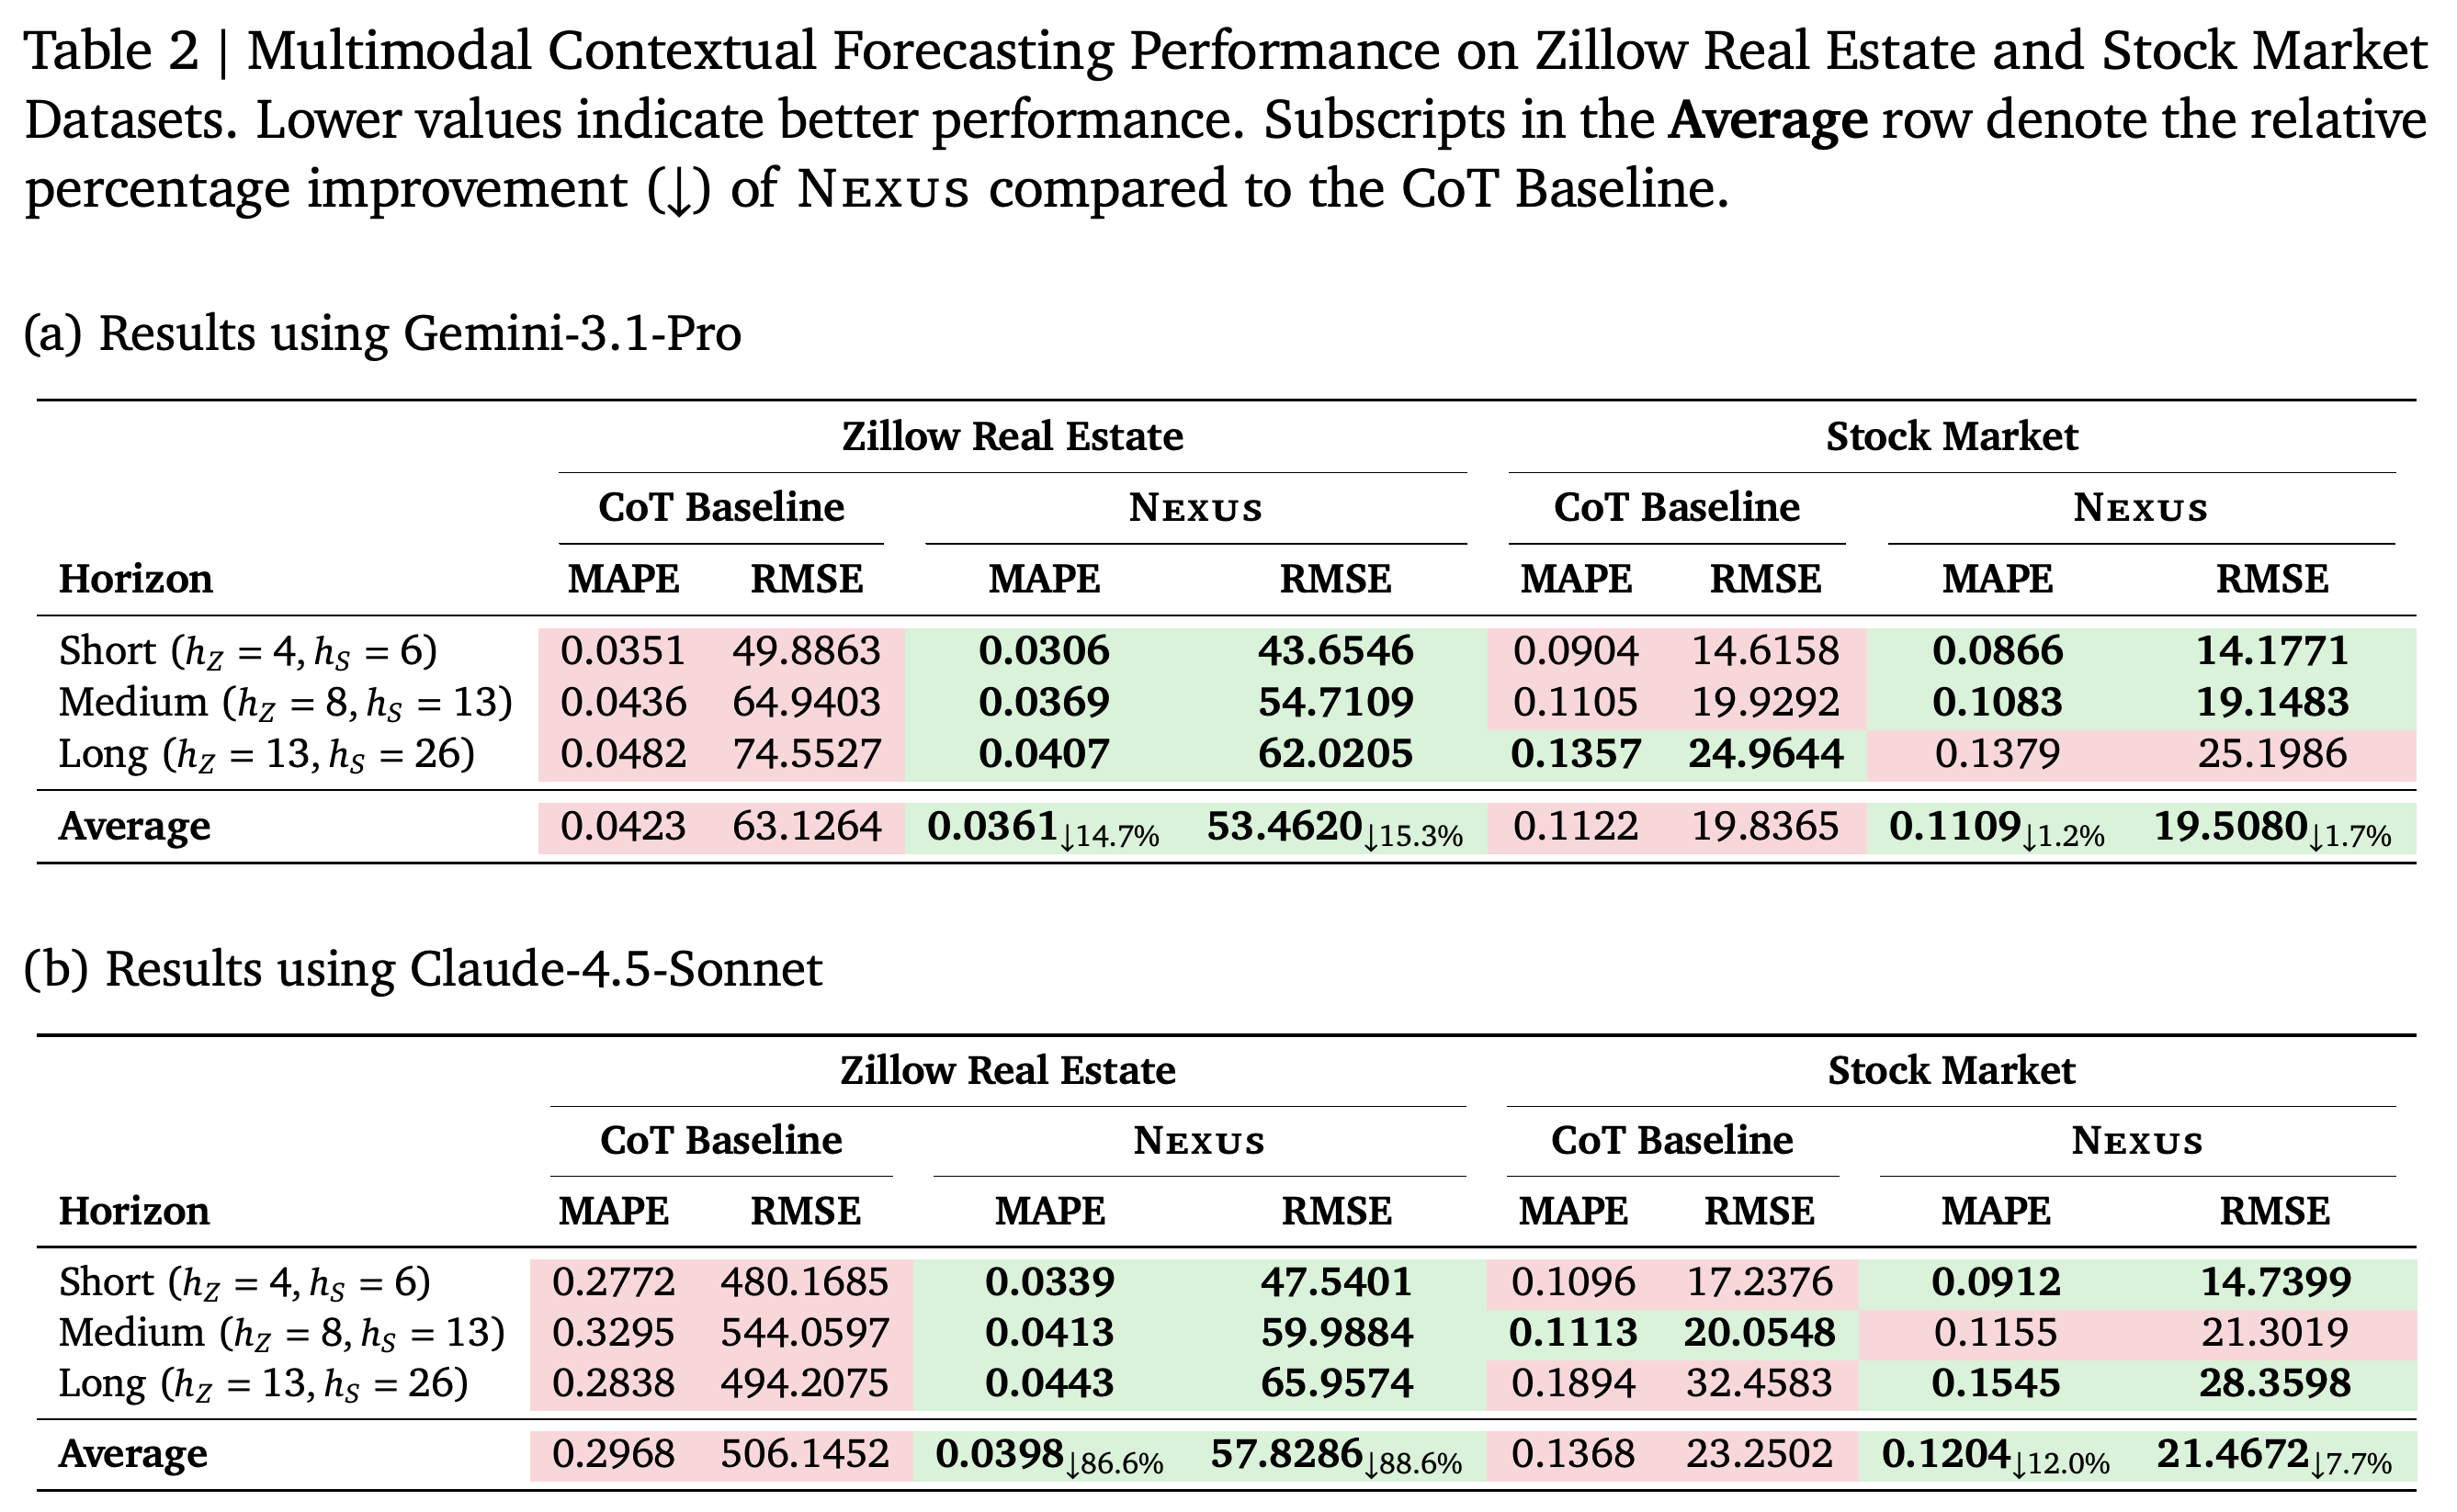
Table 2 shows lower horizon-averaged errors for multimodal Nexus than for CoT with both models and datasets. For Gemini-3.1-Pro, average Zillow MAPE falls from 0.0423 to 0.0361 and RMSE from 63.1264 to 53.4620, reported as 14.7% and 15.3% improvements; stock improvements are smaller at 1.2% and 1.7%.
- For Claude-4.5-Sonnet, average Zillow MAPE falls from 0.2968 to 0.0398 and RMSE from 506.1452 to 57.8286, reported as 86.6% and 88.6% improvements. Stock averages improve from 0.1368 to 0.1204 MAPE and from 23.2502 to 21.4672 RMSE.
- The authors suggest that Claude’s poor Zillow baseline reflects difficulty extracting temporal dynamics from long contexts. The experiments do not isolate this proposed mechanism.
- The advantage is not uniform: Gemini’s 26-week stock MAPE increases from 0.1357 to 0.1379, while Claude’s 13-week stock MAPE increases from 0.1113 to 0.1155; RMSE also worsens in both comparisons.
The largest multimodal improvement occurs for Claude on Zillow, where average MAPE drops from 0.2968 to 0.0398. Stock gains are smaller and not uniform: Nexus loses to CoT on Gemini's long horizon and Claude's medium horizon despite better averages for both models.
4.3. Forecasting with Numerical Context Only
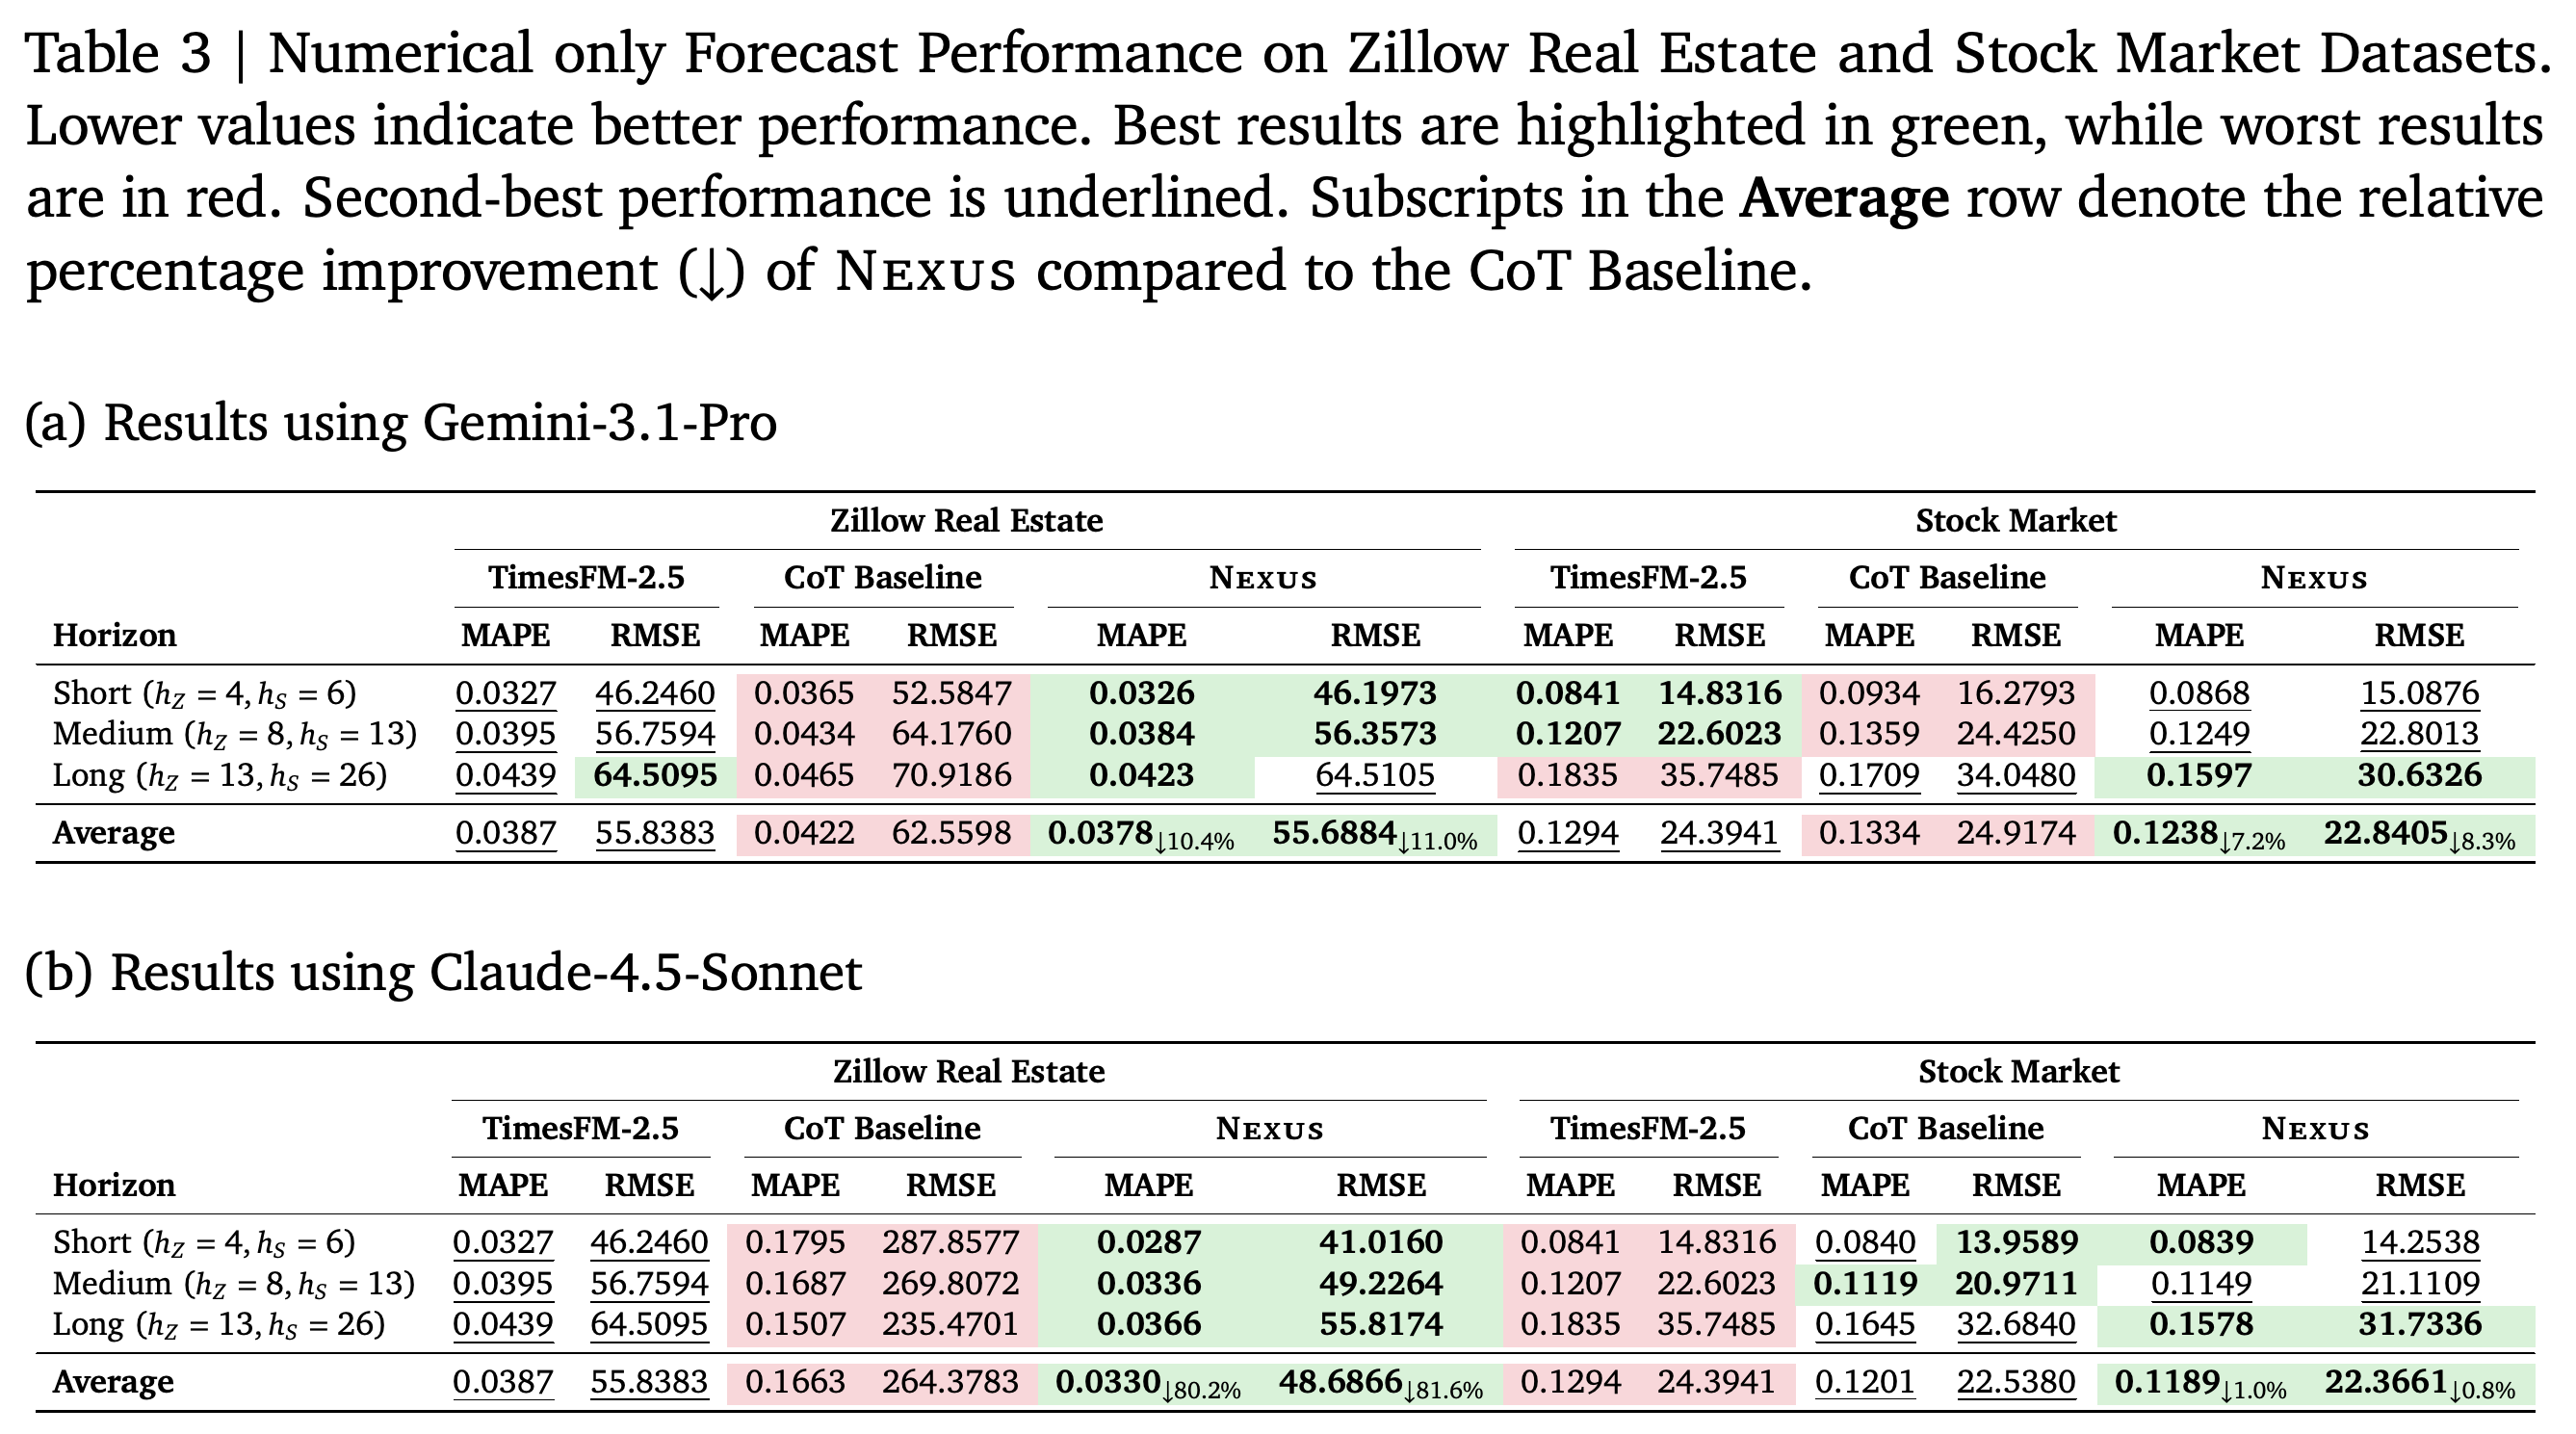
Table 3 shows that numerical-only Nexus achieves lower horizon-averaged errors than TimesFM-2.5. Gemini-3.1-Pro Nexus averages 0.0378 MAPE and 55.6884 RMSE on Zillow, versus TimesFM-2.5’s 0.0387 and 55.8383; on stocks, the corresponding averages are 0.1238 and 22.8405 versus 0.1294 and 24.3941.
- Claude-4.5-Sonnet Nexus averages 0.0330 MAPE and 48.6866 RMSE on Zillow and 0.1189 MAPE and 22.3661 RMSE on stocks, below the corresponding TimesFM-2.5 averages.
- Relative to CoT, reported average Zillow reductions are 10.4% MAPE and 11.0% RMSE for Gemini, and 80.2% and 81.6% for Claude. Claude’s stock gains over CoT are only 1.0% MAPE and 0.8% RMSE.
- TimesFM-2.5 beats Gemini Nexus on short- and medium-horizon stocks and narrowly on long-horizon Zillow RMSE. Claude CoT beats Claude Nexus on medium-horizon stocks and short-horizon stock RMSE, so average improvements do not establish dominance at every horizon.
- Textual context does not invariably help: Claude Nexus’s average Zillow MAPE is 0.0398 with text versus 0.0330 without it, and its average stock MAPE is 0.1204 versus 0.1189.
Numerical-only Nexus achieves lower horizon-averaged errors than TimesFM-2.5 for both tested LLMs and datasets. Individual cells qualify that result: TimesFM-2.5 beats Gemini Nexus on short- and medium-horizon stocks and narrowly on long-horizon Zillow RMSE, while Claude CoT beats Claude Nexus on some stock comparisons.
4.4. Reasoning Quality Evaluation
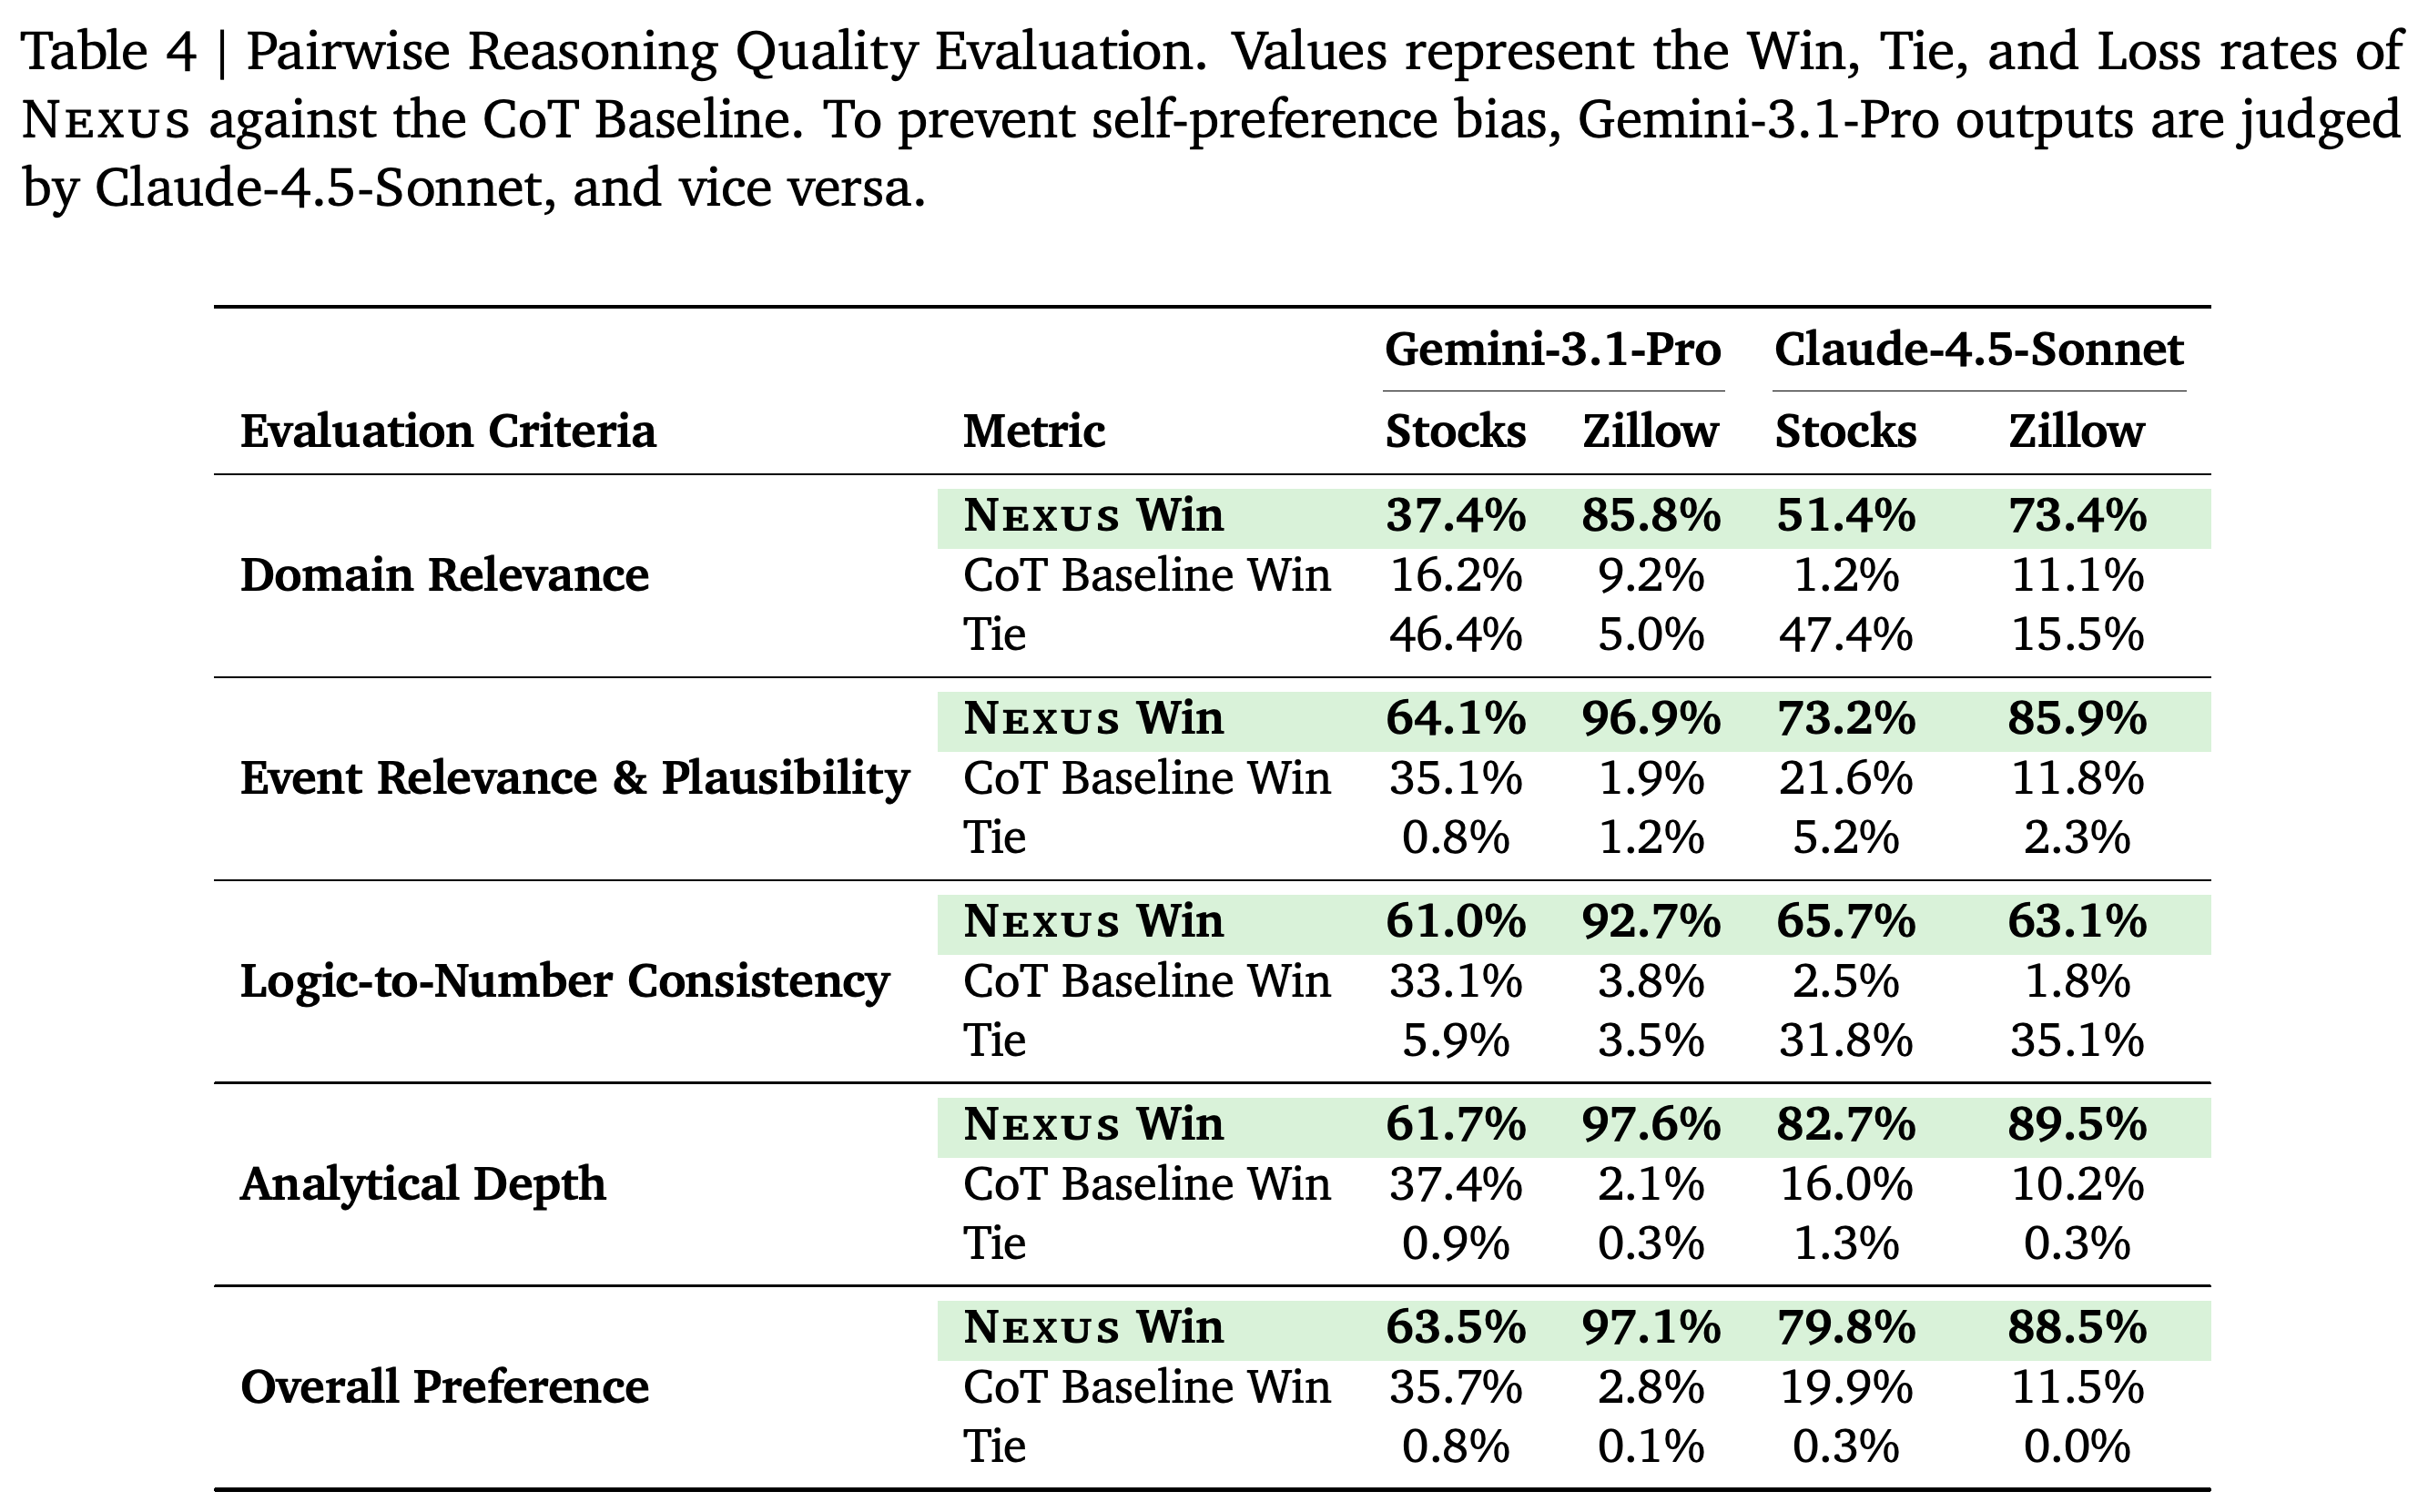
Reasoning quality is evaluated through randomized pairwise comparisons and cross-model judging: Claude-4.5-Sonnet judges Gemini-3.1-Pro outputs, and Gemini judges Claude outputs. Judges receive actual forecast-horizon events, generated explanations, and predicted values, but not actual numerical ground truth.
- The four criteria are Domain Relevance, Event Relevance & Plausibility, Logic-to-Number Consistency, and Analytical Depth, followed by Overall Preference.
- Table 4 reports overall Nexus win rates of 63.5% for Gemini stocks, 97.1% for Gemini Zillow, 79.8% for Claude stocks, and 88.5% for Claude Zillow.
- Gemini Zillow explanations receive particularly high Nexus win rates for Event Relevance & Plausibility (96.9%) and Analytical Depth (97.6%). Domain Relevance has substantial ties on stocks: 46.4% for Gemini and 47.4% for Claude.
- Cross-judging and randomized order address specific preference biases but do not establish explanation faithfulness or causal correctness. Providing realized future events makes this a retrospective plausibility assessment, and the unequal explanation-length instructions remain a confound.
Overall preference favors Nexus in all four model–dataset combinations, with win rates from 63.5% to 97.1%. Large stock tie rates for Domain Relevance show that the advantage is not equally decisive on every criterion; these preferences assess retrospective narrative plausibility without actual numerical ground truth.
4.5. Component Analysis
Table 5 ablates micro reasoning, macro reasoning, and calibration only for Gemini-3.1-Pro in the multimodal short-horizon setting, with h_Z = 4 and h_S = 6. The full pipeline has the lowest reported MAPE and RMSE for both datasets, but differences are small and no repeated-run uncertainty is reported.
- Zillow MAPE is 0.0306 for the full pipeline, versus 0.0314 without micro reasoning, 0.0317 without macro reasoning, and 0.0309 without calibration.
- Stock MAPE is 0.0866 for the full pipeline, versus 0.0877 without micro reasoning, 0.0882 without macro reasoning, and 0.0877 without calibration.
- The ablations support complementary component contributions in this setting, not the necessity of every component across models, input settings, or longer horizons.
5. Related Works
Related work is organized into LLMs for Time Series Forecasting, Time-Series Foundation Models, and Semantic, Adaptive, and Agentic Forecasting. Nexus is positioned as an inference-time workflow combining textual evidence, temporal projections, and diagnostic feedback rather than reprogramming an LLM backbone or selecting among external numerical forecasts.
- The paper discusses direct prompting and adaptation methods such as GPT4TS/FPT, TEMPO, Time-LLM, and UniTime, including evidence that linguistic pretraining does not necessarily explain their forecasting gains.
- Temporal-pretraining comparisons include Chronos, TimesFM, Lag-Llama, MOMENT, and MOIRAI. The semantic and agentic discussion covers LoFT-LLM, T-LLM, TimeSAF, Synapse, TimeCopilot, TimeSeriesScientist, AlphaCast, and Cast-R1.
6. Conclusion
The conclusion attributes Nexus’s results to structuring mixed numerical and textual inputs, separating broad trajectories from local catalysts, and calibrating their synthesis. The tables support improved horizon-averaged performance in the reported settings, but not the conclusion’s claim of consistently outperforming both baselines at every horizon.
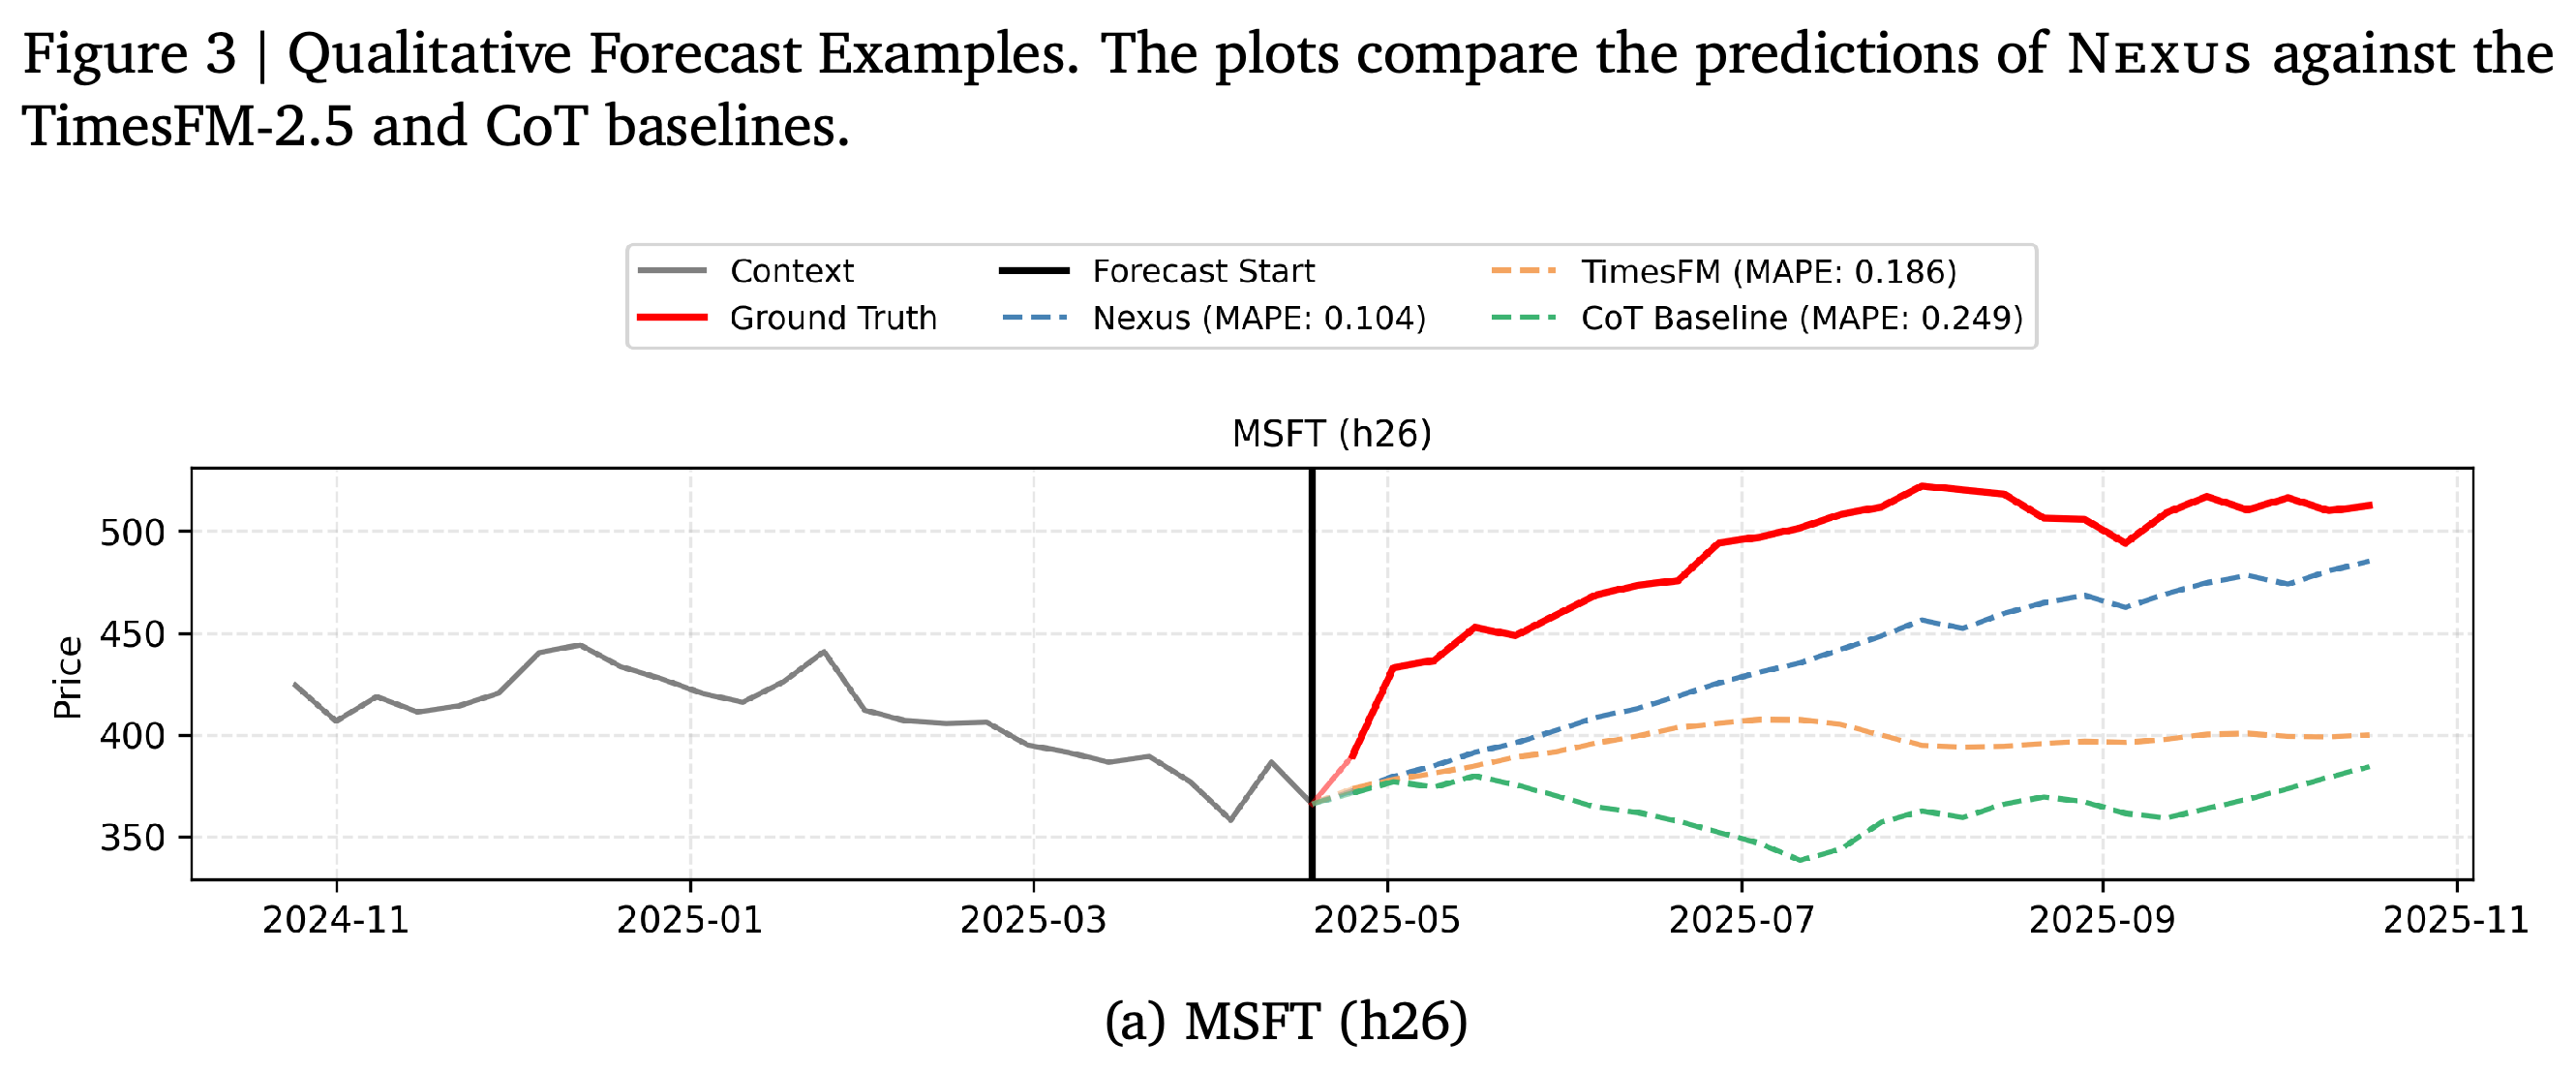
- Figure 3 illustrates successes and failures: Nexus follows several seasonal recoveries and equity uptrends, but RKLB panels (m) and (n) show rising predictions against falling realized prices.
- The Washington_DC_msa_VA examples show Nexus overshooting the spring recovery while TimesFM-2.5 tracks the realized trajectory more closely. These cases separate coherent contextual narratives from accurate prediction of direction and magnitude.
The 16 panels show both useful trend capture and substantial failures. In MSFT (h26), the legend reports Nexus MAPE 0.104 versus TimesFM 0.186 and CoT 0.249; several Los_Angeles_CA_msa panels also show close tracking of spring recovery. Conversely, RKLB panels (m) and (n) predict increases while prices fall, and Washington_DC_msa_VA panels (o) and (p) overshoot the recovery relative to TimesFM-2.5.
Appendix
- A. Limitations notes that evaluation is restricted to Zillow and stocks because publicly available timestamp-aligned numerical–text datasets are scarce. The authors identify pretraining leakage as a concern and report only single-run evaluations because repeated multi-agent calls are expensive and computationally demanding.
- B. Nexus : Agent Prompts supplies the agent templates. B.1. Historical Context Agent takes {ts_features}, {domain}, and {history_str}, and specifies a chronological output containing Date/Timestamp, Value, and Textual Content while retaining all supplied facts and events.
- B.2. Macro-Reasoning Forecaster Agent requests a detailed future-step explanation inside <reasoning> tags and exactly {horizon} numerical values inside <forecasted_values> tags. Its system prompt specifies a January 2025 knowledge cutoff.
- B.3. Micro-Reasoning Forecaster Agent specifies a timestamp_forecasts list with timestamp, date, day_info, reasoning, and adjusted_forecast_value. The reasoning object contains movement_label and key_drivers, making predicted events and directional explanations explicit at each future step.
- B.4. Calibration Agent reviews the value predictor’s prompt, explanation, numerical predictions, MAPE, upstream macro and micro MAPE, and historical ground-truth events and values. It returns a <diagnosis> and a short generalized <guidelines> paragraph focused on errors in translating narratives into numerical magnitudes.
- B.5. Value Predictor Agent supplies the final-synthesis template using history, future dates, macro and micro outlooks, and guideline and event-prediction placeholders. It requests an explanation of adjustments to both perspectives and exactly {horizon} values inside <forecasted_values> tags.
- C. CoT-Baseline Prompt supplies historical records and event intelligence, asking the baseline to consider their interaction with seasonality. Unlike Nexus’s detailed explanation instructions, it specifies BRIEF ANALYSIS and places exactly {horizon} comma-separated predictions inside <prediction> tags; this asymmetry matters for interpreting reasoning-quality comparisons.
- D. LLM-as-a-Judge Prompt evaluates narrative quality using actual events but without actual numerical ground truth. Its output identifiers are domain_relevance_winner, event_relevance_winner, logic_to_number_winner, analytical_depth_winner, overall_preference, and justification, with Model A, Model B, or Tie as preference labels.
- E. Qualitative Forecast Examples presents Figure 3 across 16 panels, comparing historical context, ground truth, Nexus, TimesFM-2.5, and CoT. The selected examples include seasonal recoveries and upward stock forecasts alongside failures on RKLB reversals and overshooting Washington_DC_msa_VA forecasts; they do not replace aggregate evaluation.
- F. Qualitative Reasoning Examples provides the narratives associated with the plots. F.1. Example 1, MSFT (h26), attributes recovery to AI monetization, cloud growth, and absorption of tariff shocks; F.2. Example 2, AAPL (h6), projects growth from iPhone 17 sales, M5 hardware, earnings, possible rate cuts, and holiday demand. F.3. Example 3, RKLB (h6), invokes the $5.6 billion NSSL Phase 3 Lane 1 contract and earnings momentum, while F.4. Example 4, NFLX (h26), invokes ad-tier growth, live sports, and earnings to project a rise toward the 115 range by October 2025.
- F.5. Example 5, San_Diego_CA_msa (h8), combines a lower 2025 baseline with historical spring growth and local events. F.6. Example 6, Los_Angeles_CA_msa (h13), anticipates recovery from a winter and wildfire trough followed by a mid-April peak; F.7. Example 7, Los_Angeles_CA_msa (h8), emphasizes stabilization and spring recovery. F.8. Example 8, Los_Angeles_CA_msa (h4), combines historical post-January recovery with wildfire effects and resumed local activities.
- F.9. Example 9, RKLB (h6), projects recovery from the low $20s toward the mid-to-upper $20s using Neutron qualification and defense-framework participation. F.10. Example 10, GOOGL (h13), gives dated weekly projections from 2025-09-05 to 2025-11-28, ending at 238.10, based on anticipated monetary policy, earnings, and advertising demand. F.11. Example 11, Houston_TX_msa_TX (h8), and F.12. Example 12, Riverside_CA_msa_CA (h4), attribute spring increases to historical seasonality, weather, and local events; these are model-generated attributions, not independently established causal effects.
- F.13. Example 13, RKLB (h6), projects 66.50, 69.10, 72.80, 75.20, 76.80, and 78.40 using launch, earnings, and analyst-target narratives, yet its associated plot shows a sharp realized decline. F.14. Example 14, RKLB (h6), likewise anticipates earnings-led upward momentum despite the declining trajectory shown in its plot. F.15. Example 15, Washington_DC_msa_VA (h13), and F.16. Example 16, Washington_DC_msa_VA (h8), invoke seasonal recovery, holidays, and the Cherry Blossom Festival, while their plotted predictions overshoot the realized recovery.
Brief Thoughts
The clearest result is that structured LLM inference can improve forecasting without changing model weights or relying on a TSFM forecast. Numerical-only comparisons support this finding, especially Claude’s Zillow results, although modest stock gains and horizon-level exceptions make the benefit task-dependent.
The experiments do not fully separate the effects of specialization, historical feedback, context restructuring, and additional inference effort. Small single-run ablation differences and the absence of a compute-matched baseline constrain attribution; unequal explanation instructions and RKLB failures also caution against treating judged narrative quality as faithful causal explanation or reliable event prediction.