


LiveFigure: Generating Editable Scientific Illustration with VLM Agents | Summary
22 May 2026 | Paper Review Scientific Illustration Generation Vision-Language Models Agent LearningContents
This article explains the key points of LiveFigure: Generating Editable Scientific Illustration with VLM Agents.
- 2026-05-22 (arXiv), Proceedings of the 43rd International Conference on Machine Learning, Seoul, South Korea. PMLR 306, 2026.
- Shao, Chenyang, Liu, Jiahe, Xu, Fengli, Li, Yong.
- Department of Electronic Engineering, BNRist, Tsinghua University, Beijing, China, Zhongguancun Academy
- Paper
Summary
- LiveFigure addresses scientific-figure generation where localized correction of text, geometry, connectors, and layout is required after generation. Its Cognition-Inspired Procedural Construction framework uses VLM agents to plan a schematic, generate a native PowerPoint source through executable code, and refine detected visual defects; the authors provide code at https://github.com/tsinghua-fib-lab/LiveFigure.git. The paper evaluates editability by counting the atomic manual edits needed for experts to consider a generated PPTX ready for publication.
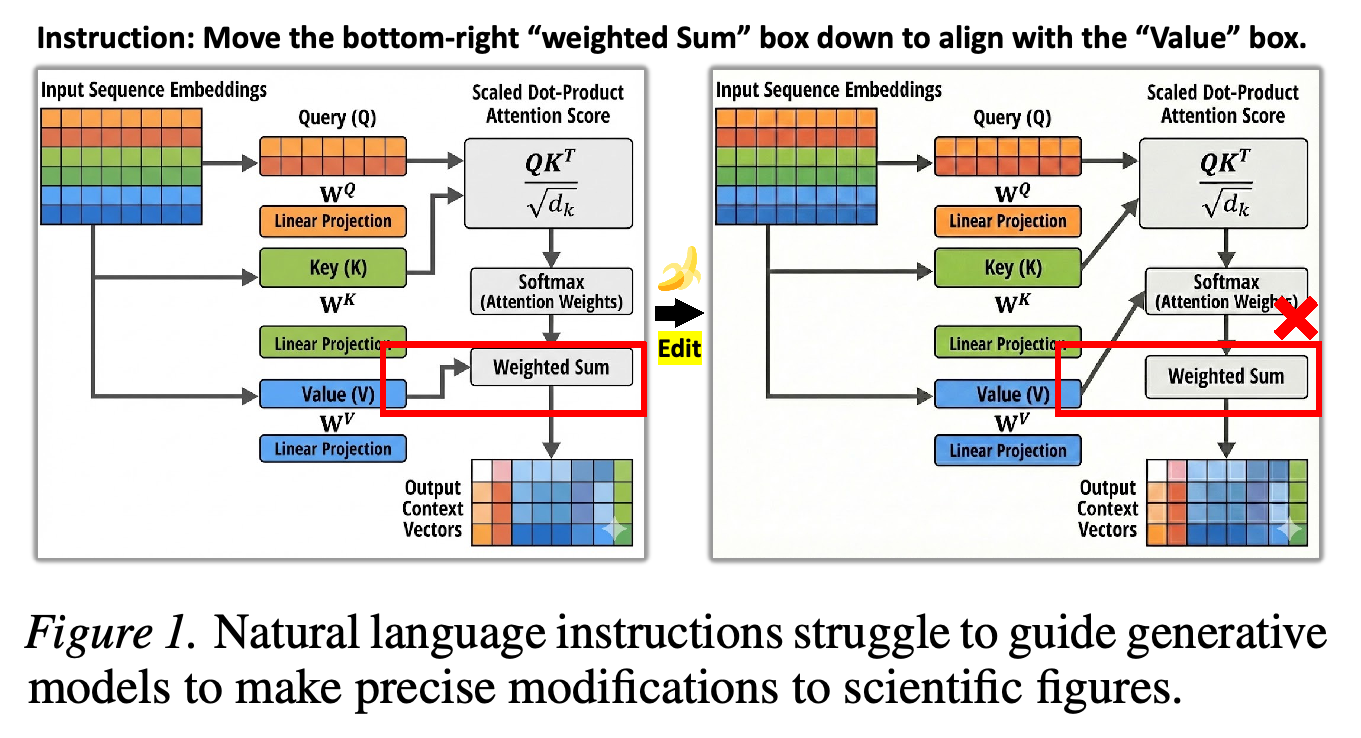
The example shows an instruction to move a single “weighted Sum” box and a raster-model response that does not realize the requested local alignment change. It motivates representing diagrams as independently editable objects rather than as monolithic images.
3. Methodology
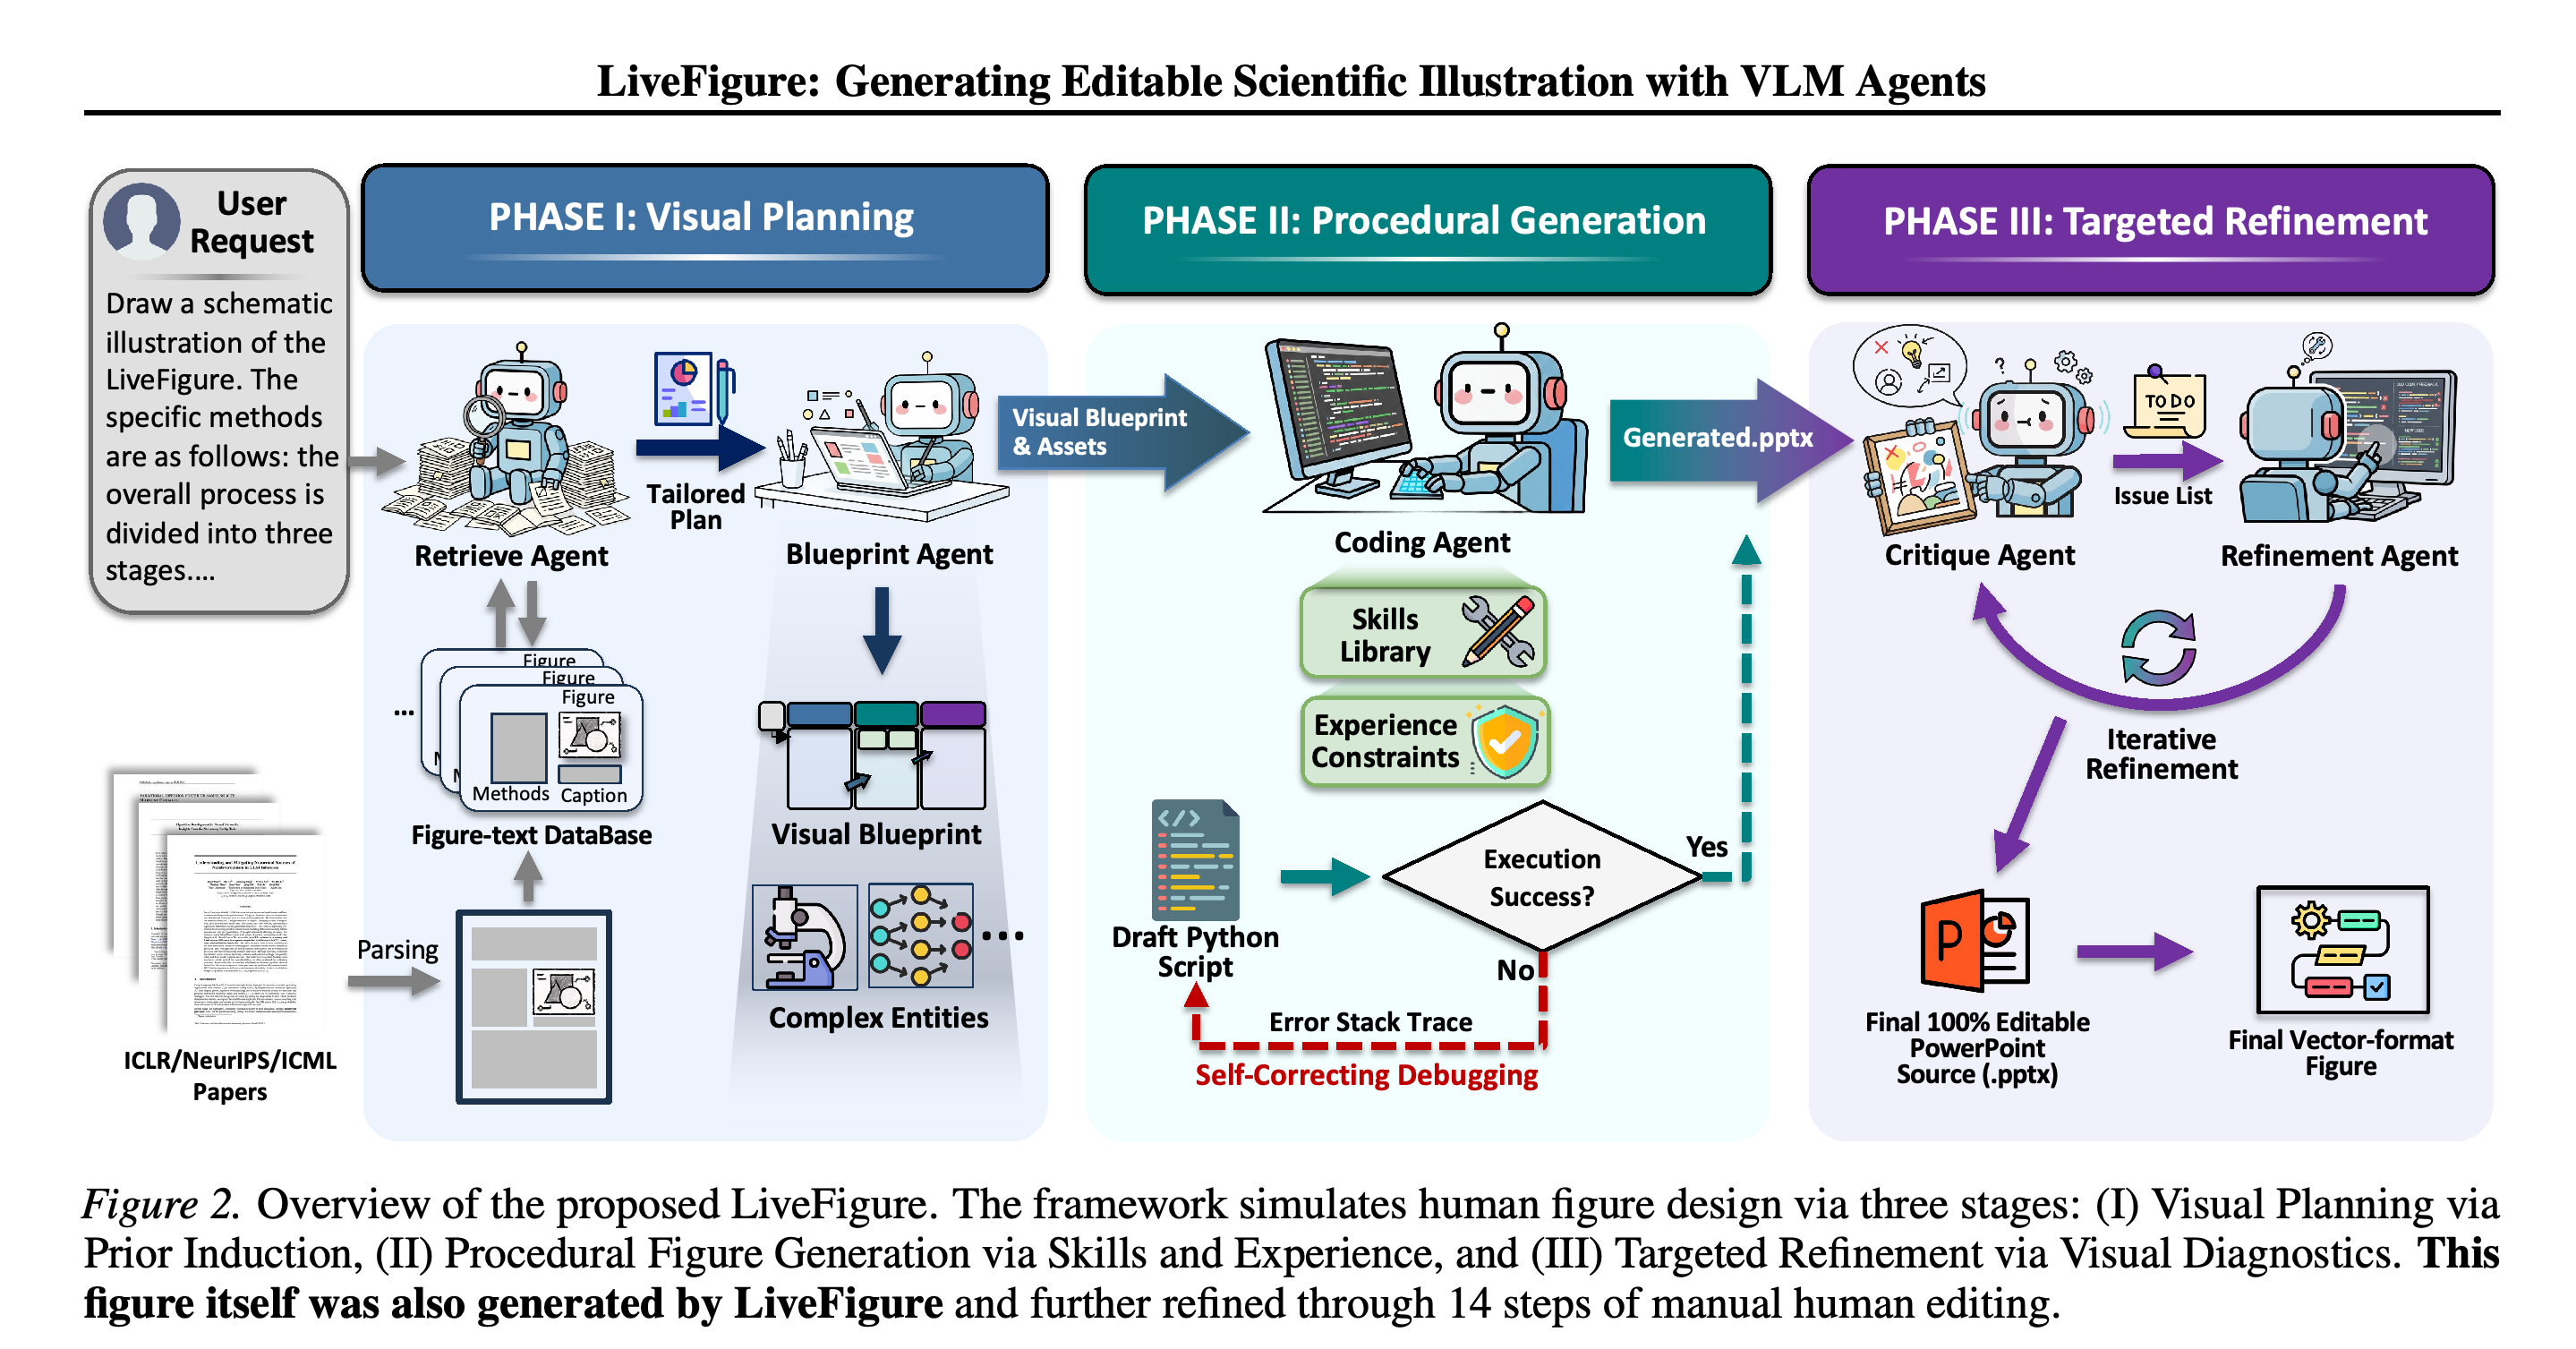
The framework maps methodological text T_in to an editable final figure through three sequential stages: visual planning, procedural assembly, and visual refinement. Stage I produces a plan and assets, Stage II produces an executable PowerPoint-generation script, and Stage III updates that script from rendered-image diagnostics rather than regenerating the figure wholesale.
3.1. Visual Planning via Prior Induction (Stage I)
Stage I constructs a figure–text knowledge base K = {(v_i, c_i, d_i)}_{i=1}^N of filtered methodological schematics, captions, and dense technical descriptions. A retrieval agent selects semantically relevant examples, a VLM derives a structural plan, and a blueprint agent generates a visual blueprint. For complex domain-specific entities, the system generates a style-conditioned M × N icon grid, then crops it and removes backgrounds to form an asset library.
The diagram traces the three stages from reference retrieval and blueprint generation to skill- and experience-constrained code generation, execution debugging, and critic-guided refinement. It depicts a native .pptx file as the editable intermediate output before vector-format export.
3.2. Procedural Figure Generation via Skills and Experience (Stage II)
Stage II translates the blueprint and assets into an editable PowerPoint figure using Python and python-pptx. A pre-validated skill library encapsulates operations such as connector routing and nested text-shape composition, while accumulated debugging experience is injected as negative constraints against known API errors. If execution fails, the agent uses the stack trace in an iterative repair loop up to a maximum number of iterations.
3.3. Targeted Refinement via Visual Diagnostics (Stage III)
Stage III closes a code–perception loop by rendering the current script and asking a VLM critic to produce an actionable issue list. The refinement agent then makes incremental code changes for localized problems such as overlaps, clipping, misalignment, or inconsistent styling, continuing until the issue list is empty or the procedure converges.
4. Experiments
Experiments compare LiveFigure with raster generators—Nano Banana, GPT-Image-1.5, Imagen-4.0-Ultra, Qwen-Image, and Grok-2-Image—and programmatic baselines including Mermaid, Graphviz, Matplotlib, TikZ-V1, and HTML/CSS. The 300-instance benchmark samples 100 scientific schematic–text pairs from each of ICLR 2024, NeurIPS 2024, and ICML 2024. Evaluation combines XML-based Edit Distance, nine VLM-scored dimensions, double-blind expert preferences, and supplementary qualitative case studies.
4.1. Experimental Setup
Edit Distance counts unique Modify, Add, and Delete operations between generated and expert-edited PPTX XML trees, aggregating repeated changes to the same element. The visual protocol scores Aesthetic Quality, Visual Expressiveness, Professional Polish, Clarity, Logical Flow, Text Legibility, Accuracy, Completeness, and Appropriateness under caption-only V1 and caption-plus-method-description V2 inputs. The human panel comprised seven PhD AI researchers, each with at least three publications in top-tier AI venues or journals.
4.2. Main Results
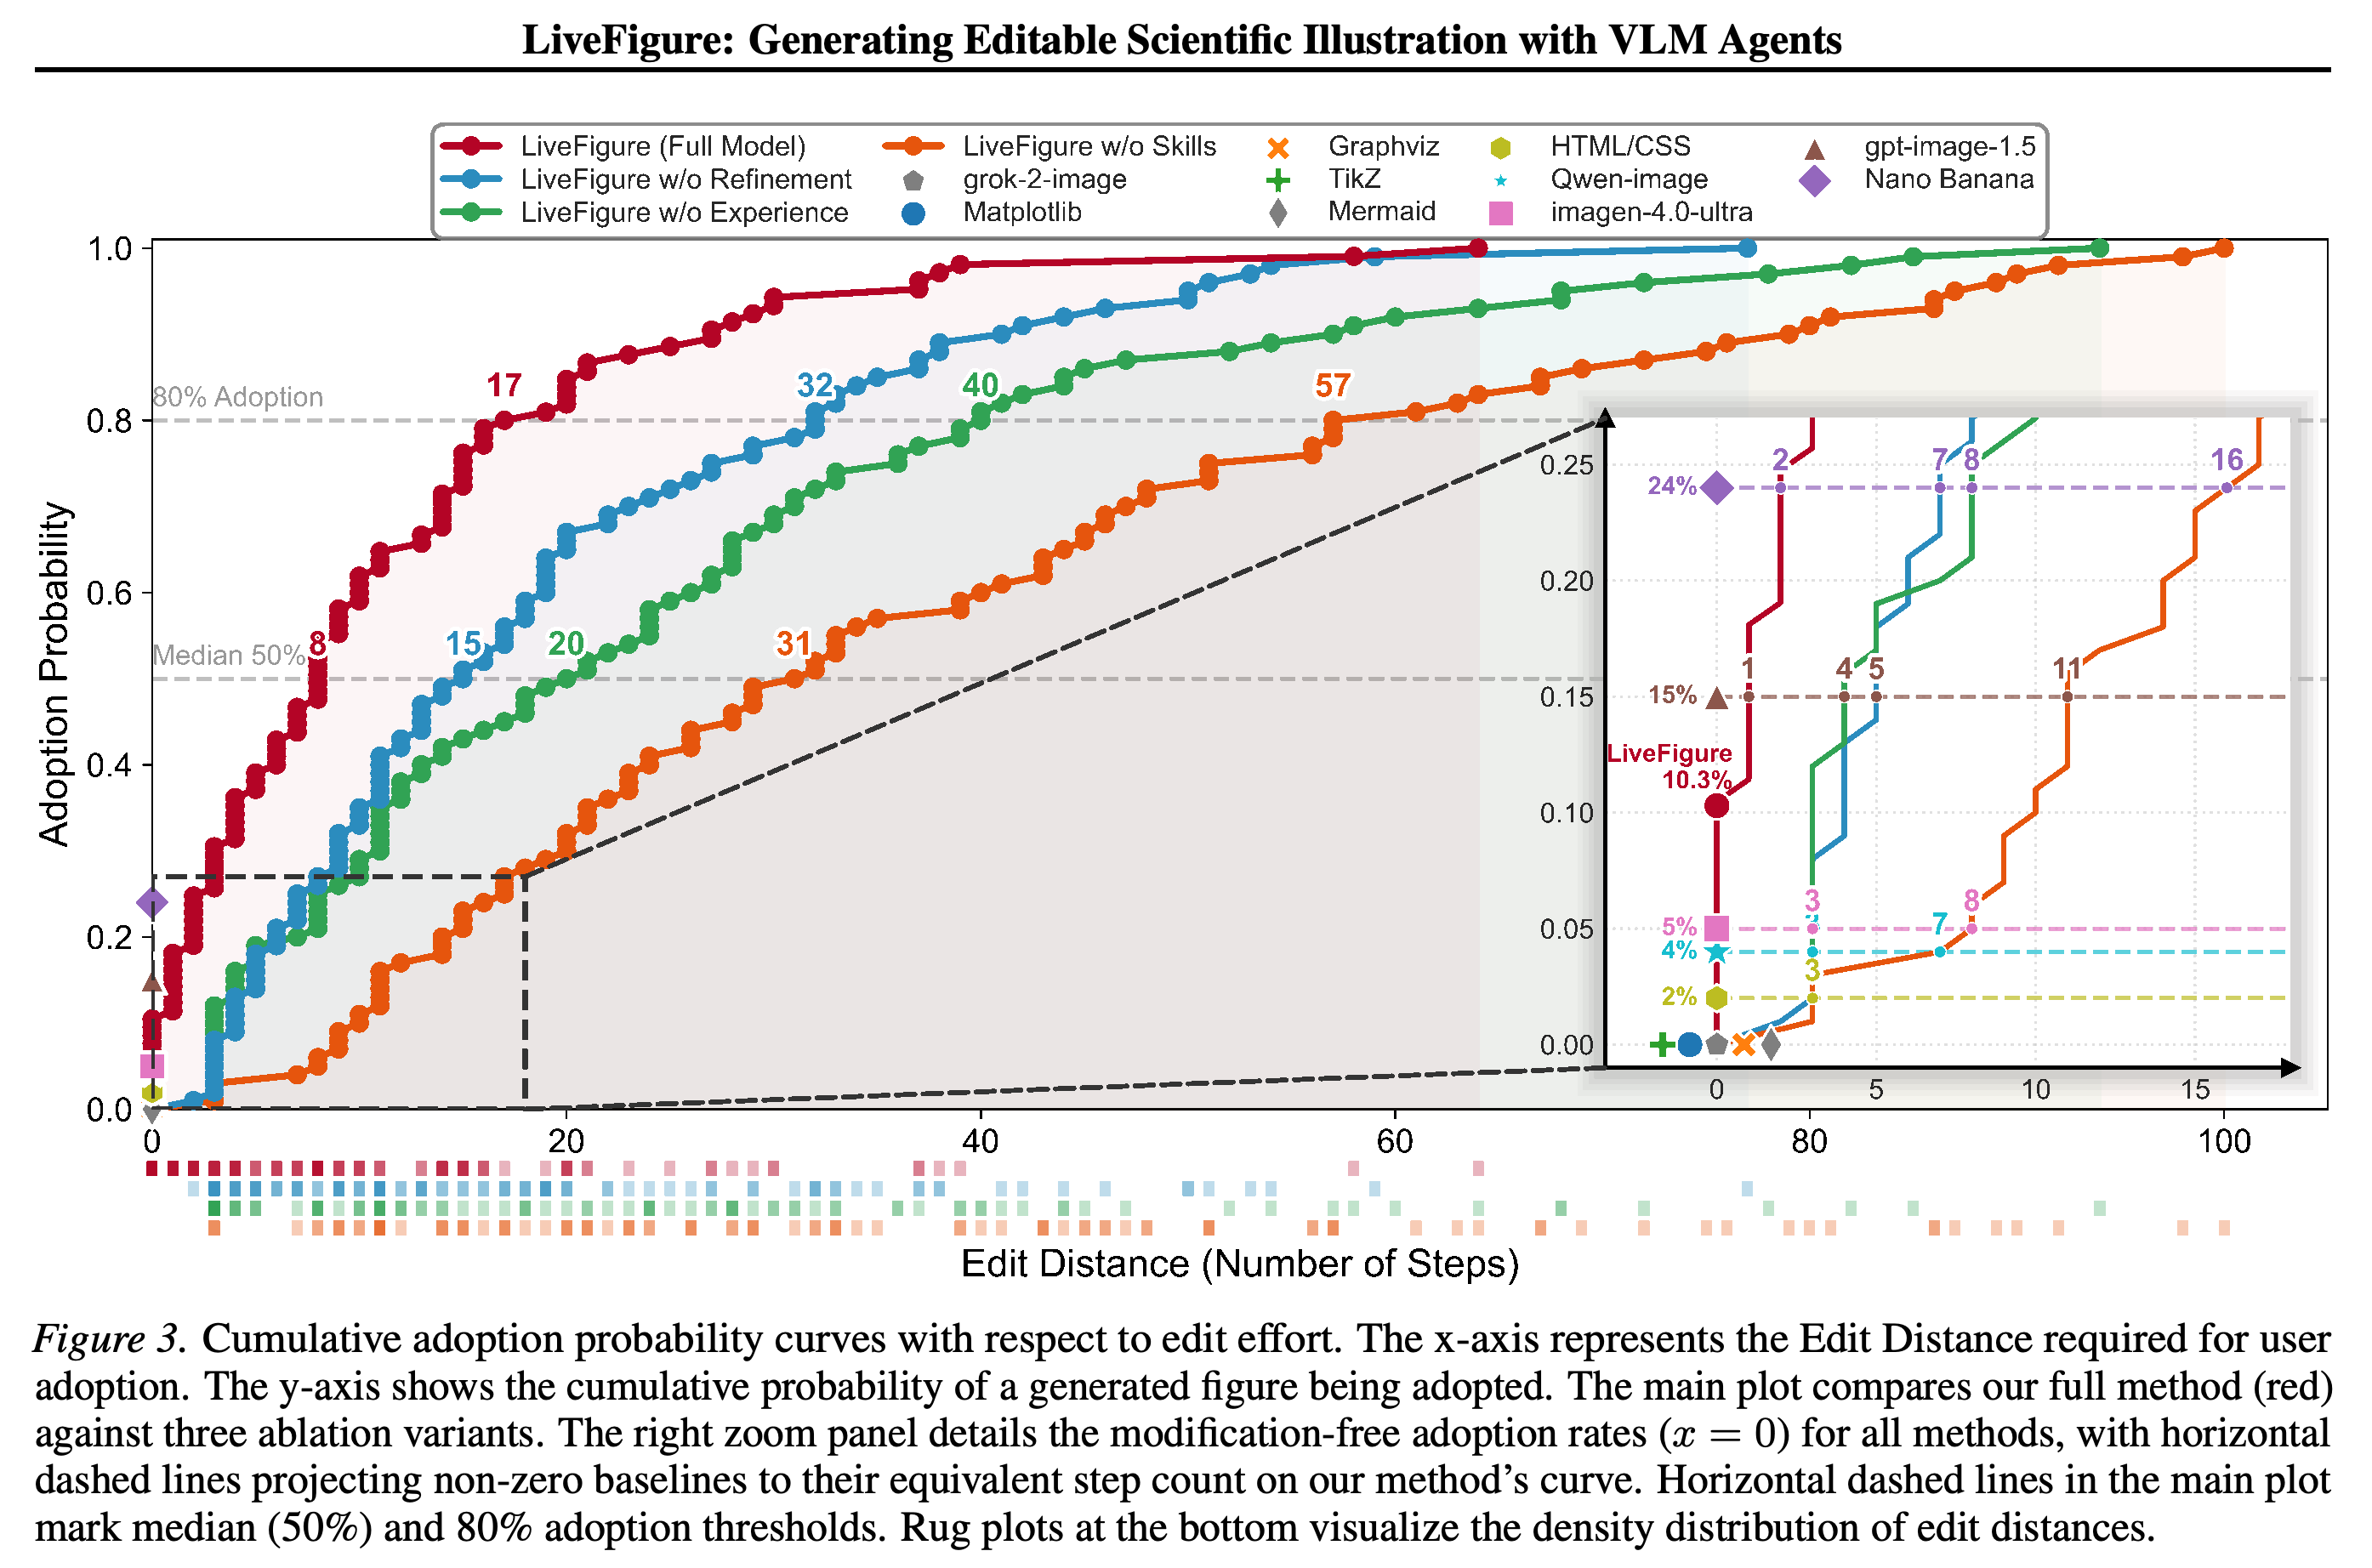
The full system reaches 50% adoption at 8 edits and 80% adoption at 17 edits. Nano Banana and GPT-Image-1.5 have modification-free adoption rates of 24% and 15%, respectively; these rates are not directly equivalent to the full model’s 17-edit 80% threshold. Removing Skills increases median adoption effort to 31 edits, while removing Experience delays median adoption to 20 edits.
The cumulative curves define adoption as a function of Edit Distance and mark the full system's 50% and 80% thresholds at 8 and 17 edits. The ablation curves show the additional editing effort associated with omitting refinement, experience, or skills, while the inset reports modification-free adoption rates for all methods.
4.3. Visual Quality and Content Fidelity Evaluation
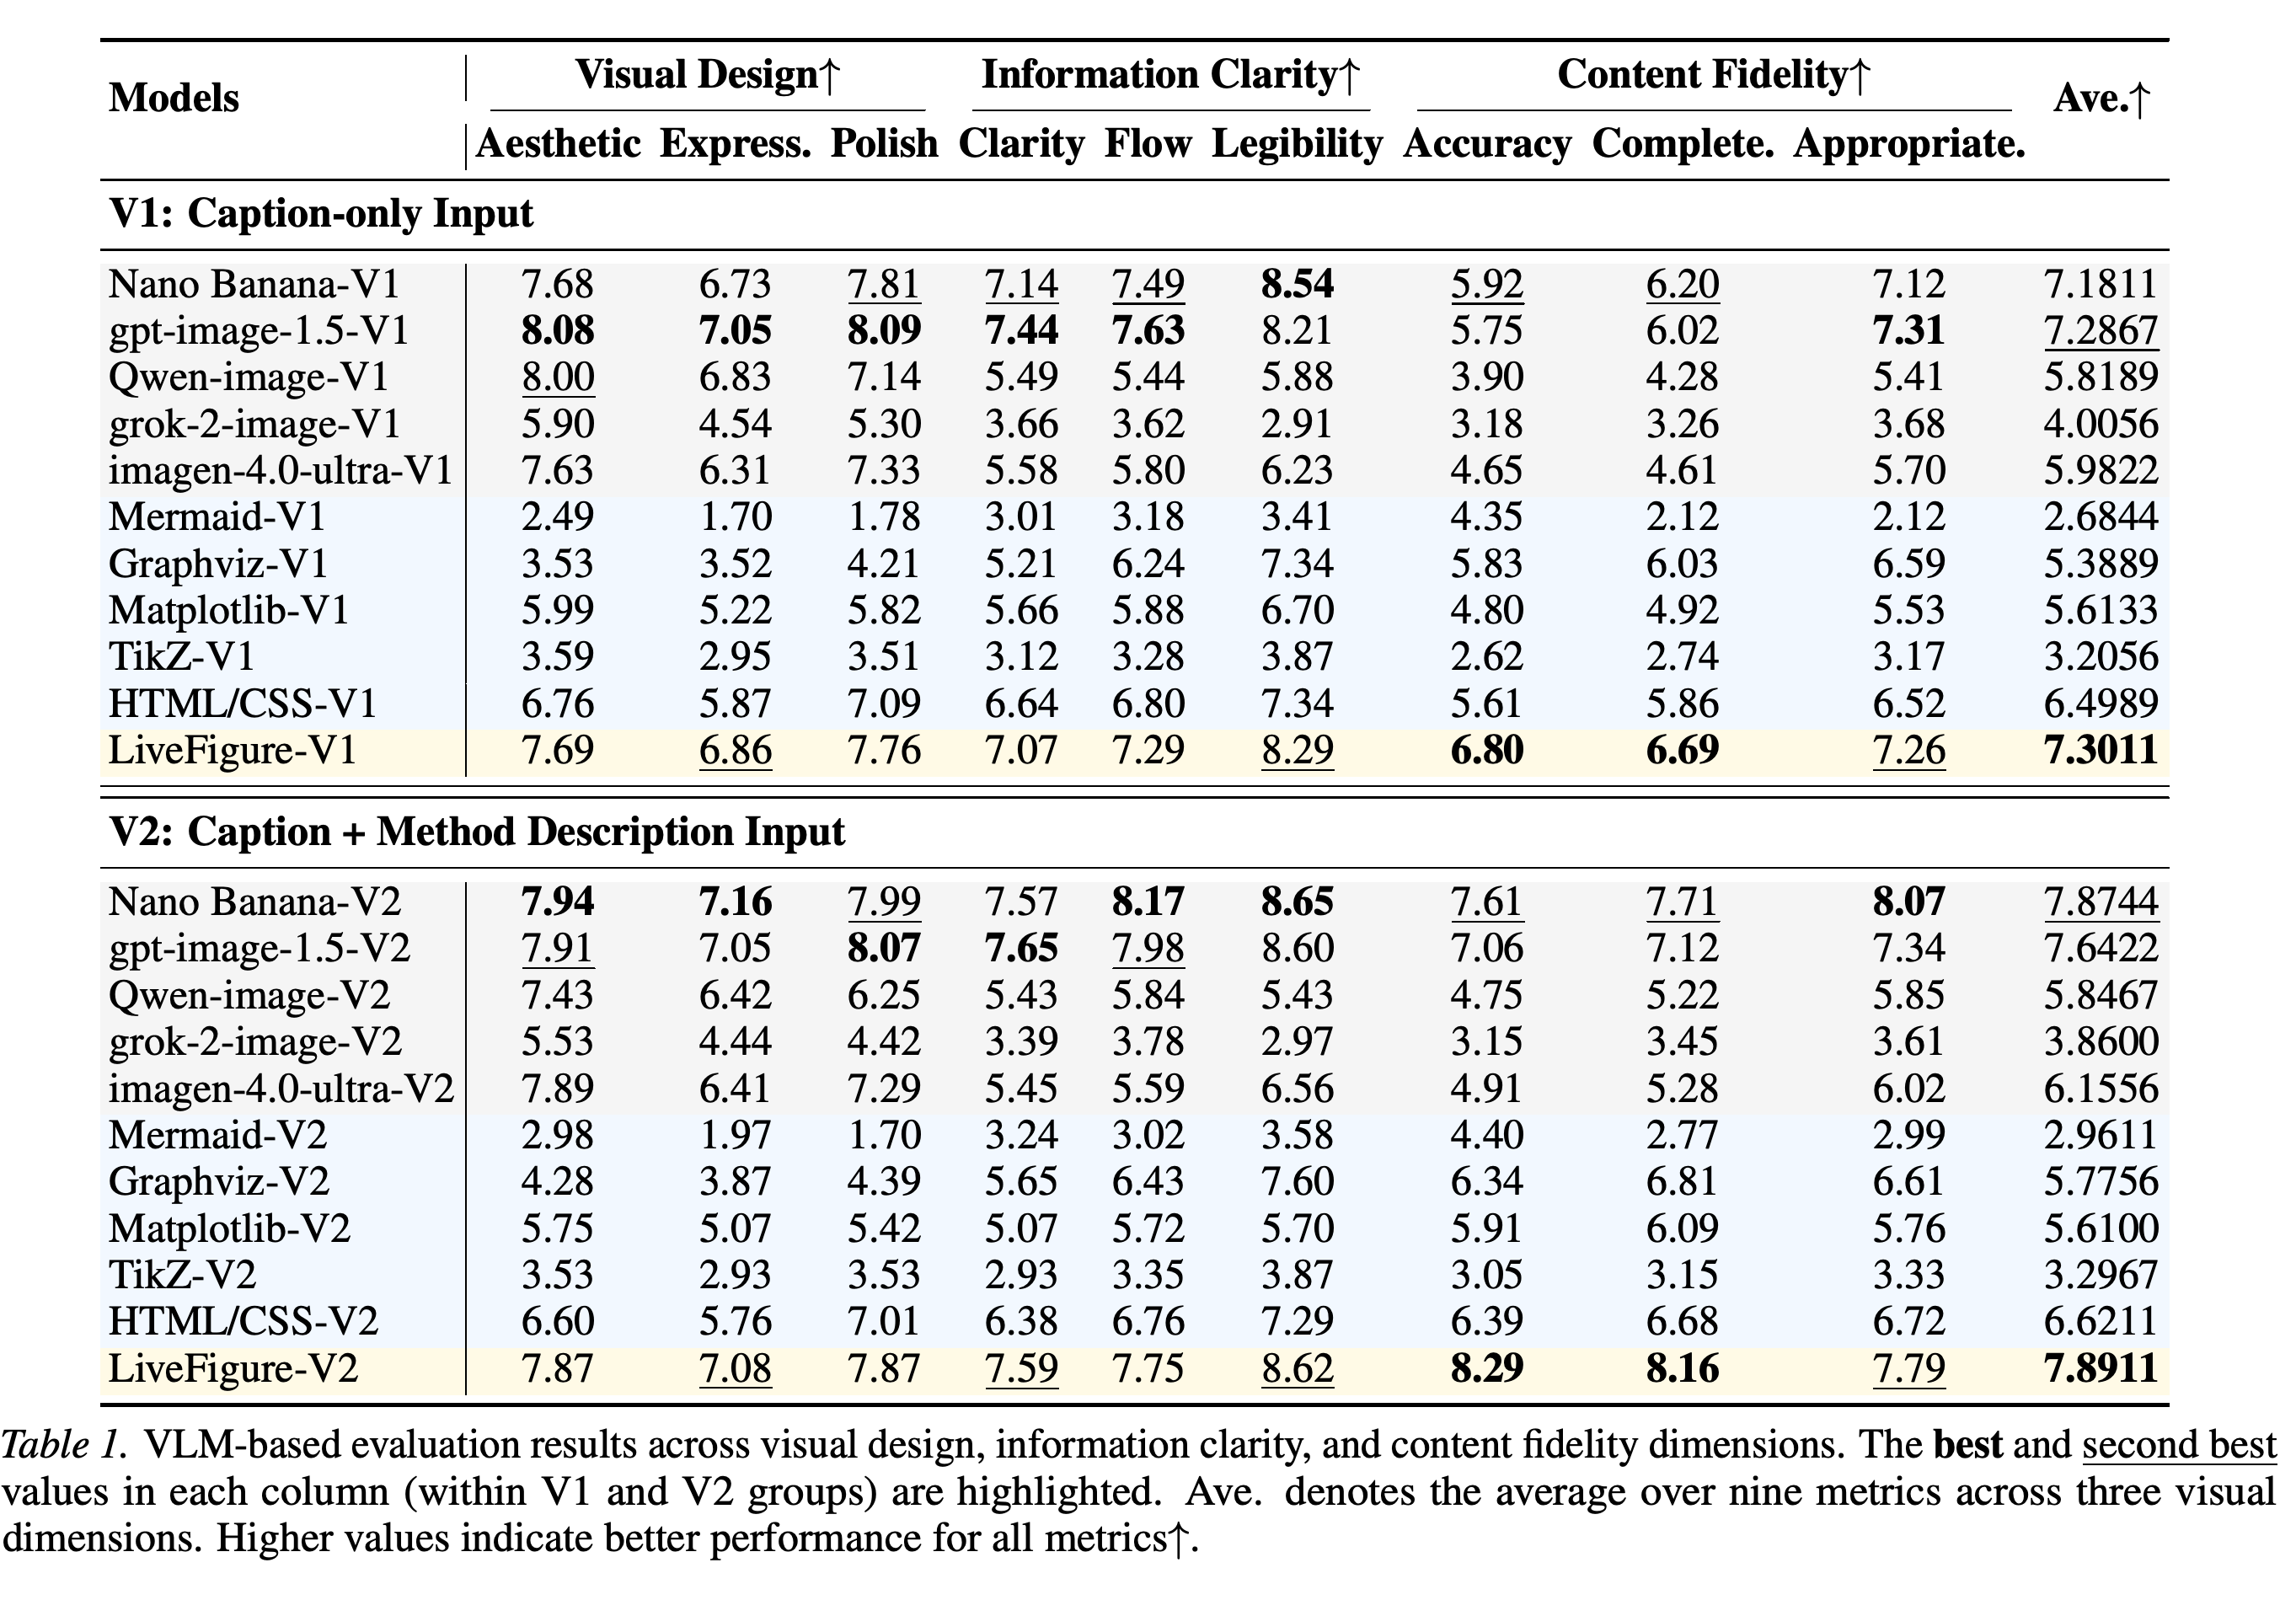
On the nine-metric VLM evaluation, LiveFigure-V2 averages 7.8911, above Graphviz-V2 at 5.7756 and Matplotlib-V2 at 5.6100, and close to Nano Banana-V2 at 7.8744. Its V2 Content Fidelity scores are 8.29 for Accuracy and 8.16 for Completeness, compared with GPT-Image-1.5-V2’s 7.06 and 7.12. The score rises from 7.3011 under V1 to 7.8911 under V2, consistent with the benefit of providing method descriptions in addition to captions.
The table separates visual design, information clarity, and content fidelity for caption-only and caption-plus-method-description inputs. LiveFigure-V2 has the highest listed average, 7.8911, while Nano Banana remains competitive on several visual-design measures.
4.4. Ablation Study
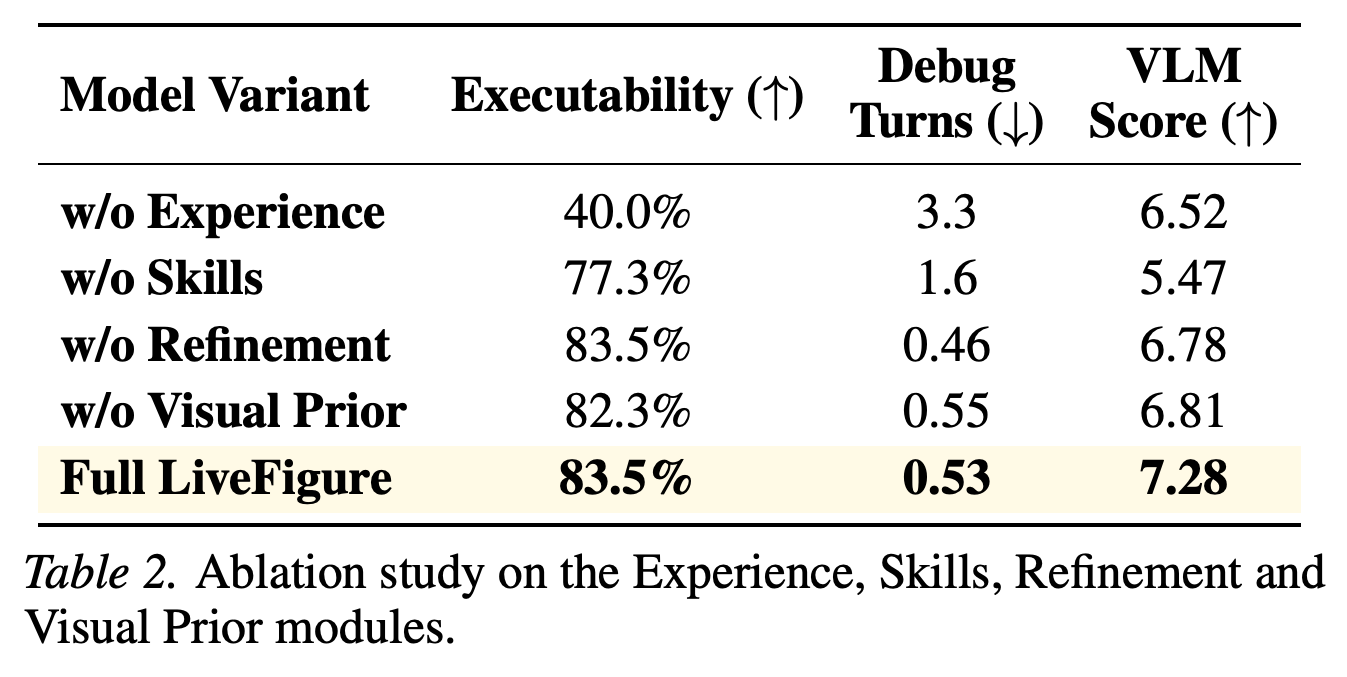
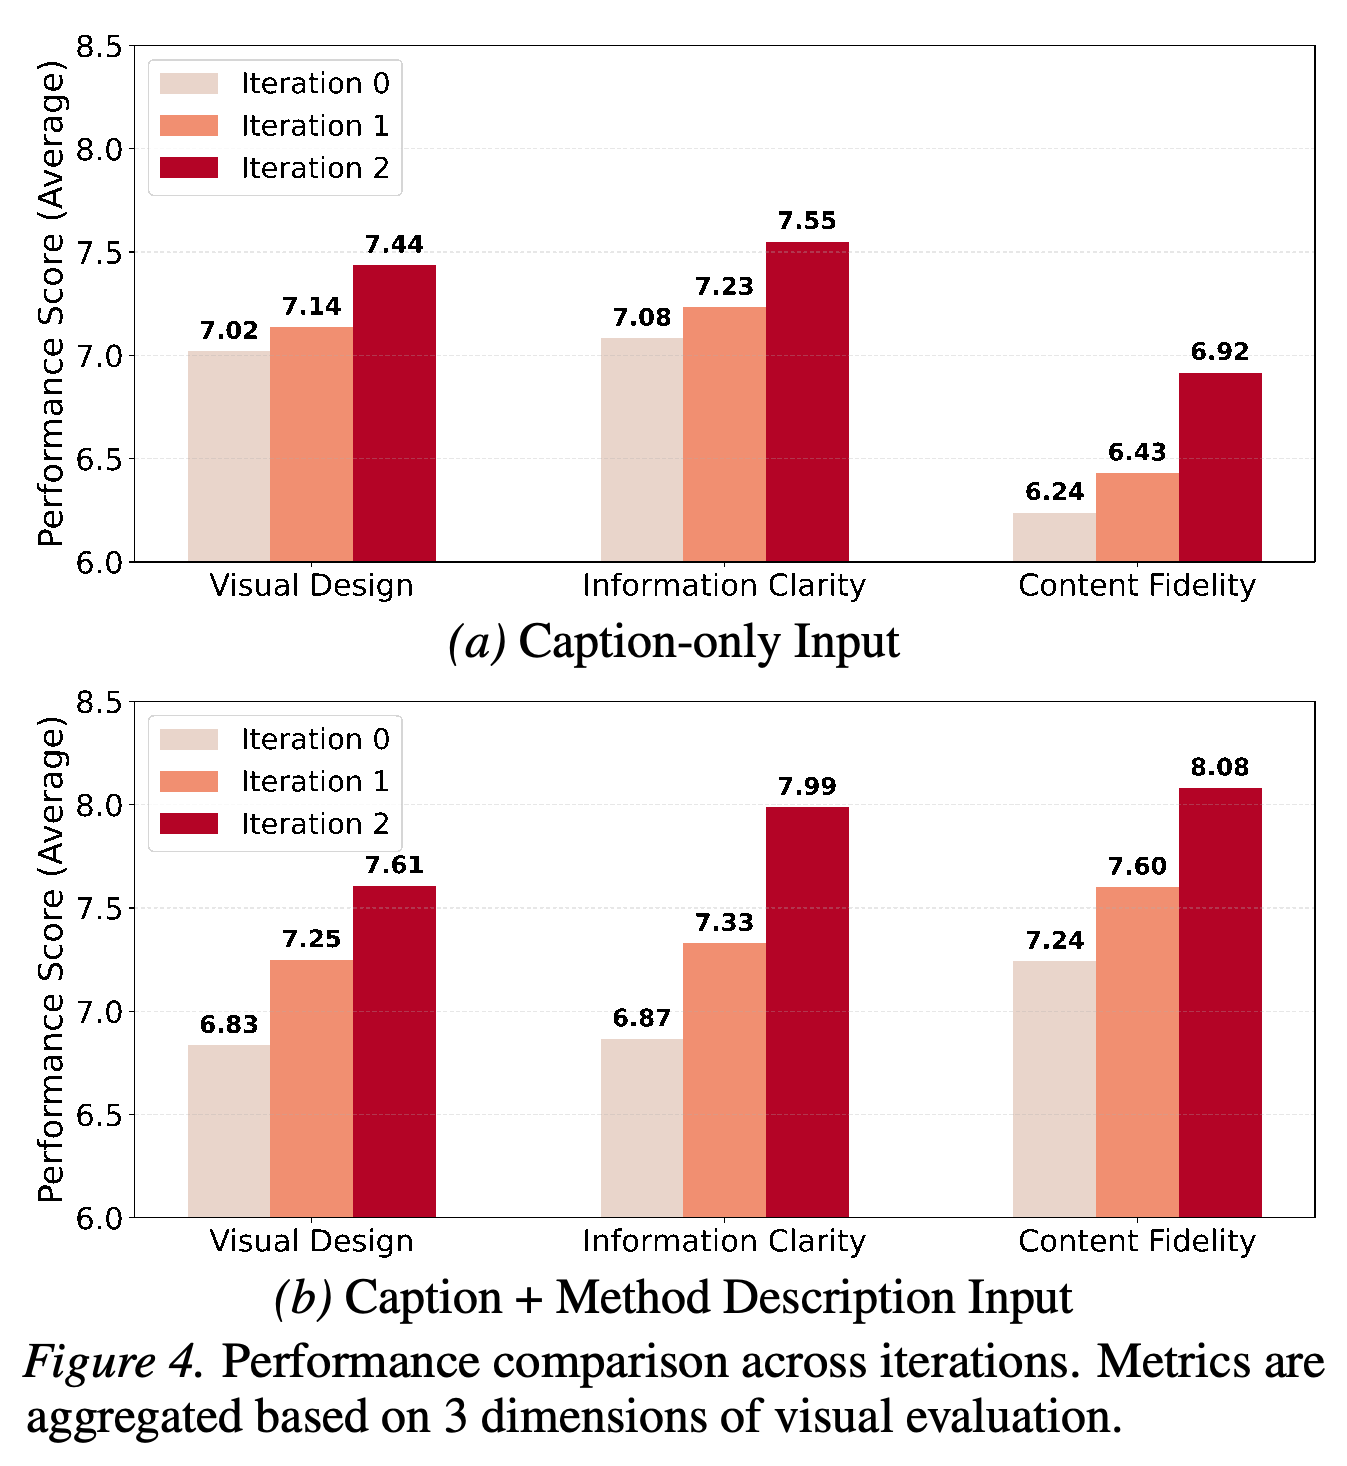
The ablation table assigns distinct roles to the components: without Experience, executability is 40.0% with 3.3 debug turns; without Skills, the VLM score is 5.47; and the full system reports 83.5% executability, 0.53 debug turns, and a 7.28 VLM score. Across two refinement iterations, V2 Information Clarity rises from 6.87 to 7.99 and V2 Content Fidelity from 7.25 to 8.08. Supplementary stage-wise results show executability increasing from 32.5% after visual planning to 83.5% after Skills and Experience are added.
The ablation isolates execution reliability, debugging burden, and VLM score. Removing Experience most reduces executability, whereas removing Skills gives the lowest VLM score; the complete model has the highest reported score.
The grouped bars show improvement through three refinement iterations across visual design, information clarity, and content fidelity under both input conditions. In the V2 setting, Information Clarity increases from 6.87 to 7.99 and Content Fidelity from 7.25 to 8.08.
4.5. Human Evaluation
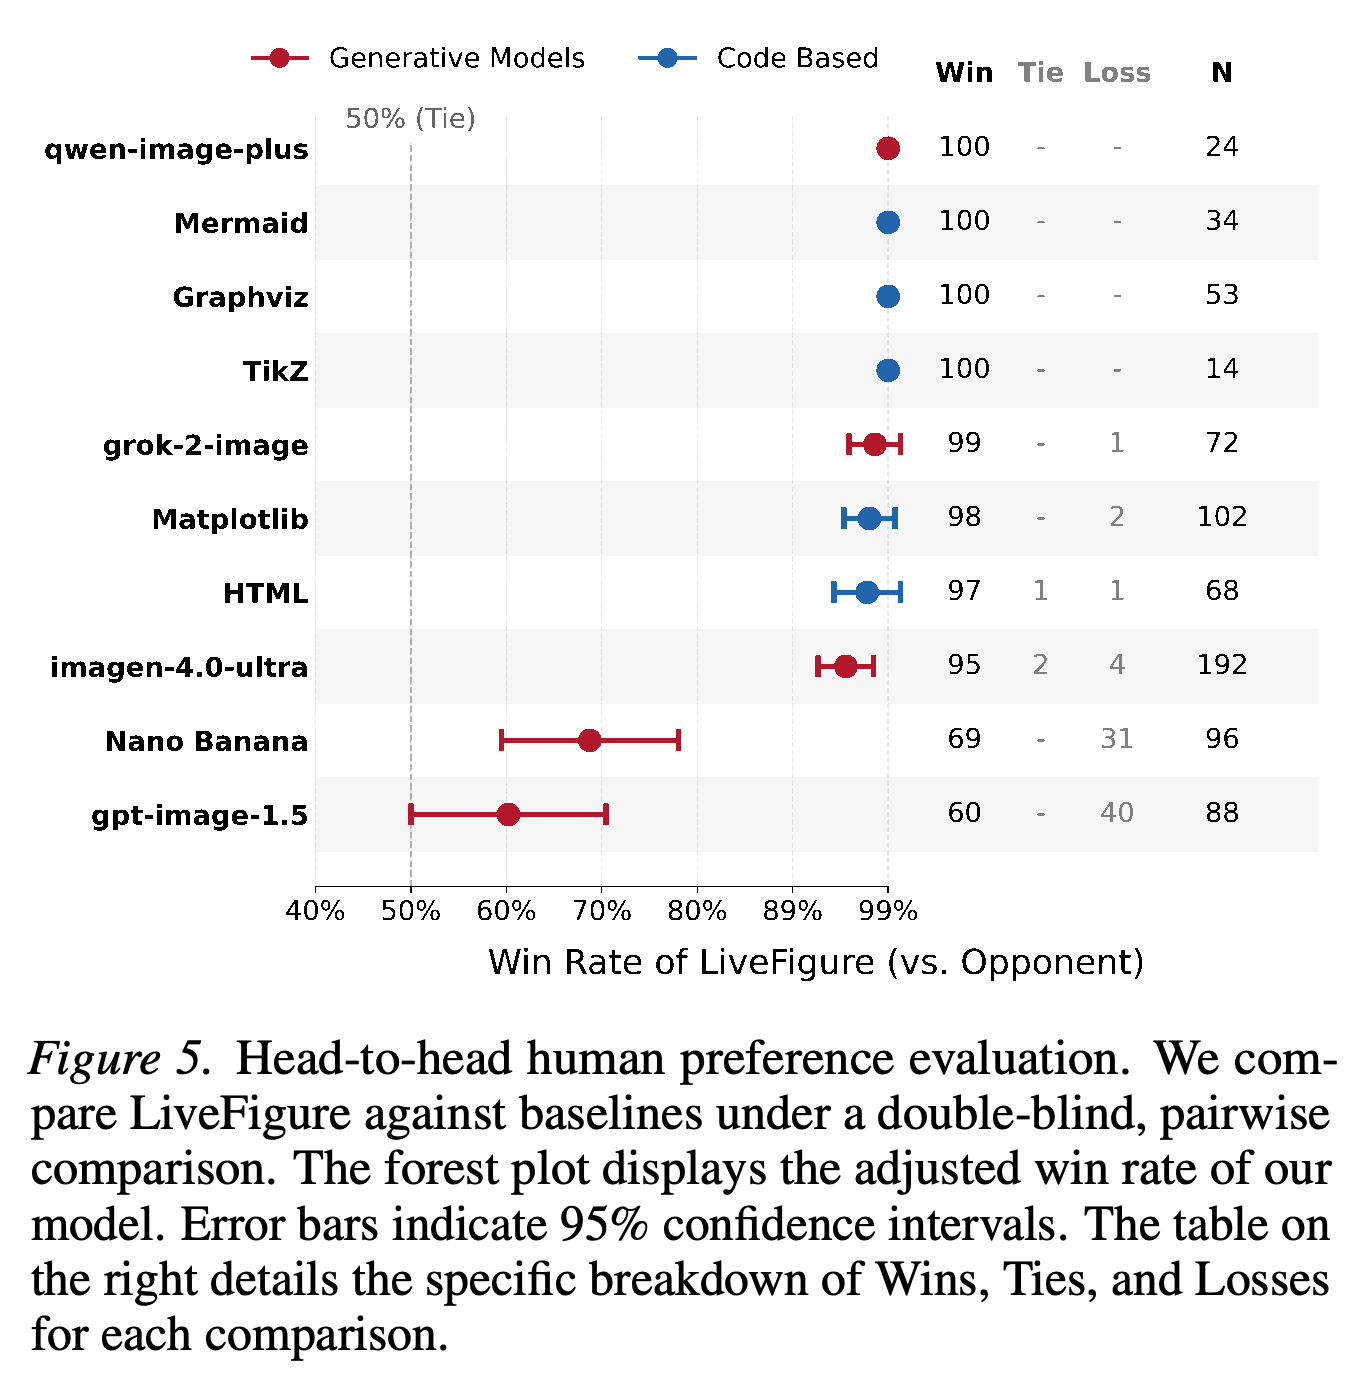
In double-blind pairwise comparisons, LiveFigure has adjusted win rates of 69% against Nano Banana over 96 judgments and 60% against GPT-Image-1.5 over 88 judgments. It reports adjusted win rates above 97% against several code-based methods, with reported 95% confidence intervals above 50%. These findings concern expert judgments of information accuracy and visual clarity, while the automatic visual evaluation remains VLM-based.
The forest plot and win–tie–loss table present the blinded human-preference evidence. The adjusted win rates are 69% against Nano Banana and 60% against GPT-Image-1.5, with larger reported margins against the displayed code-based baselines.
Appendix
- The appendix reports an average end-to-end cost of approximately $0.80 and approximately 3 minutes per figure: $0.38 for two image-generation calls and $0.42 for 12 VLM calls. It documents knowledge-base and test-set construction, PowerPoint-format rationale, evaluation prompts, stage-wise results, object-level editability, biology and interactive-editing examples, and a dense-diagram failure case with approximately 44 textual nodes and nearly 30 logical connections. The authors identify over-complicated visualizations and limited fine-grained style control as limitations, proposing RLHF and venue-annotated style data as future directions.
Brief Thoughts
The paper makes editability a primary output criterion by generating structured PPTX objects and measuring the manual intervention required after generation. Its evidence combines lower reported edit counts, module ablations, VLM-based visual scores, and blinded preference judgments. Important qualifications are that publication readiness is operationalized through expert judgment and VLM scoring, the benchmark is restricted to schematics from AI conference papers, and crowded connector routing remains an explicit failure mode.