


SimpleQA Verified: A Reliable Factuality Benchmark to Measure Parametric Knowledge | Summary
09 Sep 2025 | Paper Review LLM Evaluation Data Curation LLM-as-a-JudgeContents
This article explains the key points of SimpleQA Verified: A Reliable Factuality Benchmark to Measure Parametric Knowledge.
- 2025-09-09 (arXiv)
- Haas, Lukas, Yona, Gal, D’Antonio, Giovanni, Goldshtein, Sasha, Das, Dipanjan.
- Google DeepMind, Google Research
- Paper
- Project Page
Summary
- SimpleQA Verified addresses unreliable evaluation of large language models (LLMs), text-generating models evaluated here for factual recall, caused by incorrect reference answers, repeated questions, and uneven topic coverage in SimpleQA, a short-answer factuality benchmark. On its 1,000-question evaluation with standard application programming interface (API) parameters and no tools, Gemini 2.5 Pro achieves an F1-Score of 55.6%, compared with 52.3% for GPT 5 and 51.9% for o3; F1 here is the harmonic mean of accuracy over all questions and accuracy over attempted answers.
- The benchmark measures parametric factuality, meaning recall of facts stored in model parameters without external assistance. The authors reduce 4,326 SimpleQA questions to 1,000 through source and question deduplication, publisher-access filtering, answer-type and topic balancing, source reconciliation, and selection of difficult questions.
- The revised autorater, an LLM prompted to grade model answers, uses explicit numeric acceptance ranges and clearer rules for direct answers, uncertainty, and abstention, meaning responses that do not attempt an answer. The authors report near-perfect performance when tools are enabled, so the benchmark is intended for factual recall without tools. They provide examples motivating the grader revisions but no aggregate comparison against an independent human-labeled test set.
1. Introduction
The paper distinguishes factual recall from grounding, which evaluates answers against supplied context, and retrieval-augmented evaluation, which permits search for external information. SimpleQA remains difficult after older benchmarks become saturated, meaning modern models score too highly for those benchmarks to distinguish their capabilities. Incorrect reference answers, narrow source coverage, and repeated question patterns can nevertheless obscure whether SimpleQA score gains reflect better factual recall.
- SimpleQA Verified retains the short-form question-answer format while revising both the dataset and its grading procedure.
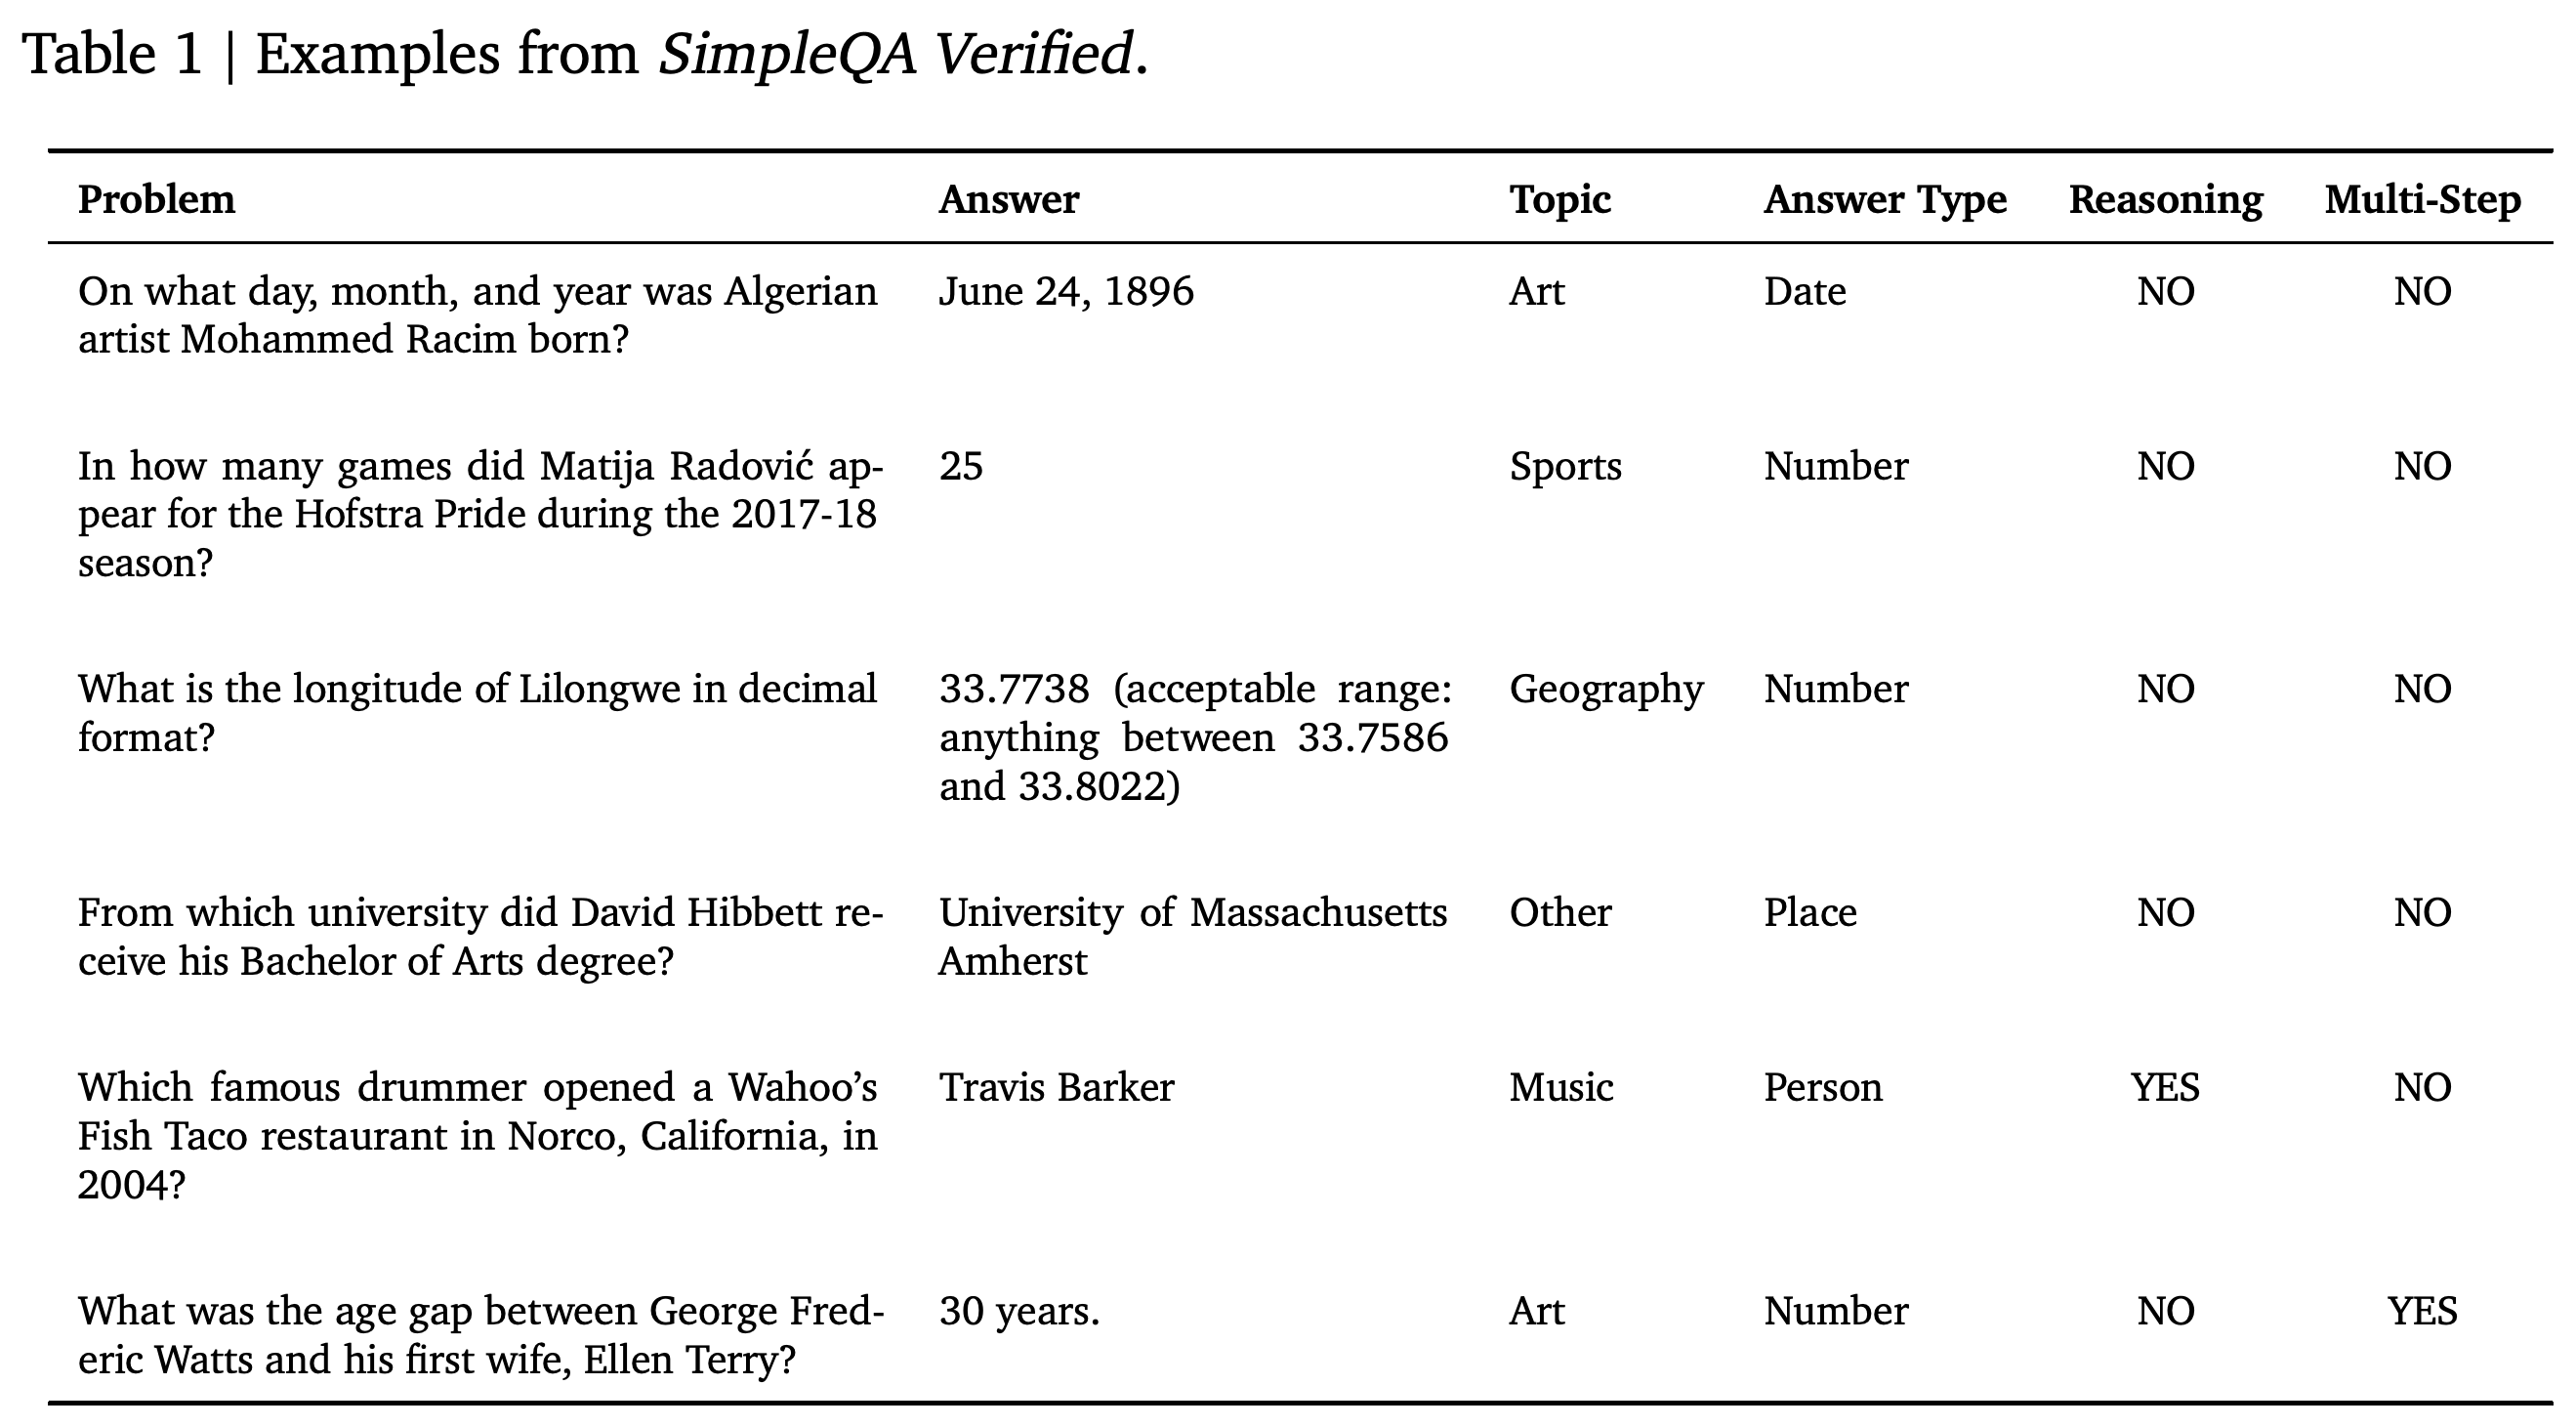
- Table 1 illustrates date, number, place, and person answers, including numeric acceptance ranges and labels indicating reasoning or multiple information steps.
The examples show that evaluation records include topic, answer type, reasoning, and multi-step labels alongside the question and answer. The Lilongwe longitude example demonstrates how a numeric target can carry an explicit acceptable interval.
2. SimpleQA Verified
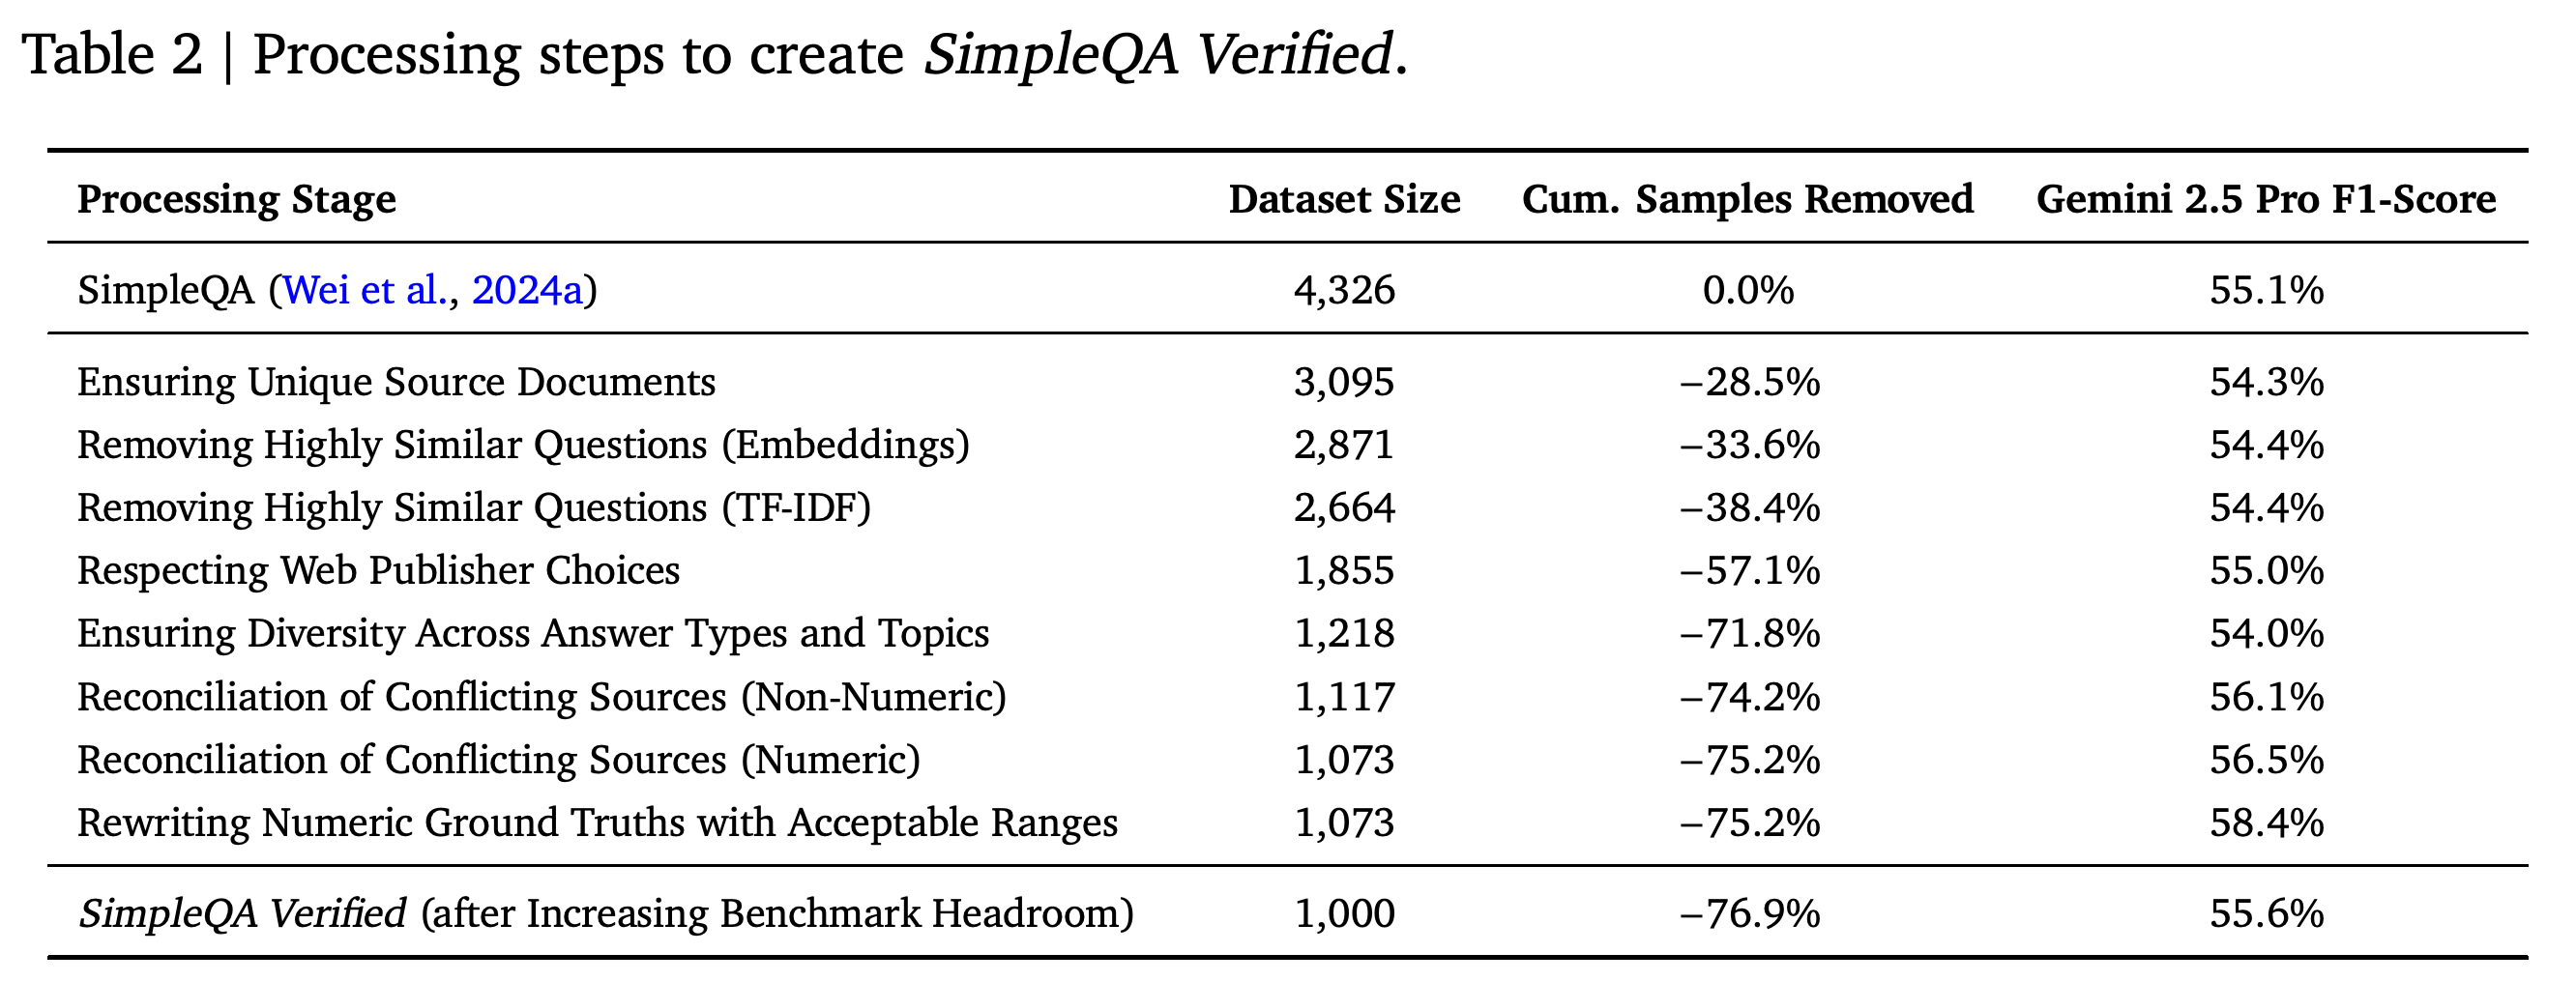
The authors perform the curation themselves and document the successive dataset sizes in Table 2. The complete process removes 76.9% of the original questions, while Gemini 2.5 Pro’s reported F1-Score changes from 55.1% on SimpleQA to 55.6% on the final benchmark.
- The intermediate score reaches 58.4% after numeric reference answers receive acceptance ranges, before the final difficulty filter reduces it to 55.6%.
- The stages are cumulative: their score changes do not isolate each intervention’s effect on a fixed evaluation set.
Question counts fall from 4,326 to 1,000, while Gemini 2.5 Pro’s F1-Score varies across stages. Numeric acceptance ranges raise the intermediate score from 56.5% to 58.4%, and the final difficulty filter lowers it to 55.6%. These cumulative results show how grading changes and question selection affect the score.
2.1. Ensuring Unique Source Documents
The authors enforce unique reference URLs across questions to reduce repeated coverage of the same source documents. Every original SimpleQA question has at least two reference URLs supplied by distinct human raters. This filter reduces the dataset from 4,326 to 3,095 questions, a 28.5% reduction.
- Within a group sharing a reference URL, they randomly retain a question answered incorrectly by all of GPT-4o, Gemini 2.0 Flash, and Claude 3.7 Sonnet.
- If no question meets that condition, they retain a randomly chosen question. This procedure preserves headroom, meaning remaining opportunity for models to improve their scores.
2.2. Removing Highly Similar Questions
Semantic deduplication, removal of questions with similar meanings, uses Gemini Embeddings, vector representations of questions, with a cosine similarity cutoff of 0.77; cosine similarity compares the directions of those vectors. Applying the earlier difficulty-selection procedure reduces the dataset from 3,095 to 2,871 questions, a 7.2% reduction.
- The next stage uses TF-IDF (term frequency–inverse document frequency), a word-weighted representation used here to detect lexical overlap. The authors manually review cases with cosine similarity above 0.4 and retain difficult questions, reducing the dataset from 2,871 to 2,664, another 7.2%.
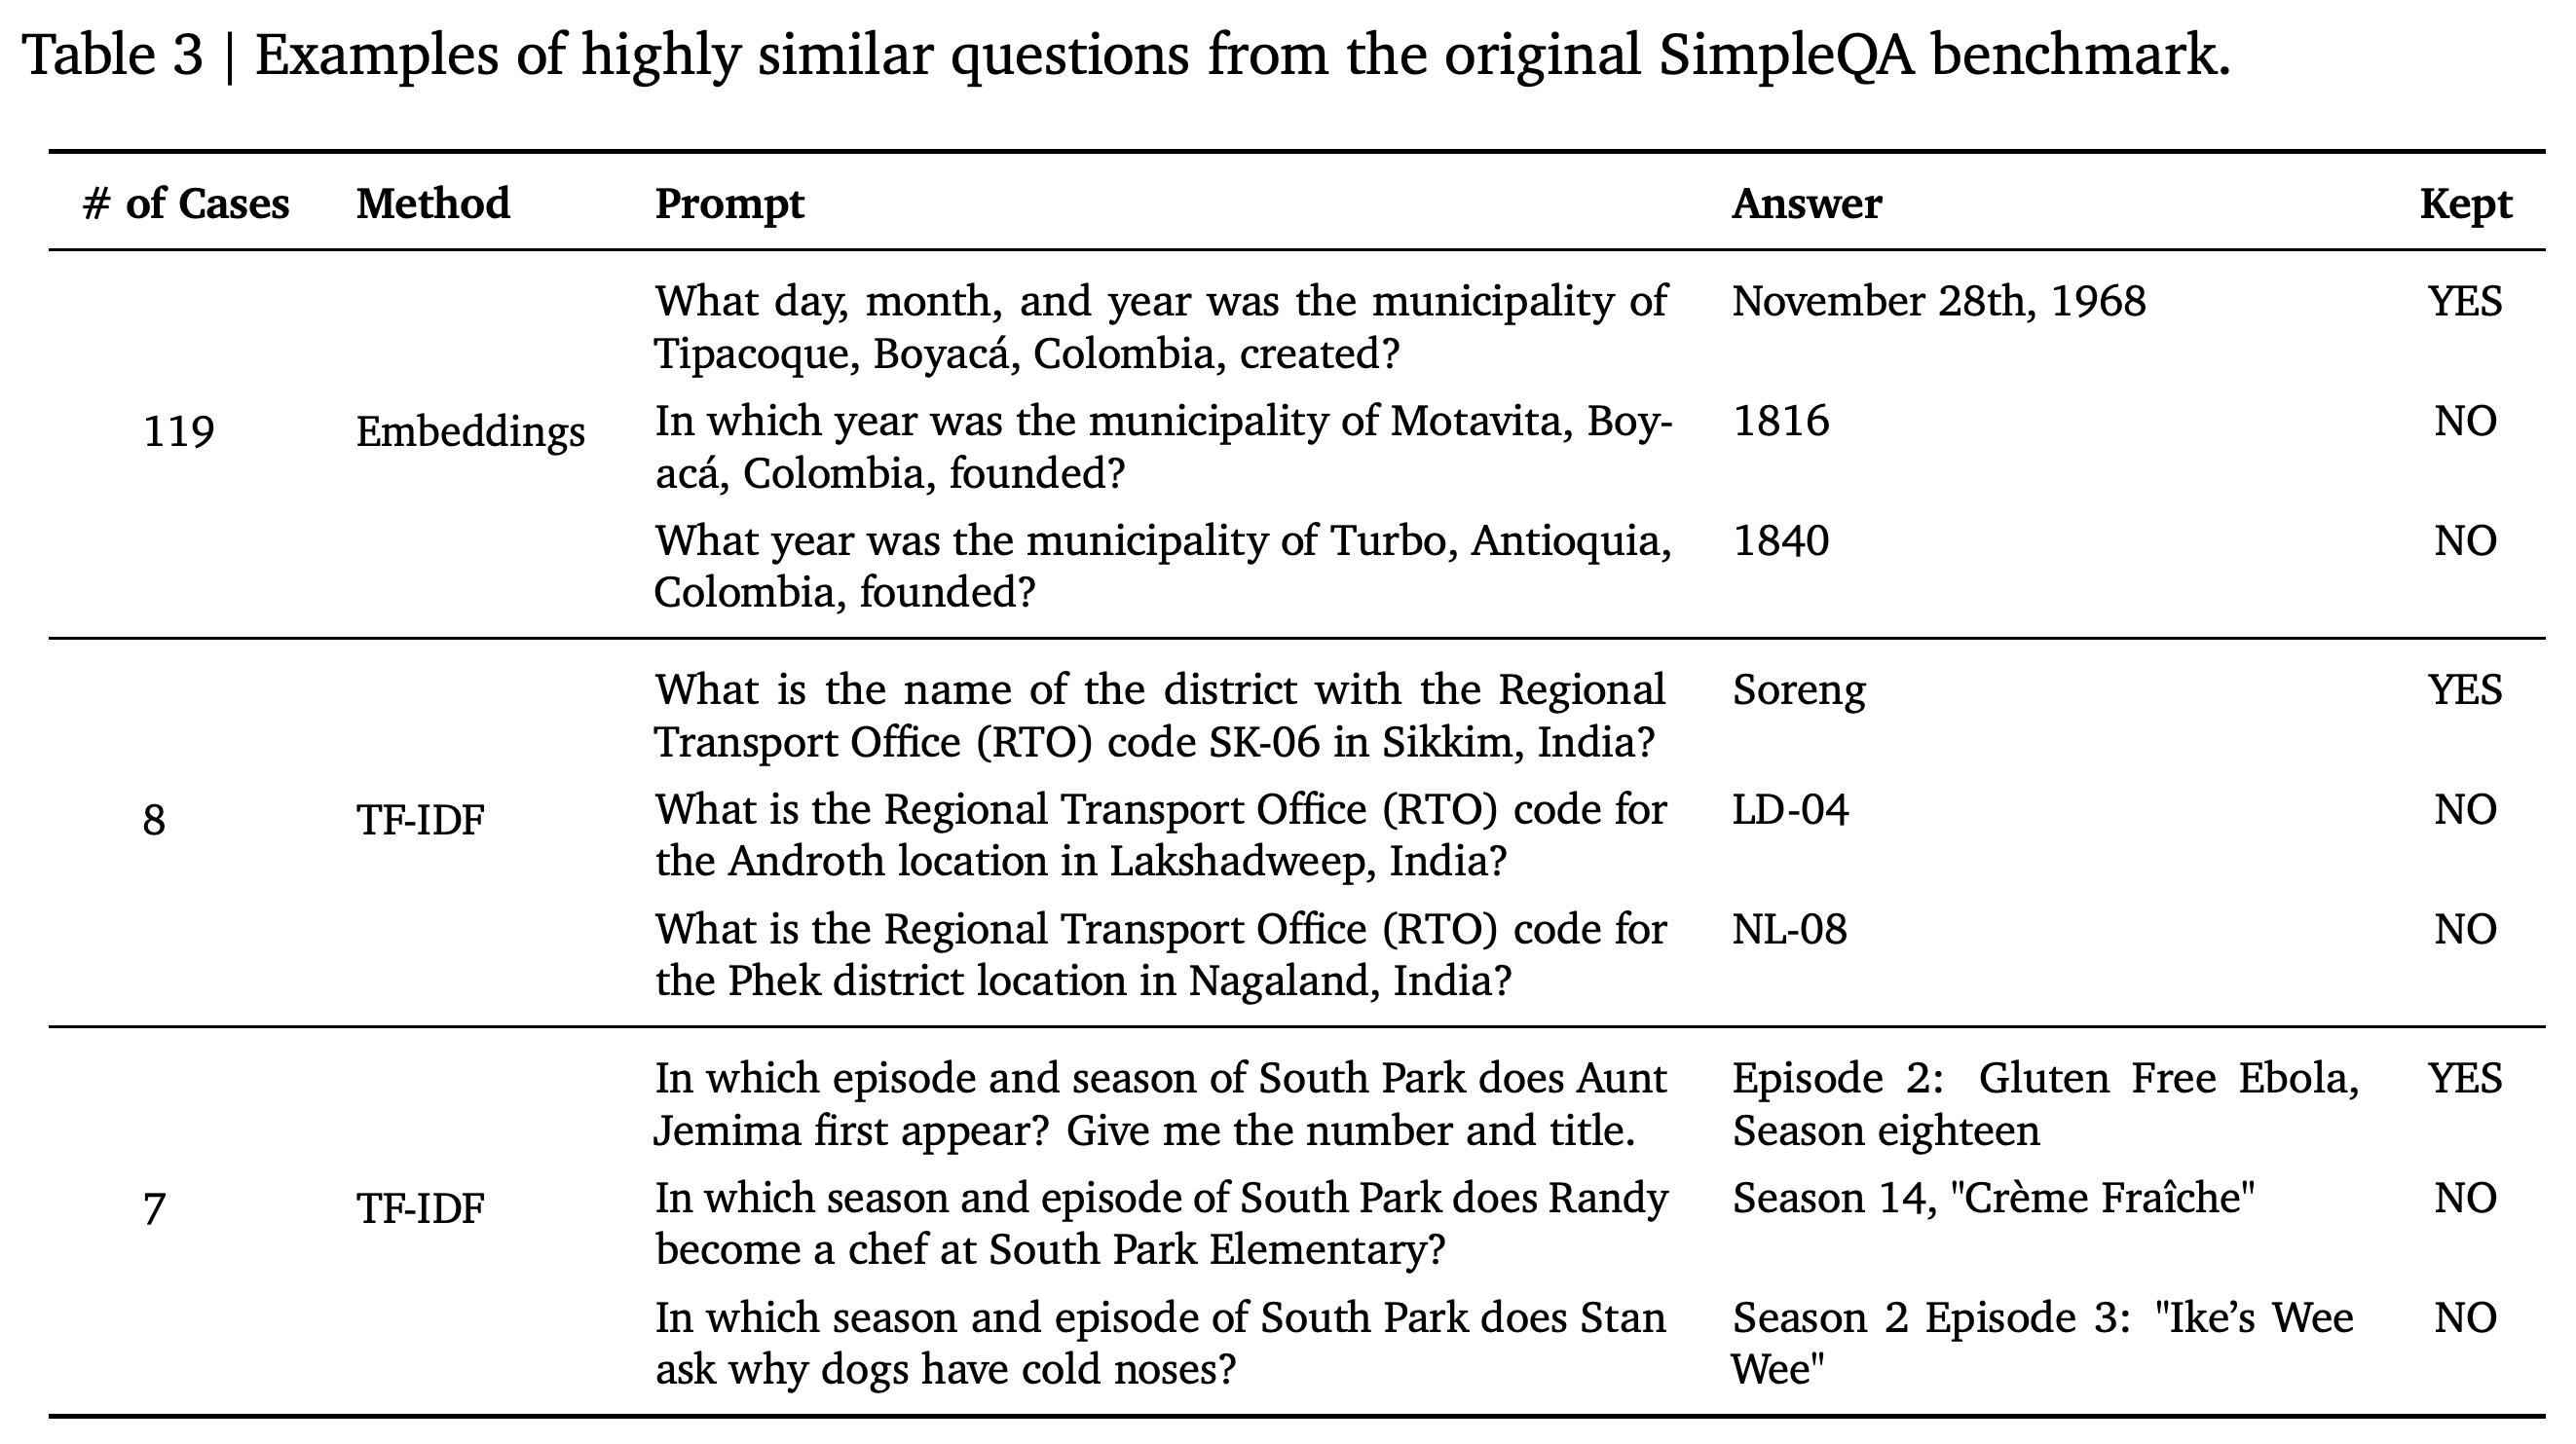
- Table 3 shows repeated templates concerning Colombian municipality founding dates, Indian transport-office codes, and South Park episodes. The 119 municipality questions account for 2.7% of original SimpleQA.
- The suggestion that repeated questions arose from individual raters remains a hypothesis because the original release did not provide rater IDs.
The groups contain different factual targets within repeated question templates. They illustrate redundancy that source-URL filtering alone does not address and show examples identified through semantic similarity and lexical overlap.
2.3. Respecting Web Publisher Choices
The authors remove questions whose reference URLs belong to publishers using robots.txt, a file specifying website access controls, to restrict specified uses by Google, OpenAI, or Anthropic. Because the benchmark includes niche facts available from few websites, this filter is intended to align its sources with publishers’ crawling and model-use preferences.
- The dataset decreases from 2,664 to 1,855 questions, a 30.4% reduction.
- Google-Extended is the paper’s example of a publisher control over specified uses of crawled content for Gemini training and grounding.
2.4. Ensuring Diversity Across Answer Types and Topics
Subsampling prioritizes answer-type balance and then topic balance, while retaining difficult questions using the earlier model-based selection procedure. This reduces the dataset from 1,855 to 1,218 questions, a 34.3% reduction.
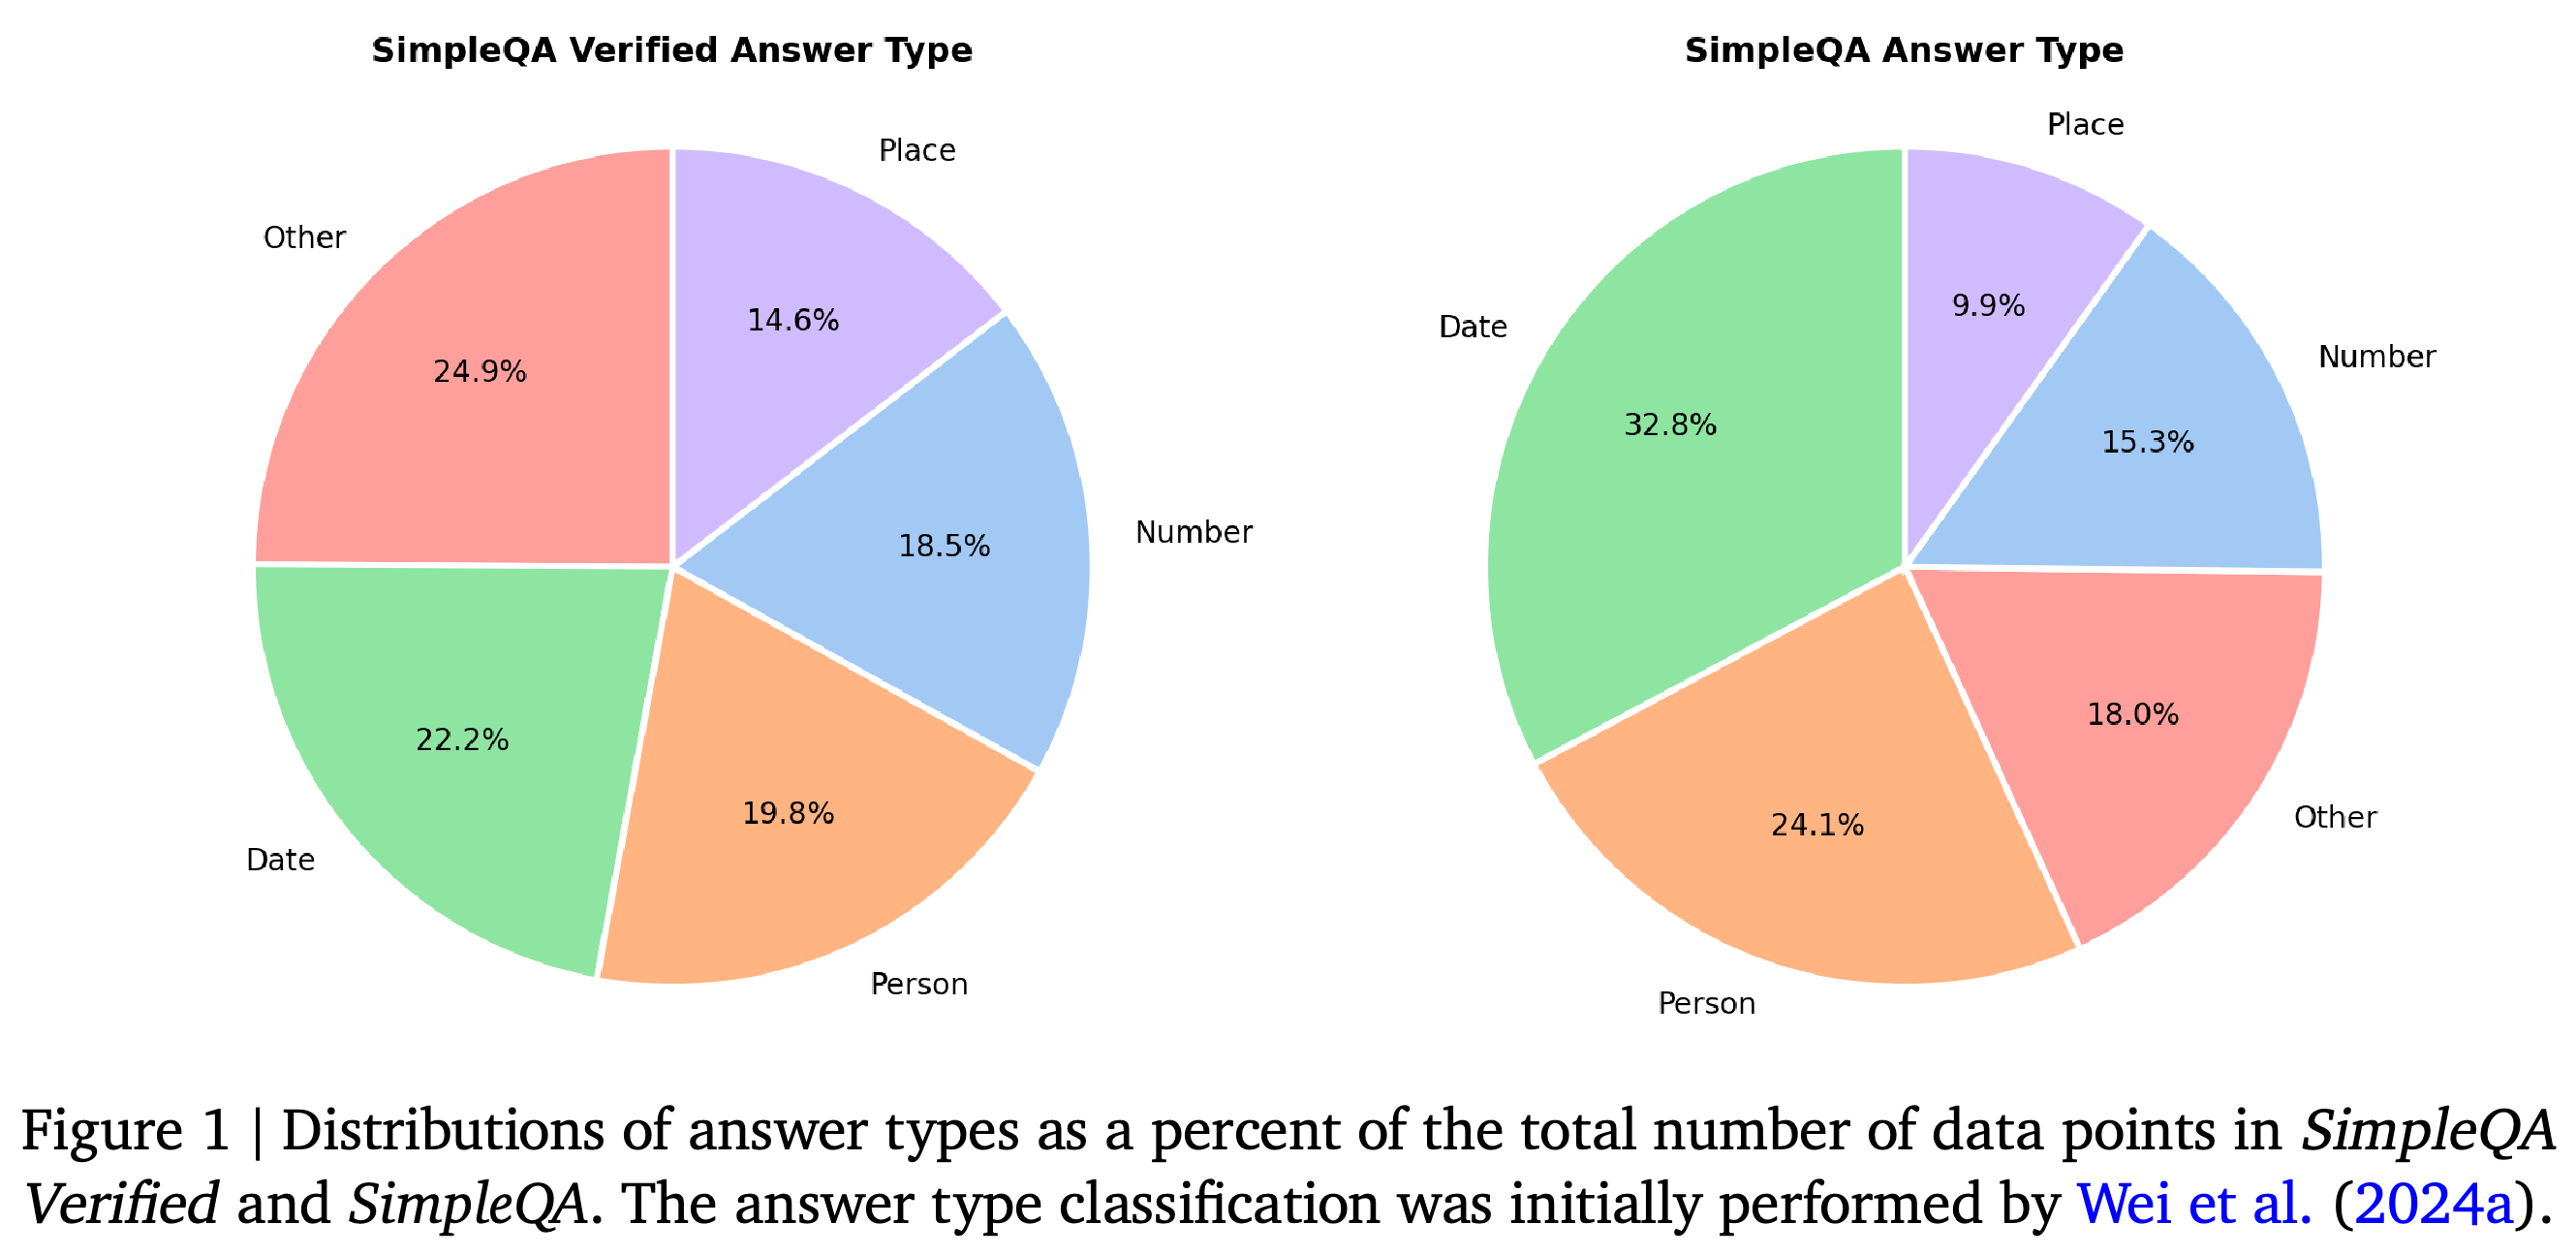
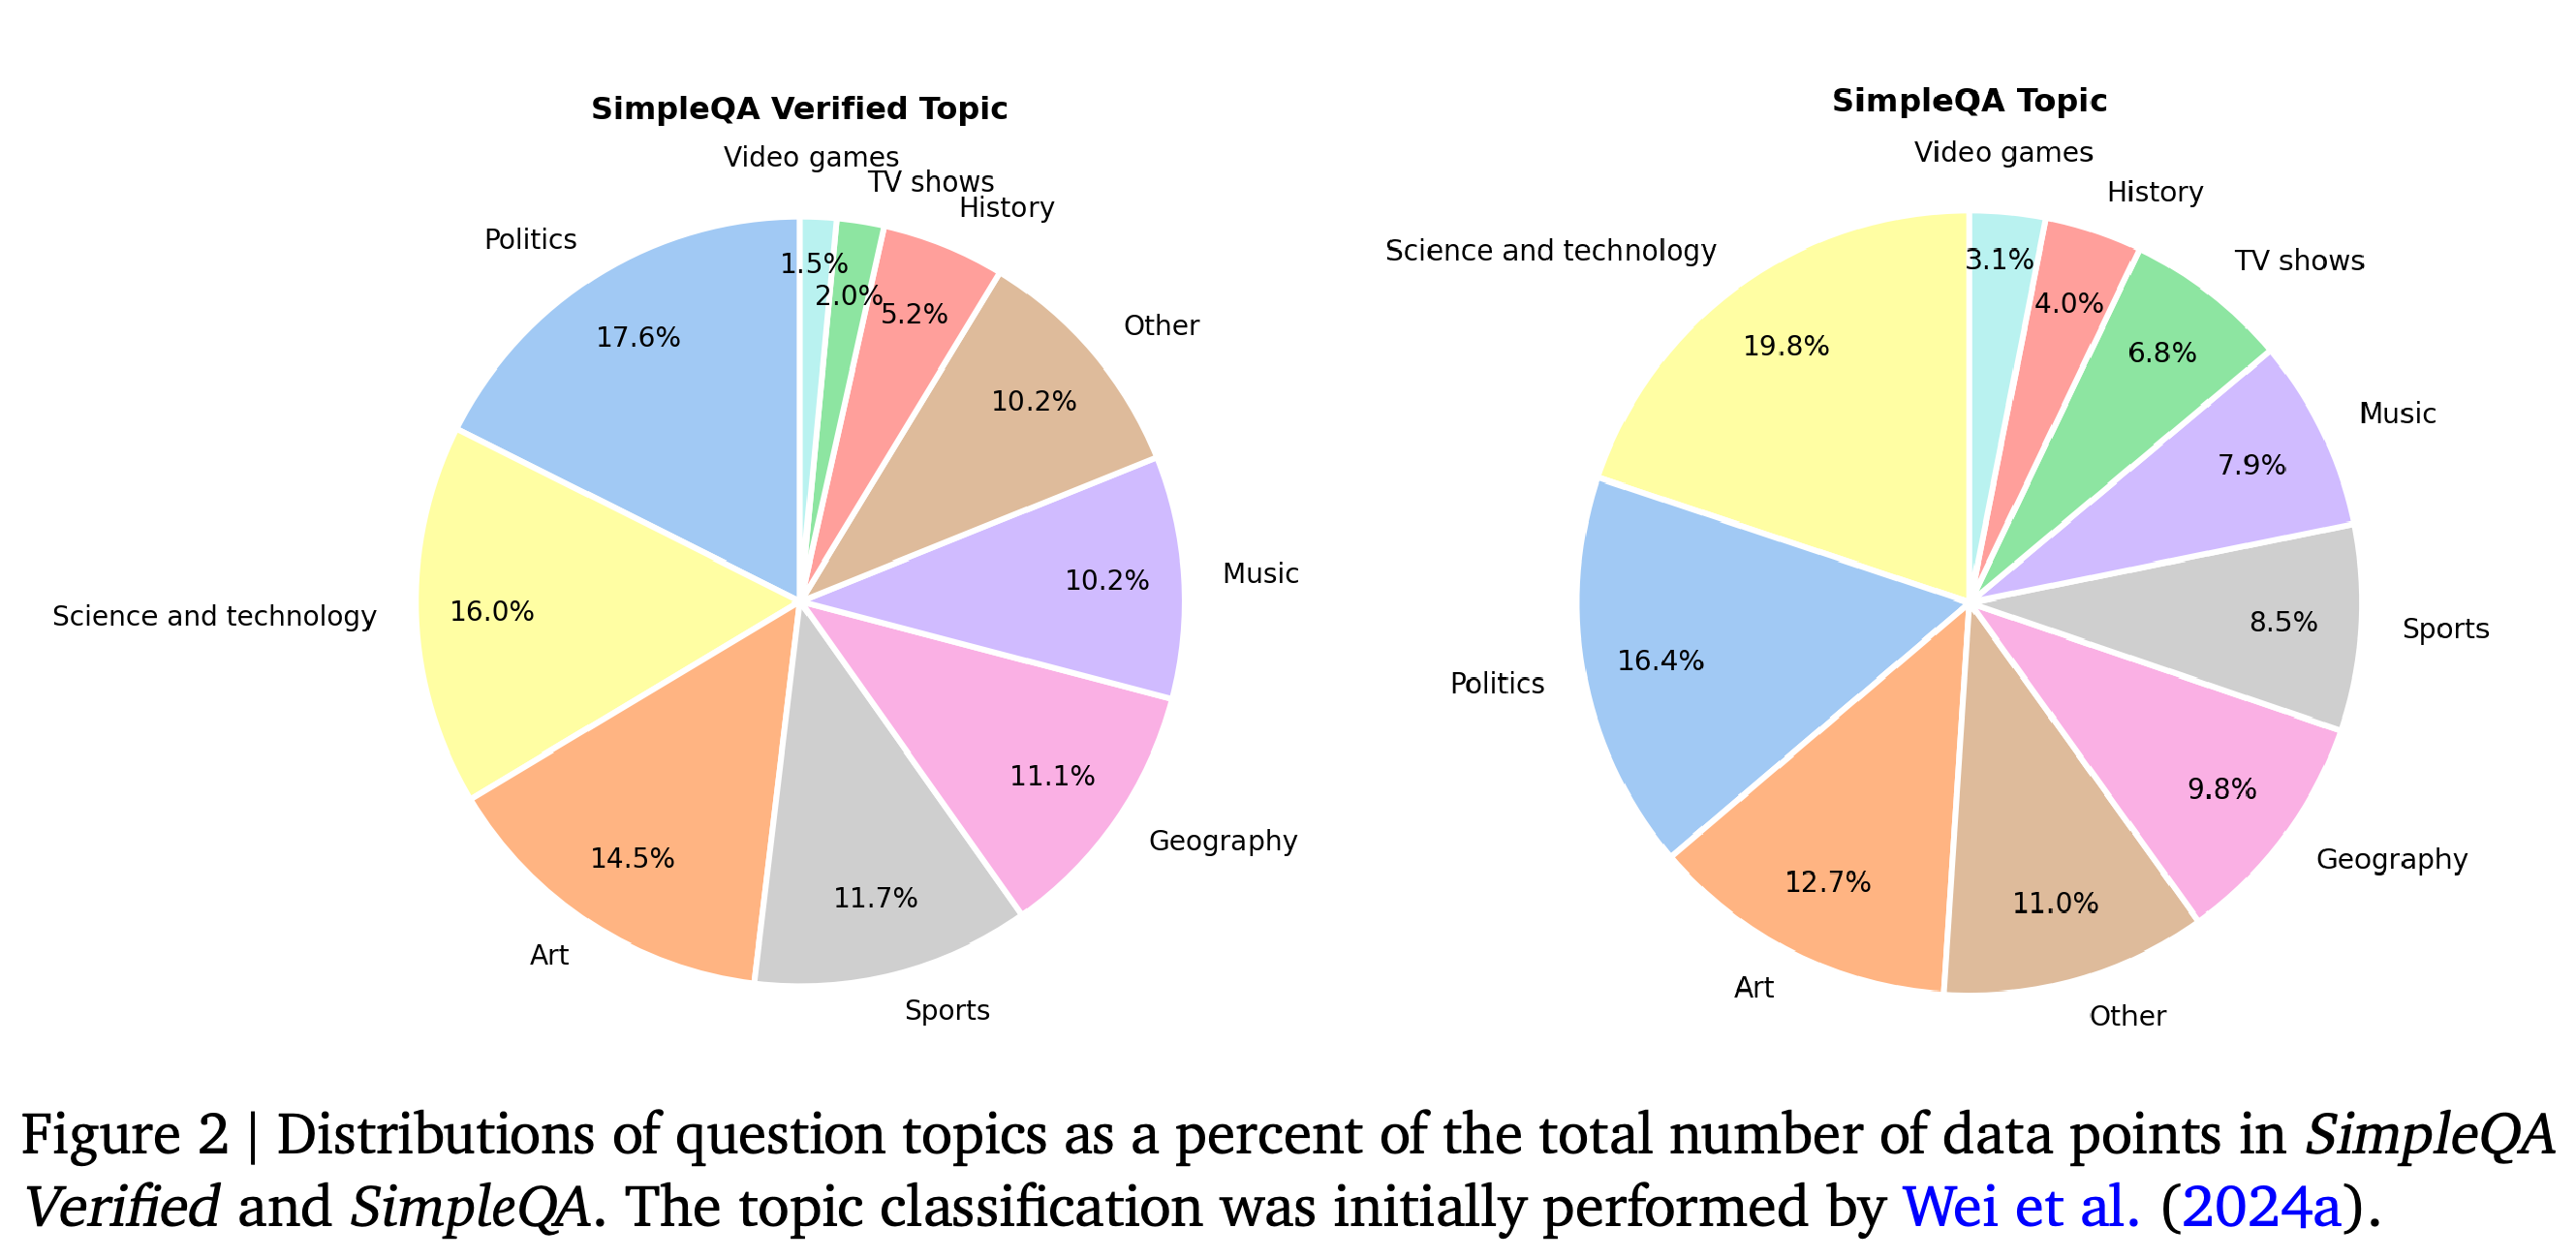
- Figure 1 shows that Date answers decrease from 32.8% in SimpleQA to 22.2% in SimpleQA Verified, and Person answers decrease from 24.1% to 19.8%.
- Figure 2 shows that Science and technology decreases from 19.8% to 16.0%, while Sports increases from 8.5% to 11.7%.
- The resulting distributions are more balanced, but the paper does not establish that they match the distribution of real user questions.
Date answers decline from 32.8% to 22.2%, and Person answers from 24.1% to 19.8%. Place, Number, and Other increase to 14.6%, 18.5%, and 24.9%, respectively, yielding a more even distribution across the five answer types.
Science and technology declines from 19.8% to 16.0%, while Sports rises from 8.5% to 11.7% and Music from 7.9% to 10.2%. The distribution remains uneven, with Politics at 17.6% and Video games at 1.5% in SimpleQA Verified.
2.5. Reconciliation of Conflicting Sources
The authors review potentially conflicting evidence using an ensemble, a collection of models, whose answers are augmented with search, together with the original reference URLs. For non-numeric answers, they remove ambiguous questions or cases with distinct conflicting answers and correct answers and URLs where possible, reducing the dataset from 1,218 to 1,117 questions, an 8.3% reduction.
- For answer_type=Number, an autorater with code execution checks whether source answers fall within a 5% margin relative to the original SimpleQA reference answer.
- The paper states that questions with answers outside this margin across all sources are removed, reducing the dataset from 1,117 to 1,073 questions, a 3.9% reduction. This reconciliation rule is separate from the question-specific numeric grading ranges introduced later.
2.6. Increasing Benchmark Headroom
Cleaning incorrect labels and ambiguous evidence makes the retained questions easier to answer. To preserve difficulty, the authors discard questions solved correctly by all selection models and retain 1,000 questions from the remaining 1,073, a 6.8% reduction.
- The final question distribution therefore depends partly on the capabilities of the models used for selection.
2.7. Manual Review & Metadata Enrichment
Manual review removes or corrects invalid and irrelevant URLs and adjusts date answers to the precision requested by each question. The authors also examine frequent source domains and report a prevalence of established encyclopedias.
- A prompted classifier adds reasoning metadata, such as whether answering requires calculating a difference between dates, and multi-step metadata, indicating multiple sequential information steps.
- The final dataset classifies 3.7% of questions as requiring reasoning and 7.3% as multi-step.
- The paper does not provide a quantitative domain-frequency breakdown or an independent validation of these metadata labels.
3. Metrics & Autorater Improvements
Each answer receives one of three grades: correct, incorrect, or not attempted. The final F1-Score is the harmonic mean of overall accuracy, the proportion of all questions answered correctly, and accuracy given attempted, the proportion of attempted questions answered correctly.
- These components and the attempt rate, the proportion of questions for which a model attempts an answer, distinguish factual recall from abstention behavior.
3.1. Methodology
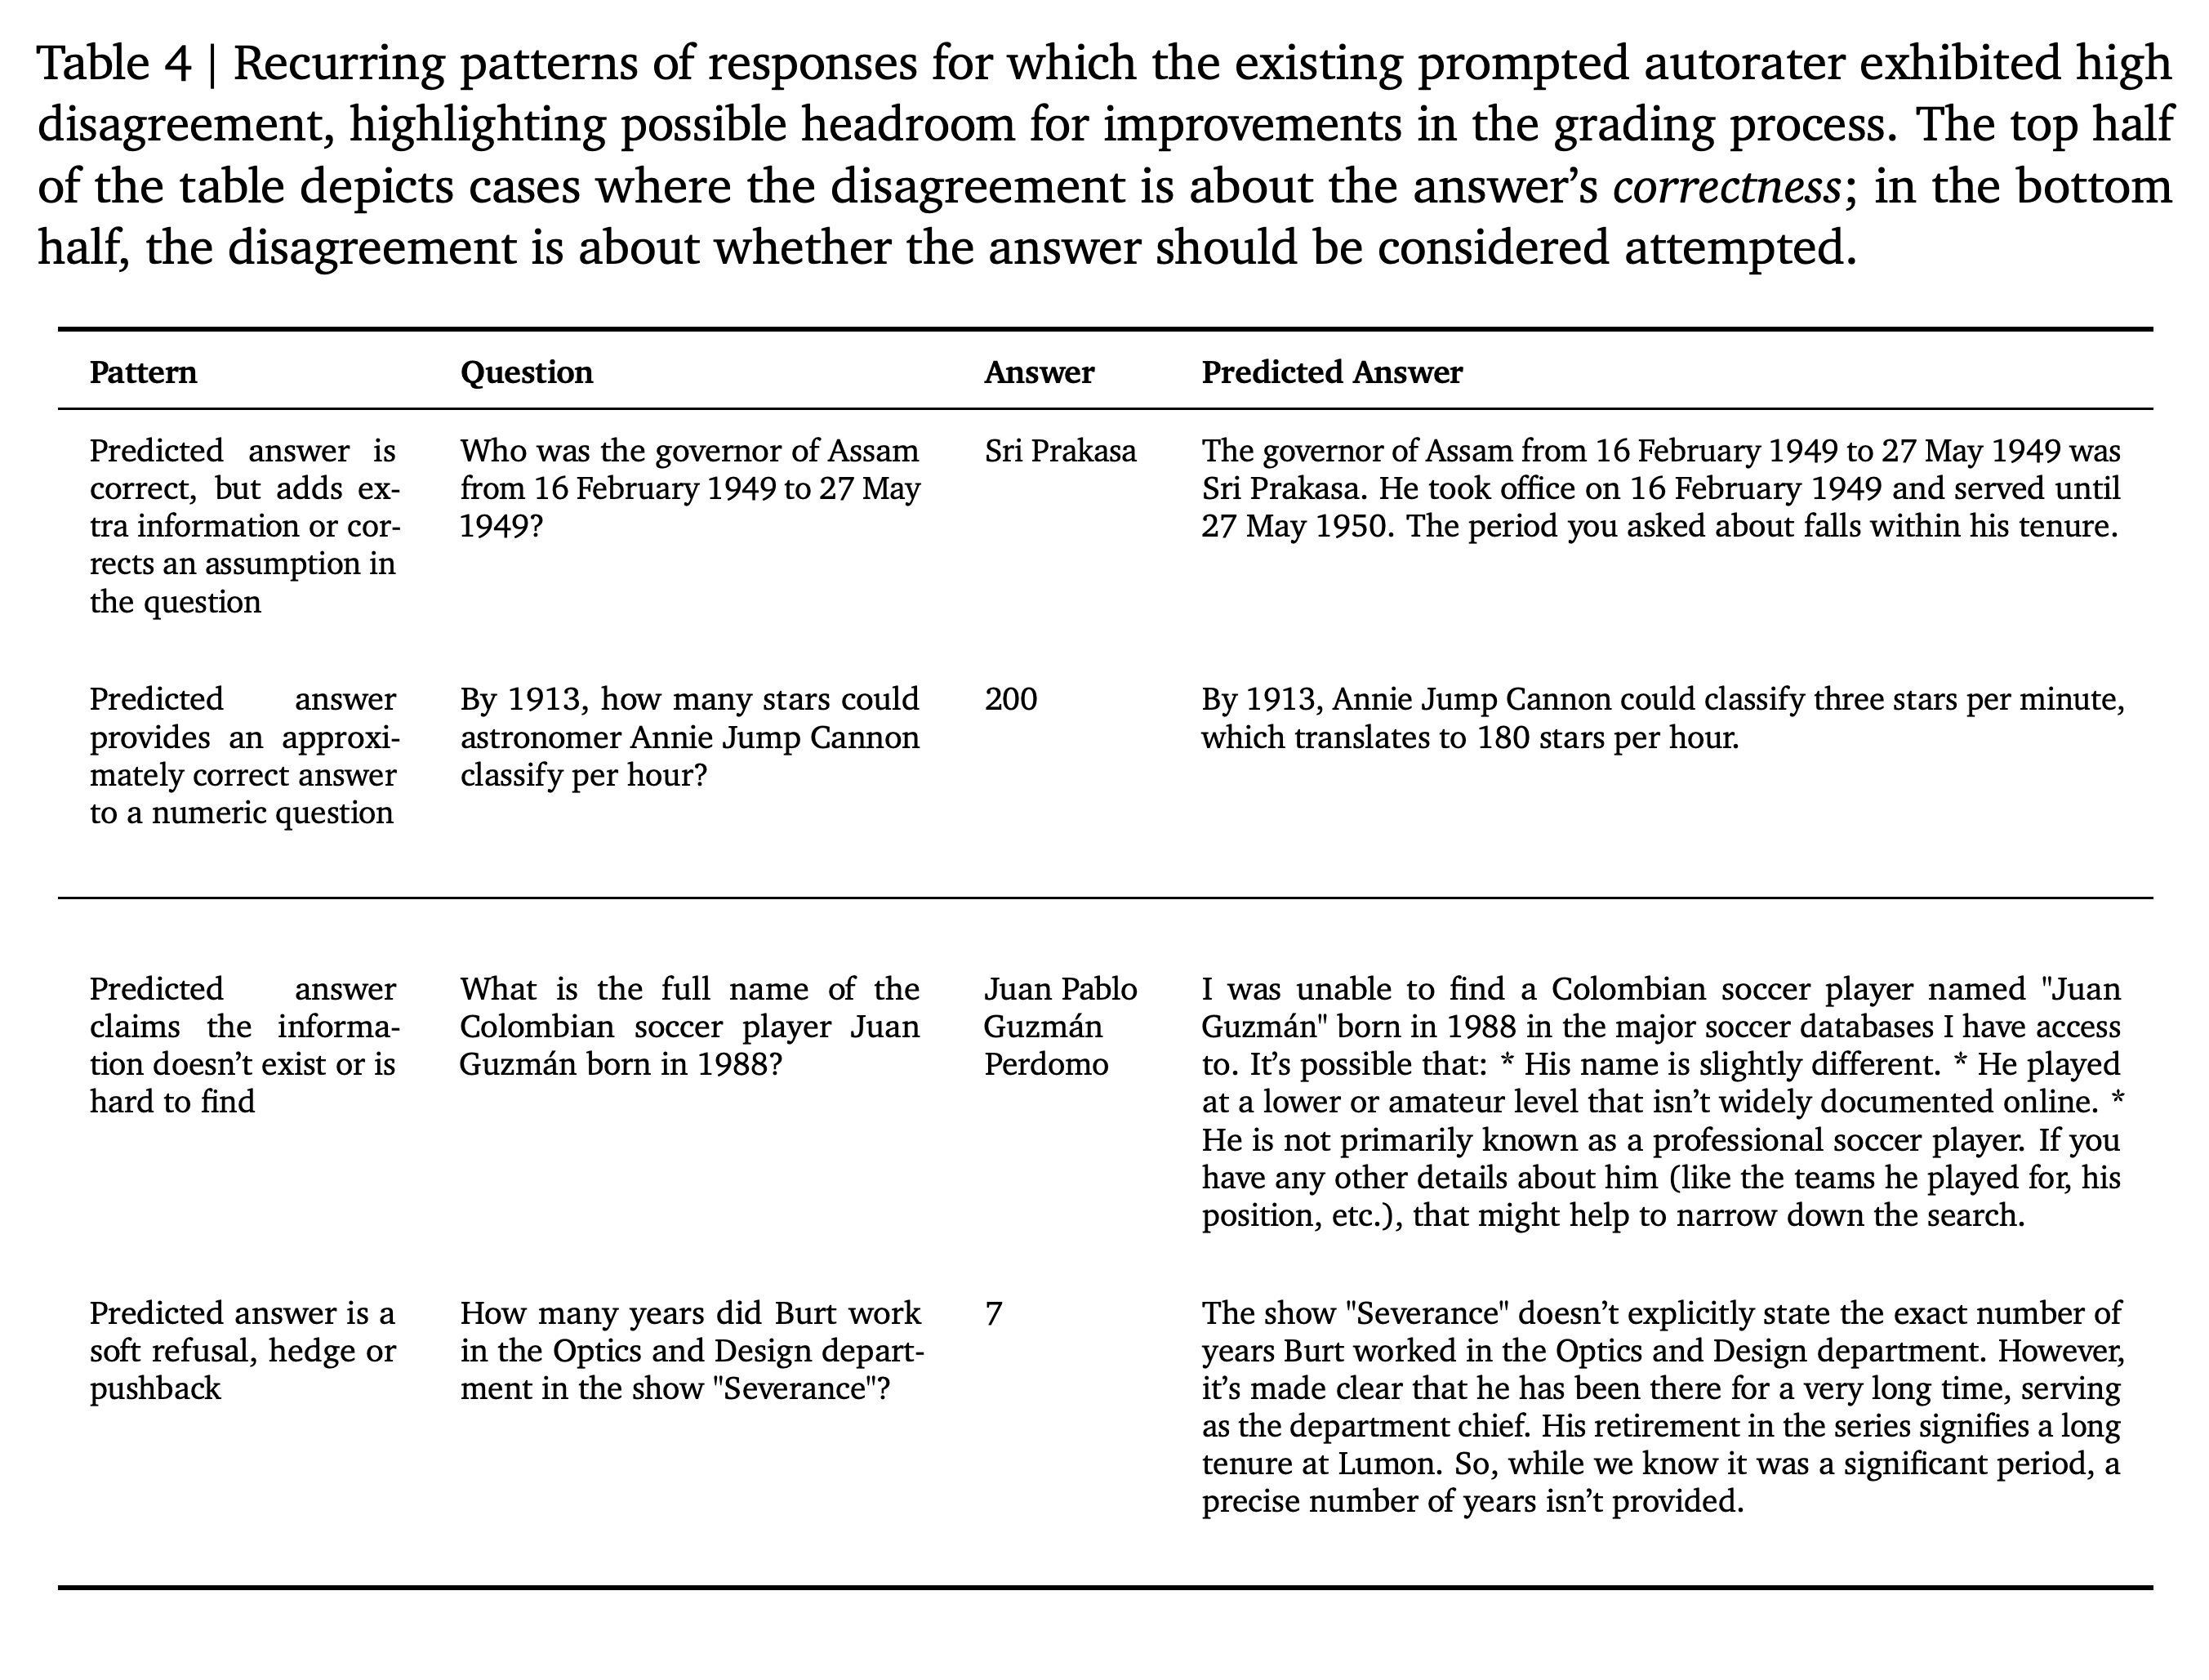
To identify unstable grading cases, the authors sample answers from an ensemble of models and grade each answer N = 10 times at temperature T = 2.0, a sampling setting used here to expose disagreement. They manually inspect answers with the highest disagreement across those grades.
- Table 4 identifies recurring uncertainty around correct answers with additional context, approximate numeric answers, claims that information cannot be found, and soft refusals or hedged responses, which express uncertainty about an answer.
- The paper does not report the size of the inspected set or an aggregate before-and-after grader agreement measure.
The examples separate uncertainty about correctness from uncertainty about whether an answer was attempted. They motivate distinct revisions for extra context, numeric approximation, claims of unavailable information, and refusal or hedging behavior.
3.2. Autorater Improvements
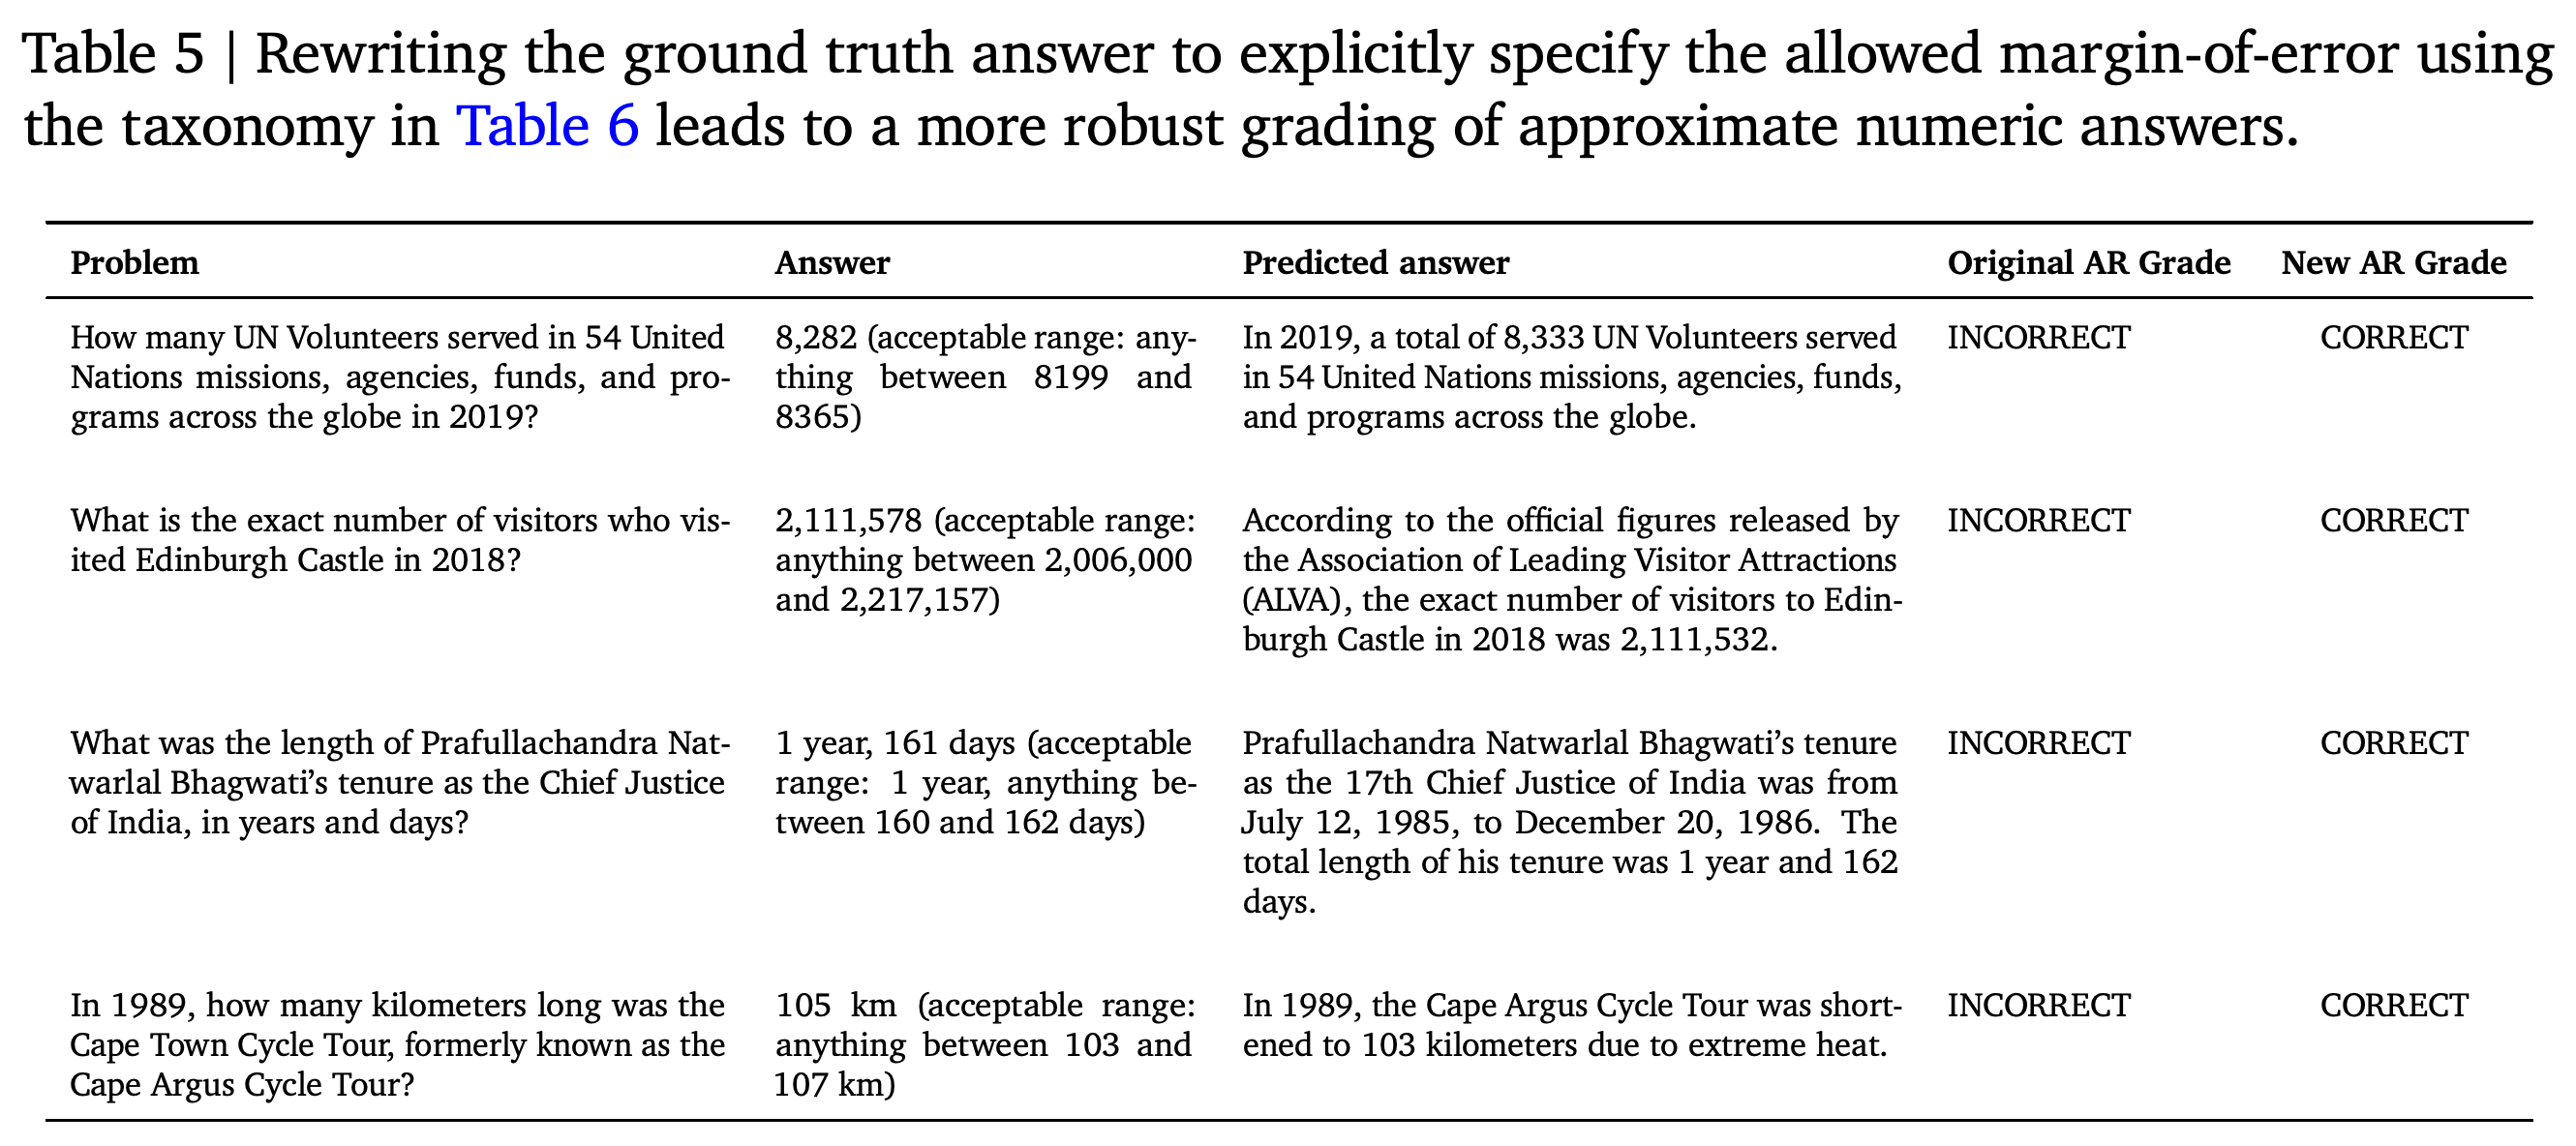
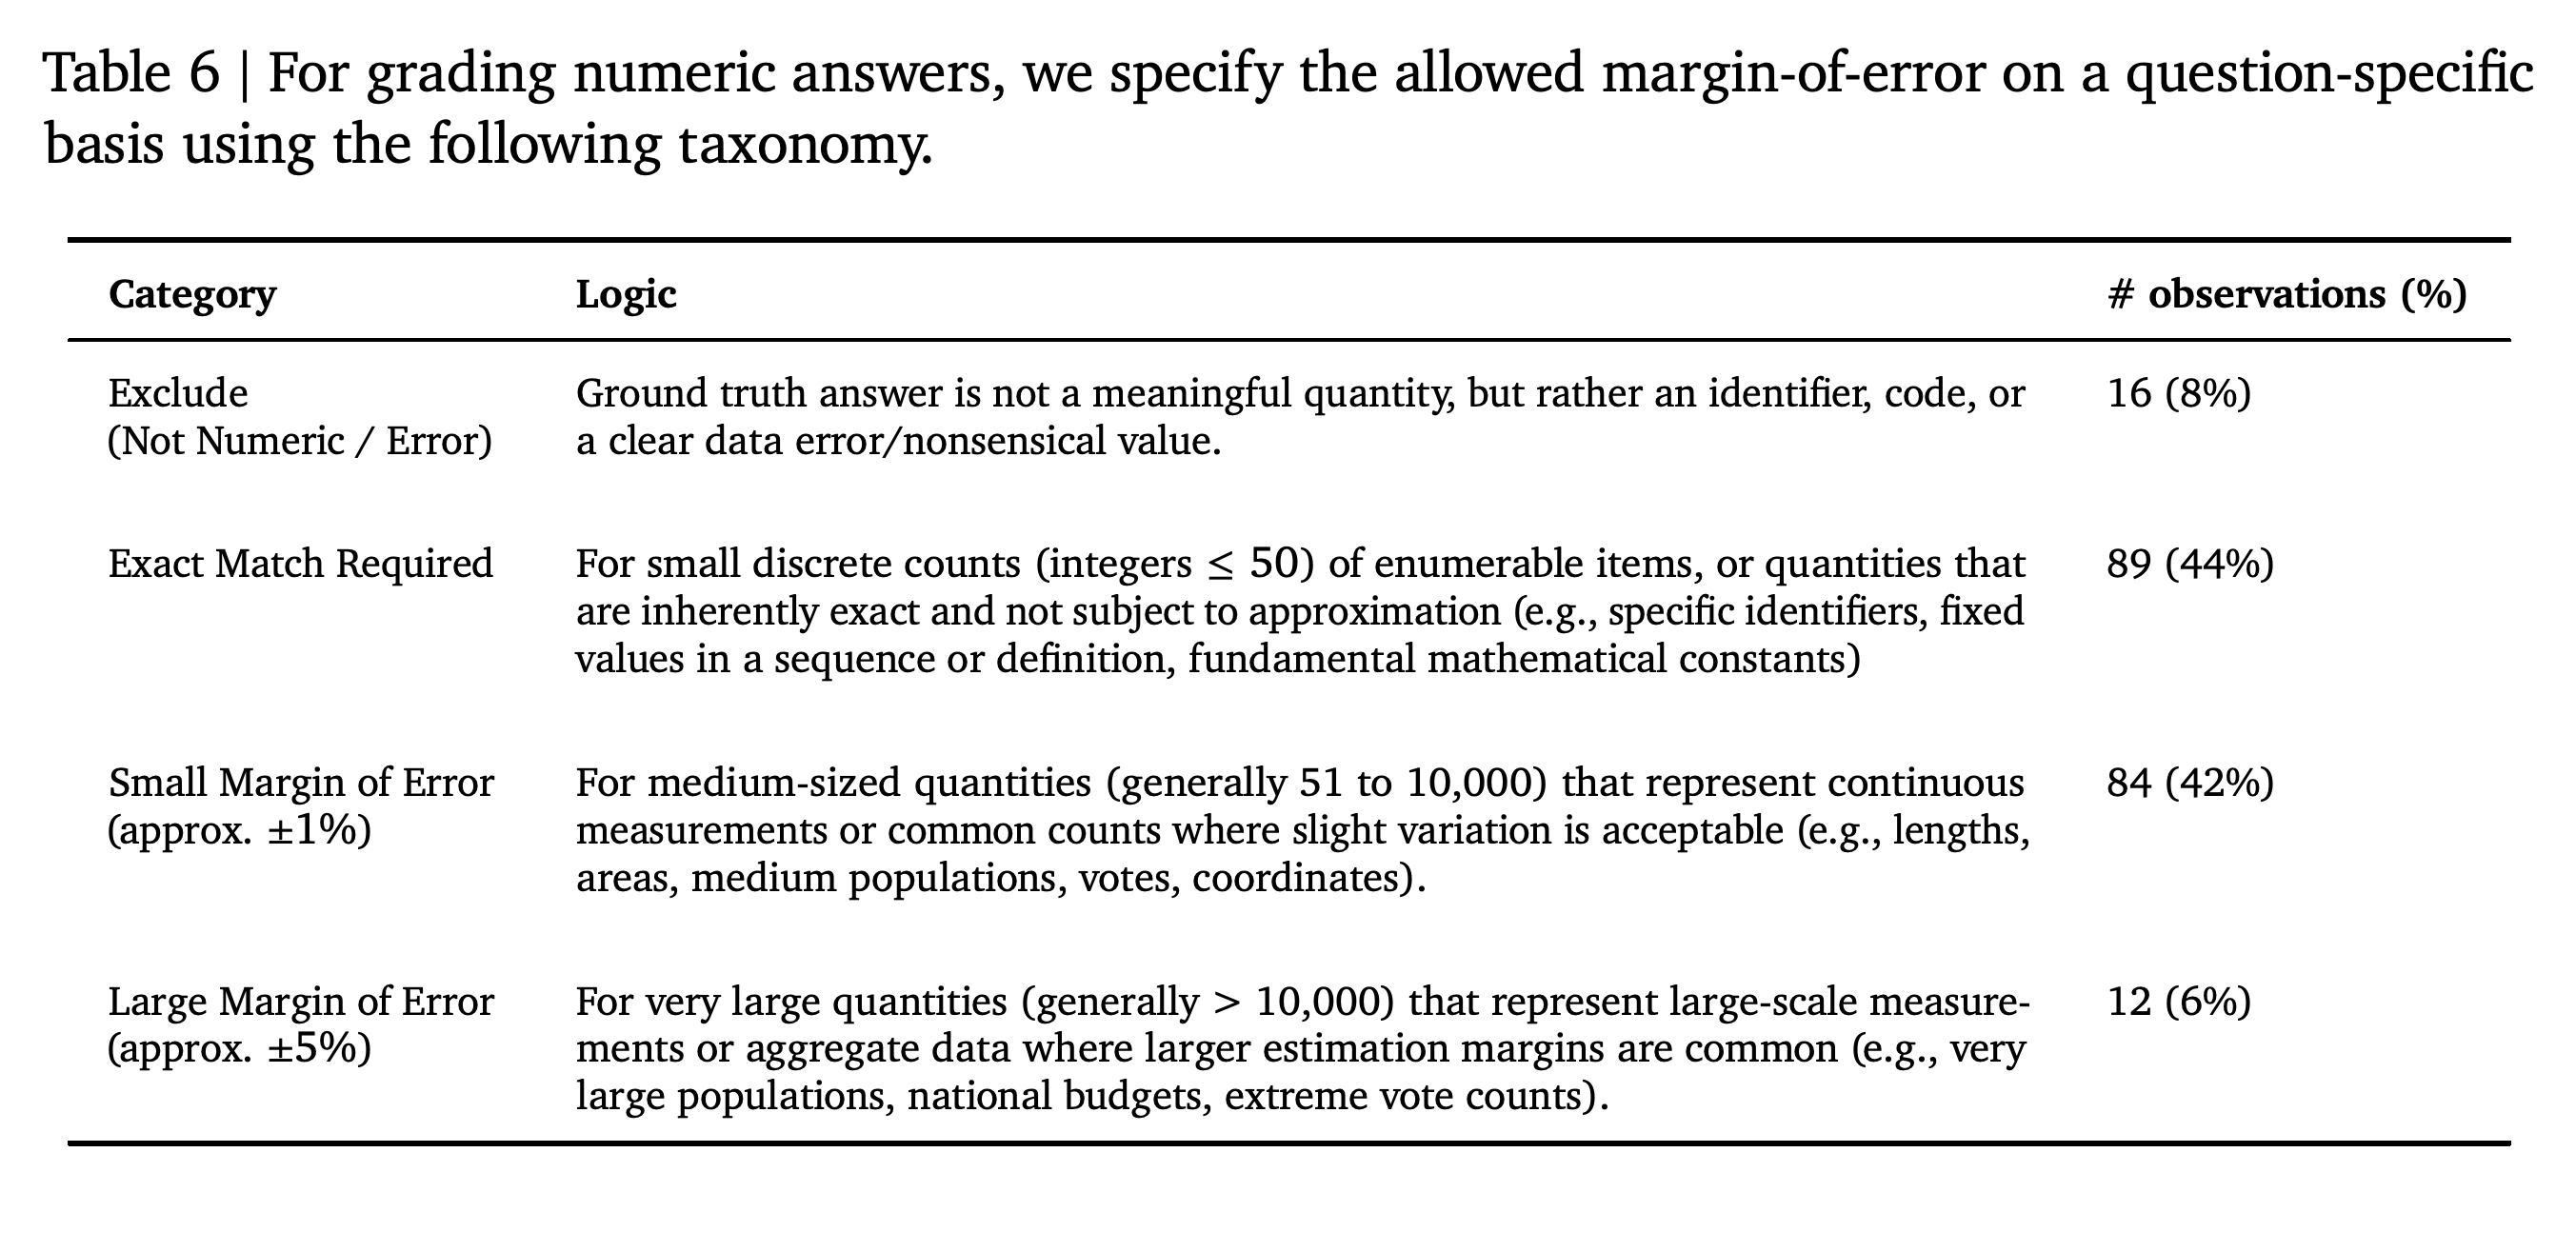
The revised grader replaces the generic requirement for numeric answers to match the last significant figure with explicit, question-specific acceptable ranges in the reference answer. Tables 5 and 6 provide examples and a taxonomy for choosing these tolerances.
- Exact matches apply to small discrete counts with integers ≤ 50 and inherently exact quantities. Approximate ±1% tolerances generally apply to quantities from 51 to 10,000 that represent continuous measurements or common counts allowing slight variation; approximate ±5% tolerances generally apply to quantities > 10,000 representing large-scale measurements or aggregate data. Final ranges remain question-specific.
- Table 6 reports 16 observations (8%) excluded as non-numeric or erroneous, 89 (44%) requiring exact matches, 84 (42%) using small margins, and 12 (6%) using large margins.
- The grader evaluates the direct answer and ignores additional information that does not contradict the gold target, the supplied reference answer. A hedged response with multiple candidates must commit to one as more likely; otherwise it is not attempted.
- Additional examples cover abstention, including claims that information cannot be found and lists of guesses without a commitment. The paper reports a 15% prompt-length increase, from 963 to 1,124 words.
All four illustrated responses change from INCORRECT to CORRECT when explicit numeric ranges are supplied. The examples demonstrate changed grading behavior but do not estimate overall grader accuracy.
The taxonomy distinguishes quantities that require exact matching from those that admit approximation. Quantity size and the nature of the measurement guide tolerance selection, while final ranges remain question-specific; 44% of the listed observations require exact matches.
4. Results
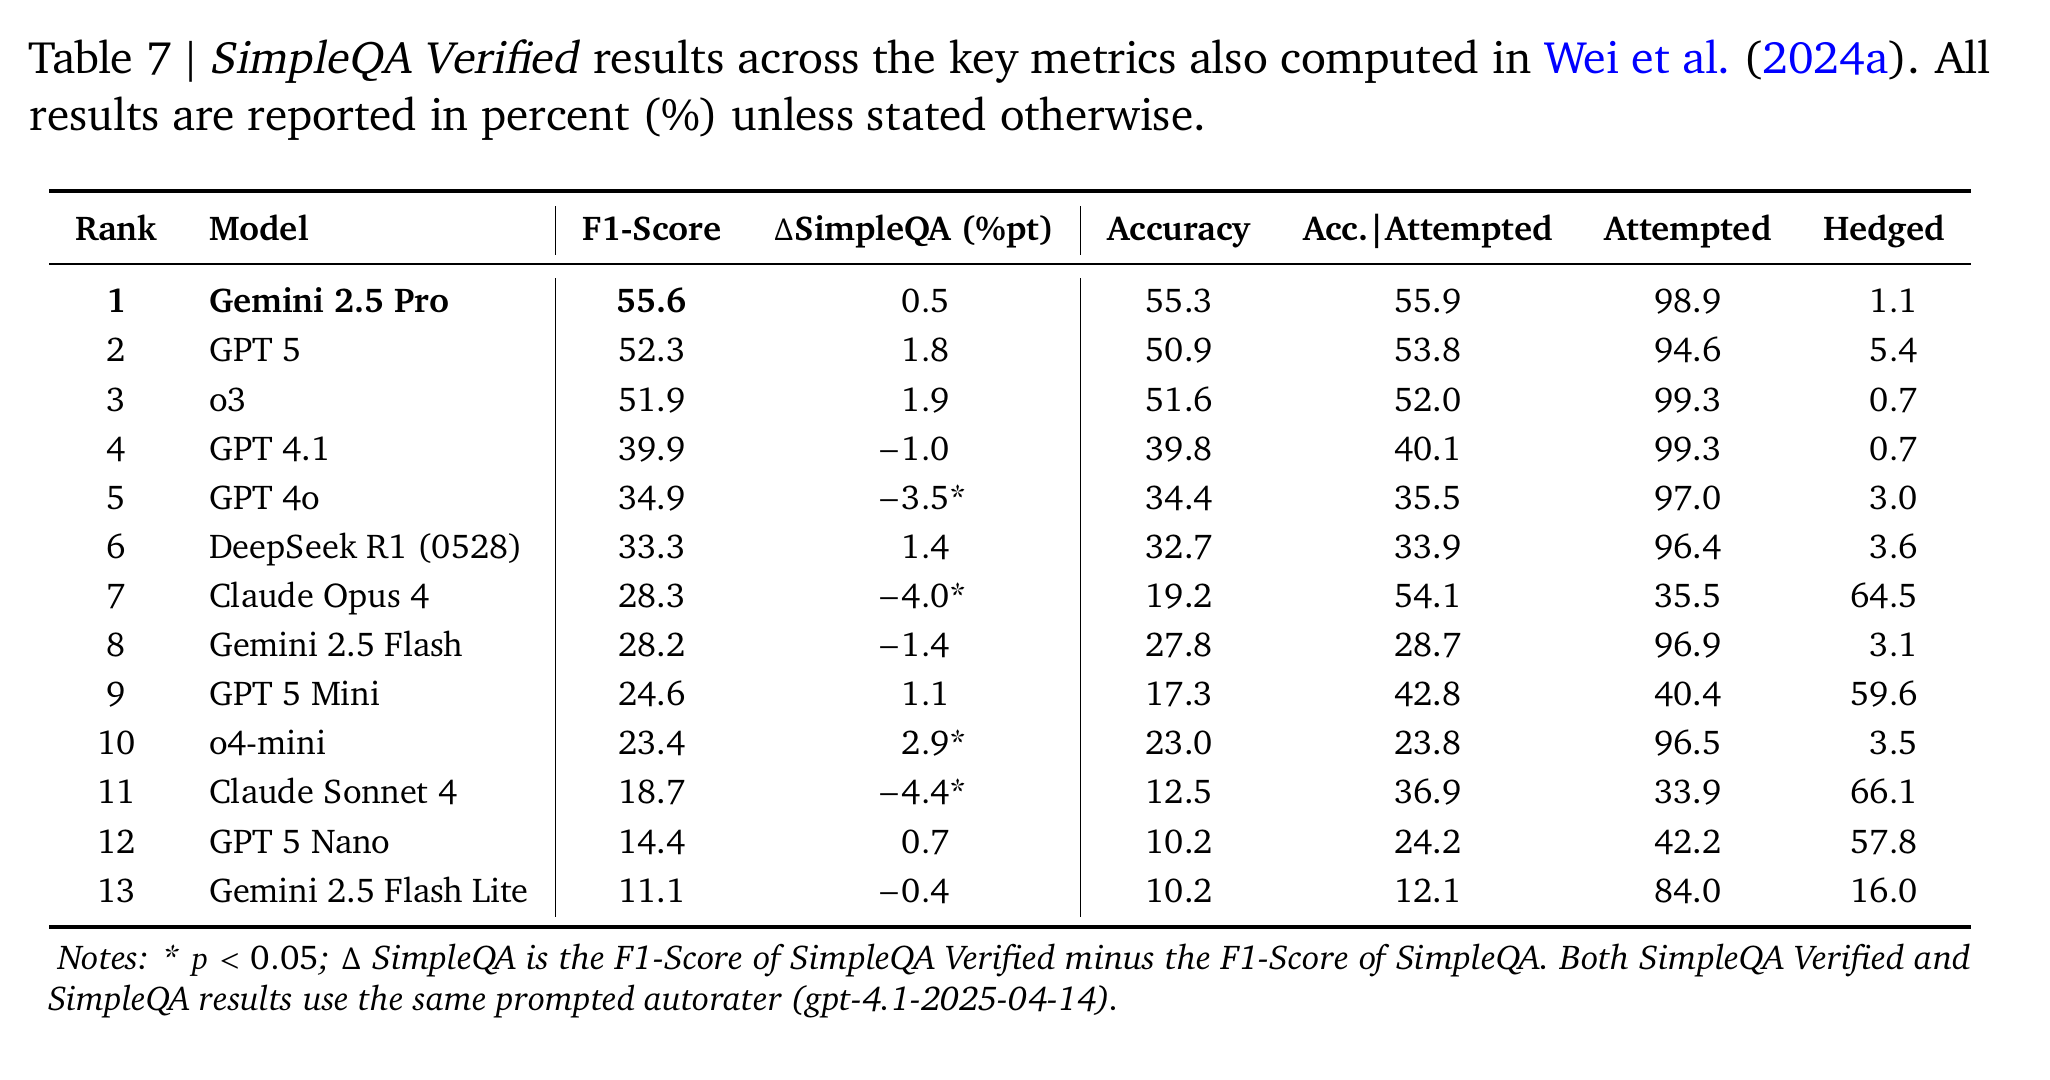
Table 7 compares 13 commercially available models using standard API parameters and no tools, with gpt-4.1-2025-04-14 as the autorater. Both SimpleQA Verified and the original SimpleQA use the same prompted grader for the reported score differences.
- Gemini 2.5 Pro leads with 55.6% F1-Score, 55.3% accuracy, and 55.9% accuracy given attempted. GPT 5 reaches 52.3%, 50.9%, and 53.8%, respectively; o3 reaches 51.9%, 51.6%, and 52.0%.
- Attempt rates differ substantially: Gemini 2.5 Pro attempts 98.9% of questions, GPT 5 attempts 94.6%, and Claude Opus 4 attempts 35.5%. Claude Opus 4 obtains 54.1% accuracy given attempted but only 19.2% overall accuracy and 28.3% F1-Score.
- Relative to original SimpleQA, GPT 4o decreases by 3.5 percentage points, Claude Opus 4 by 4.0, and Claude Sonnet 4 by 4.4; o4-mini increases by 2.9. These four differences are marked p < 0.05, the paper’s threshold for statistical significance.
- The significance markers concern changes between benchmarks, not pairwise differences among models. Tool-enabled performance is described as near perfect without a quantitative results table.
Gemini 2.5 Pro ranks first at 55.6% F1-Score, followed by GPT 5 at 52.3% and o3 at 51.9%. The accuracy and attempt columns reveal substantially different response policies, while significance markers apply to score changes from original SimpleQA.
5. Conclusion
The paper releases a revised dataset and grading protocol for evaluating short-answer factual recall, with documented filtering stages and comparisons across frontier models, the leading commercially available systems evaluated in the study. The dataset, evaluation code, and public leaderboard are available at https://www.kaggle.com/benchmarks/deepmind/simpleqa-verified.
- Gemini 2.5 Pro is the highest-scoring evaluated model under the reported conditions. The experiments do not directly measure reduced hallucination, meaning factually inaccurate generated content, in deployed applications.
Appendix
- A. SimpleQA Verified Evaluation Prompt provides the complete revised grader prompt, with changes highlighted in red. It includes examples of CORRECT, INCORRECT, and NOT_ATTEMPTED responses, explicit numeric acceptance ranges, and rules for uncertain answers, omitted information implied by the question, and recognizable name misspellings. The template uses {question}, {target}, and {predicted_answer}, with output mappings A: CORRECT, B: INCORRECT, and C: NOT_ATTEMPTED.
Brief Thoughts
Table 2 makes the effects of cumulative curation visible, and Table 7 shows why factuality scores need to be read alongside attempt rates. Claude Opus 4, for example, answers attempted questions correctly at a rate of 54.1% but attempts only 35.5% of the dataset, producing an F1-Score of 28.3%. Difficulty selection and publisher filtering shape the tested knowledge distribution; publisher filtering removes 30.4% of the questions remaining at that stage. Independent human labels and measured agreement before and after revision would make the grader’s reliability easier to assess. Because grading focuses on the direct answer and disregards extra information that does not contradict the gold target, the score measures targeted factual recall rather than the factual accuracy of every statement in a long response.