


Diffusion Language Models are Super Data Learners | Summary
05 Nov 2025 | Paper Review Diffusion Language Models LLM Pretraining Scaling LawsContents
This article explains the key points of Diffusion Language Models are Super Data Learners.
- 2025-11-05 (arXiv)
- Ni, Jinjie, Liu, Qian, Dou, Longxu, Du, Chao, Wang, Zili, Yan, Hang, Pang, Tianyu, Shieh, Michael Qizhe.
- National University of Singapore, Sea AI Lab, StepFun, Shanghai Qiji Zhifeng Co., Ltd.
- Paper
- Github
- Project Page
Summary
- When unique training data is limited, language models must learn from repeated exposure to the same tokens. Under matched model sizes, training settings, and total training-token budgets, masked diffusion language models (DLMs), which reconstruct randomly masked tokens, eventually outperform autoregressive (AR) models, which predict tokens from preceding context, in the tested data-constrained regimes.
- The crossover occurs later with more unique data or higher data quality, earlier with larger models, and across dense models and mixture-of-experts models, which activate only part of their parameters for each token. A 1B-parameter DLM trained on 1B unique tokens for 480 epochs, meaning 480 passes over the dataset, reaches the main text’s reported 56% HellaSwag and 33% MMLU accuracy on these multiple-choice benchmarks, compared with reported AR results of 41% and 29%. Paired 1.7B-parameter code models trained for approximately 1.5T total tokens also show diffusion overtaking AR on the code-generation benchmarks MBPP and MBPP+, while HumanEval and HumanEval+, additional code-generation benchmarks, approach parity much later.
- The authors attribute the gains to any-order modeling, which predicts tokens from arbitrary visible context; super-density, their term for spending more computation per task; and Monte Carlo augmentation, which samples different masking patterns on repeated presentations of a sequence. Input masking and dropout, which randomly zero neuron outputs, improve AR performance but do not eliminate the observed gap. The experiments demonstrate greater performance per unique token in the tested regimes, with substantial computation costs, eventual diffusion overfitting, and incomplete separation of the proposed mechanisms.
1. Introduction
The introduction asks which modeling paradigm extracts more signal from limited high-quality data when repeated pretraining, the initial training of a language model on a corpus, is allowed. AR learns faster initially, but DLMs continue improving after AR performance saturates in the data-constrained experiments. AR remains stronger within the observed budget when abundant unique data makes computation the binding constraint.
Key takeaways.
The key takeaways distinguish data potential, the performance attainable from a fixed unique dataset, from computational efficiency. The authors report roughly >3× data potential, systematic crossover shifts with data quantity, quality, model size, and sparsity, and improvements from AR noise injection that remain below diffusion. They also caution that increasing validation loss can coexist with improving downstream accuracy and that realizing diffusion’s potential requires more training and inference floating-point operations (FLOPs), a measure of computational work.
2. Preliminaries
The preliminaries contrast normalized left-to-right prediction with reconstruction of randomly masked tokens using context from both directions. The models learn different conditional distributions, and their reported losses do not represent identical likelihood quantities.
2.1. Autoregressive Language Models
AR modeling factorizes a sequence probability as pθ(x1:T) = ∏i=1…T pθ(xi | x<i). Causal attention restricts each prediction to preceding tokens, while teacher forcing, which supplies the true preceding tokens during training, lets all next-token predictions be learned in one forward pass. Inference generates tokens sequentially and uses a key-value (KV) cache, which stores previous attention computations, to avoid repeatedly processing the entire context.
- Equation (2) minimizes the expected sum of negative log probabilities of the correct next tokens. The formulation gives exact normalized likelihoods and efficient training, although the paper notes its one-directional context and exposure bias, the difference between training on true prefixes and generating from model-produced prefixes.
2.2. Masked Diffusion Language Models
Masked diffusion independently replaces clean tokens with a mask token according to a decreasing clean-token probability αt, with α0 = 1 and α1 = 0. Generation starts from a fully masked sequence and progressively reveals tokens; already revealed tokens remain fixed in the presented reverse process. Bidirectional attention lets each prediction use visible tokens on either side, and the clean-token conditional depends on visible context rather than requiring an explicit time embedding, a representation of the noise level.
- Equation (3) averages reconstruction loss over noise levels and masking configurations, summing loss only at masked positions. Its schedule weight is \(w(t;\alpha)=\frac{\alpha’_t}{\alpha_t-1}\); for \(\alpha_t=1-t\), this becomes \(w(t)=1/t\).
- The objective maximizes a variational bound on sequence log probability, rather than the exact normalized left-to-right likelihood used by AR. Repeated training samples additional corrupted versions of the same sequence.
3. The Intelligence Crossover
The Intelligence Crossover experiments compare masked diffusion and AR models trained on standard web tokens while varying unique data budgets, quality, parameter counts, sparsity, and noise injection. The outcome of interest is downstream benchmark performance over training, alongside validation loss. The curves show that diffusion’s initial disadvantage can reverse after sufficient repeated training.
3.1. Experimental Settings
Most crossover runs use randomly sampled Nemotron-CC web data and a modified Megatron-LM training codebase; the extended small-model overfitting study uses the English web corpus c4-en, and the code experiments use the corpus identified as RefinedCode in this section. The standard configuration uses batch size 256, sequence length 2048, and a warmup-stable-decay (WSD) learning-rate schedule, which raises, holds, and then lowers the learning rate, with 1000 warmup steps, peak 2e-4, and a final 10% exponential decay to 2e-5. Parameters are initialized from a normal distribution with standard deviation 0.02.
- The architecture uses the GPT-2 tokenizer to divide text into tokens, rotary position embeddings (RoPE) to represent position, SwiGLU activations, pre-layer RMSNorm normalization, bias-free layers, and query-key normalization in attention. These architectural choices are shared by the compared models.
- Token-choice routing selects experts for each token and uses auxiliary-loss coefficient 1e-2 and z-loss coefficient 1e-3 as routing-related training terms. Validation uses distinct 100M-token subsets of the c4-en validation set at each evaluation.
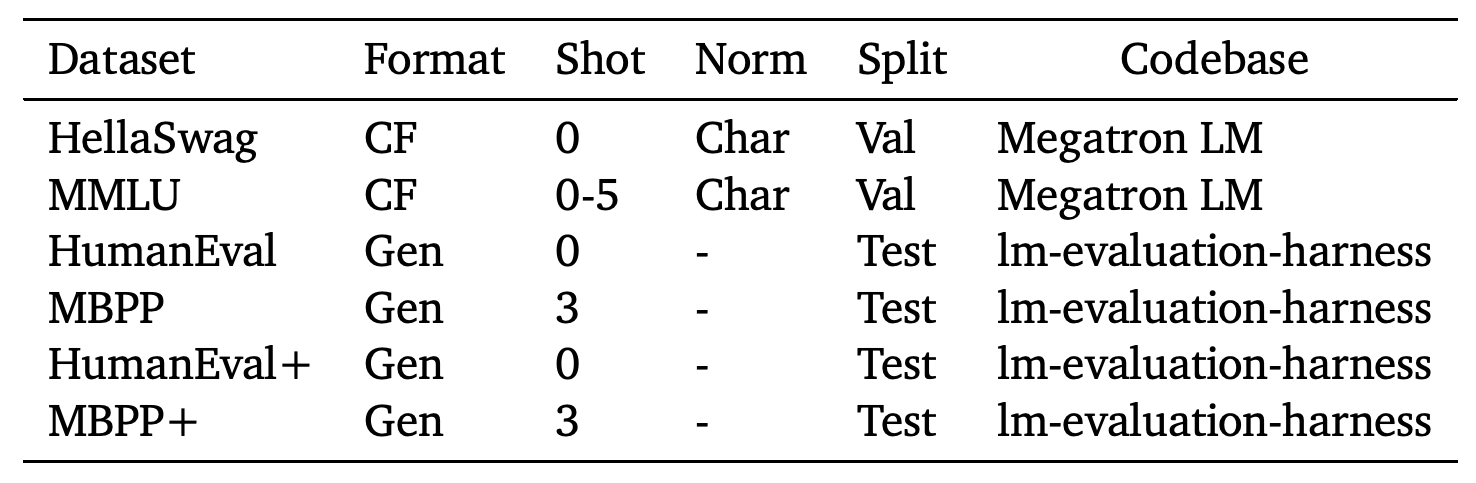
- Table 1 specifies character-normalized completion scoring, which divides answer scores by character count, for HellaSwag and MMLU, and generated-code evaluation for HumanEval, MBPP, and their extended-test variants. The authors note that shared hyperparameters primarily reflect prior AR tuning; their suggestion that this understates diffusion performance is not separately tested.
The protocols distinguish character-normalized completion scoring from generated-code evaluation. HumanEval variants use zero-shot prompts while MBPP variants use three-shot prompts, a methodological difference relevant to their distinct crossover timing, though the table does not establish it as the cause.
3.2. Data Budget Decides the Crossover Timing
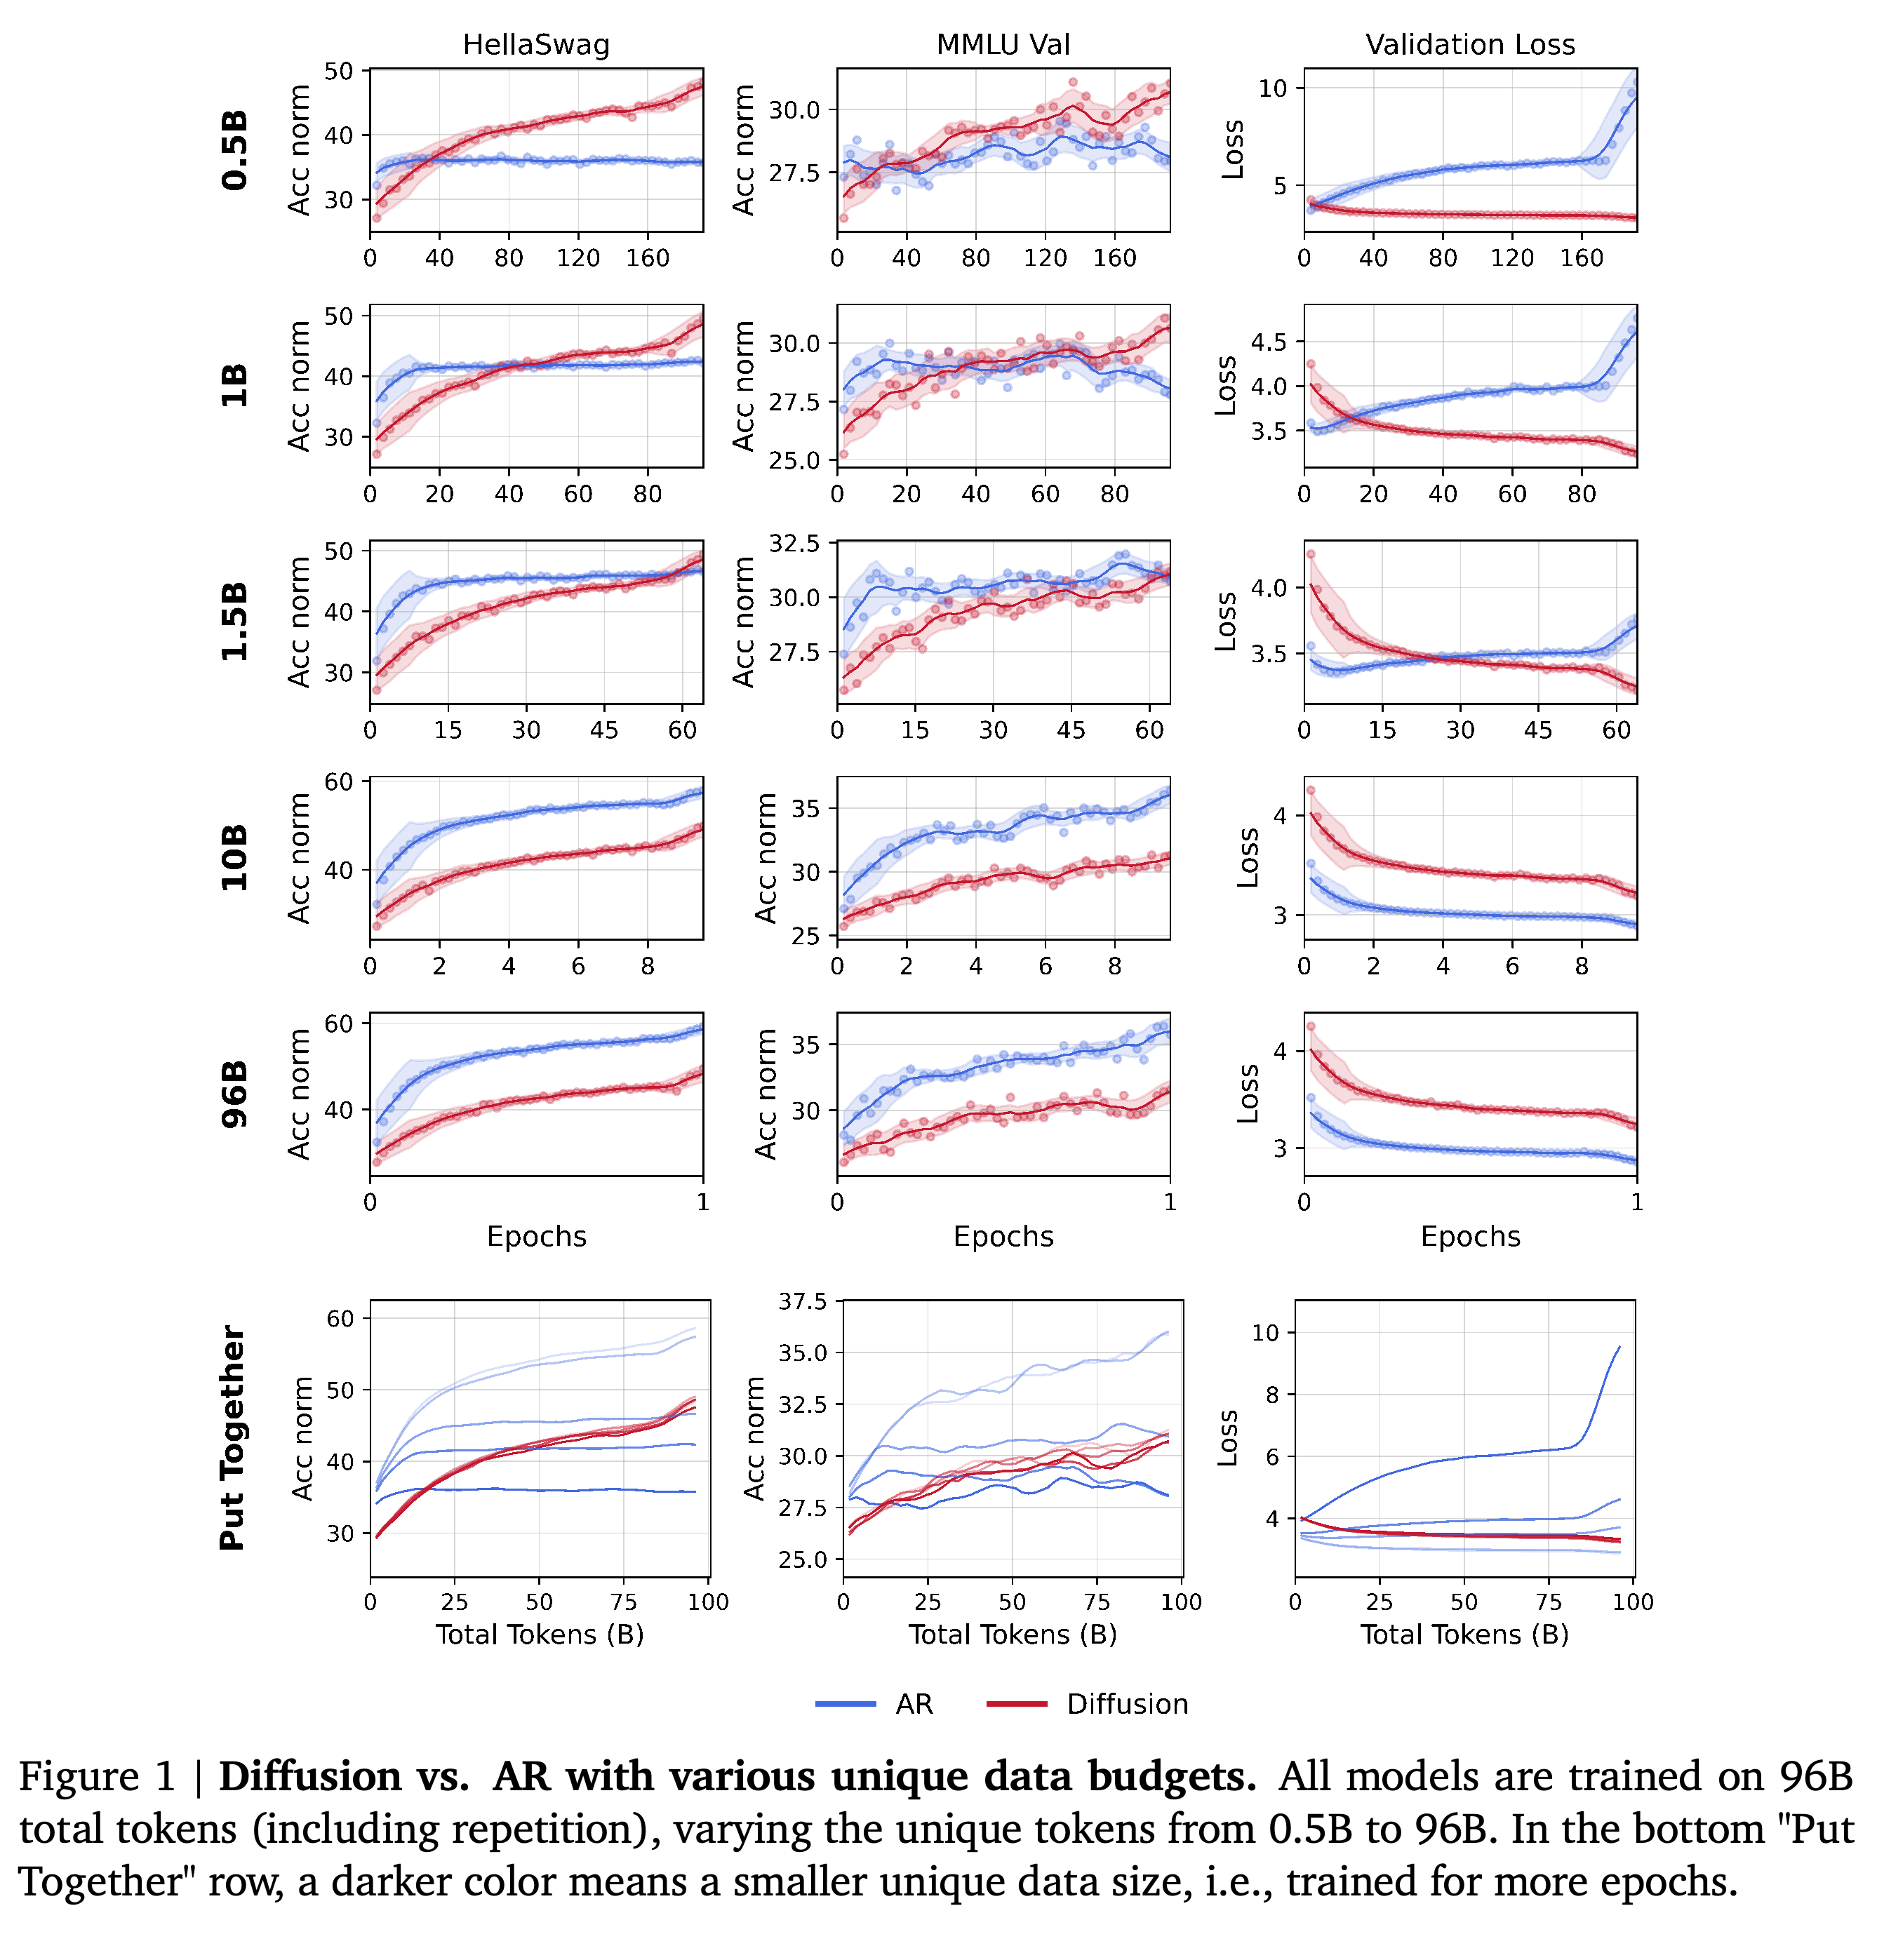
With model size fixed at 1B parameters and total training fixed at 96B tokens, the authors vary unique data from 0.5B to 96B tokens. Figure 1 shows diffusion overtaking AR at low unique-data budgets, while AR remains stronger within the training window at 10B and 96B unique tokens. A not-fully-converged DLM trained on 0.5B unique tokens reaches performance comparable to a converged AR model trained on 1.5B unique tokens, supporting approximately threefold effective data efficiency for this comparison.
- Increasing unique data delays the crossover or moves it beyond the observed training window. The combined plots also show a narrower spread of diffusion results across unique-data budgets than of AR results.
- The authors observe only mild short-term degradation when AR repeats approximately 10B tokens for about 10 epochs. This observation qualifies the four-epoch repetition result discussed from prior work; it does not establish a universal repetition limit.
At 0.5B and 1B unique tokens, diffusion continues improving after AR accuracy flattens, eventually reversing the initial ranking. At 10B and 96B unique tokens, AR stays ahead within the 96B-total-token window, demonstrating the dependence of crossover on repeated use of limited data.
3.3. Varying Data Quality
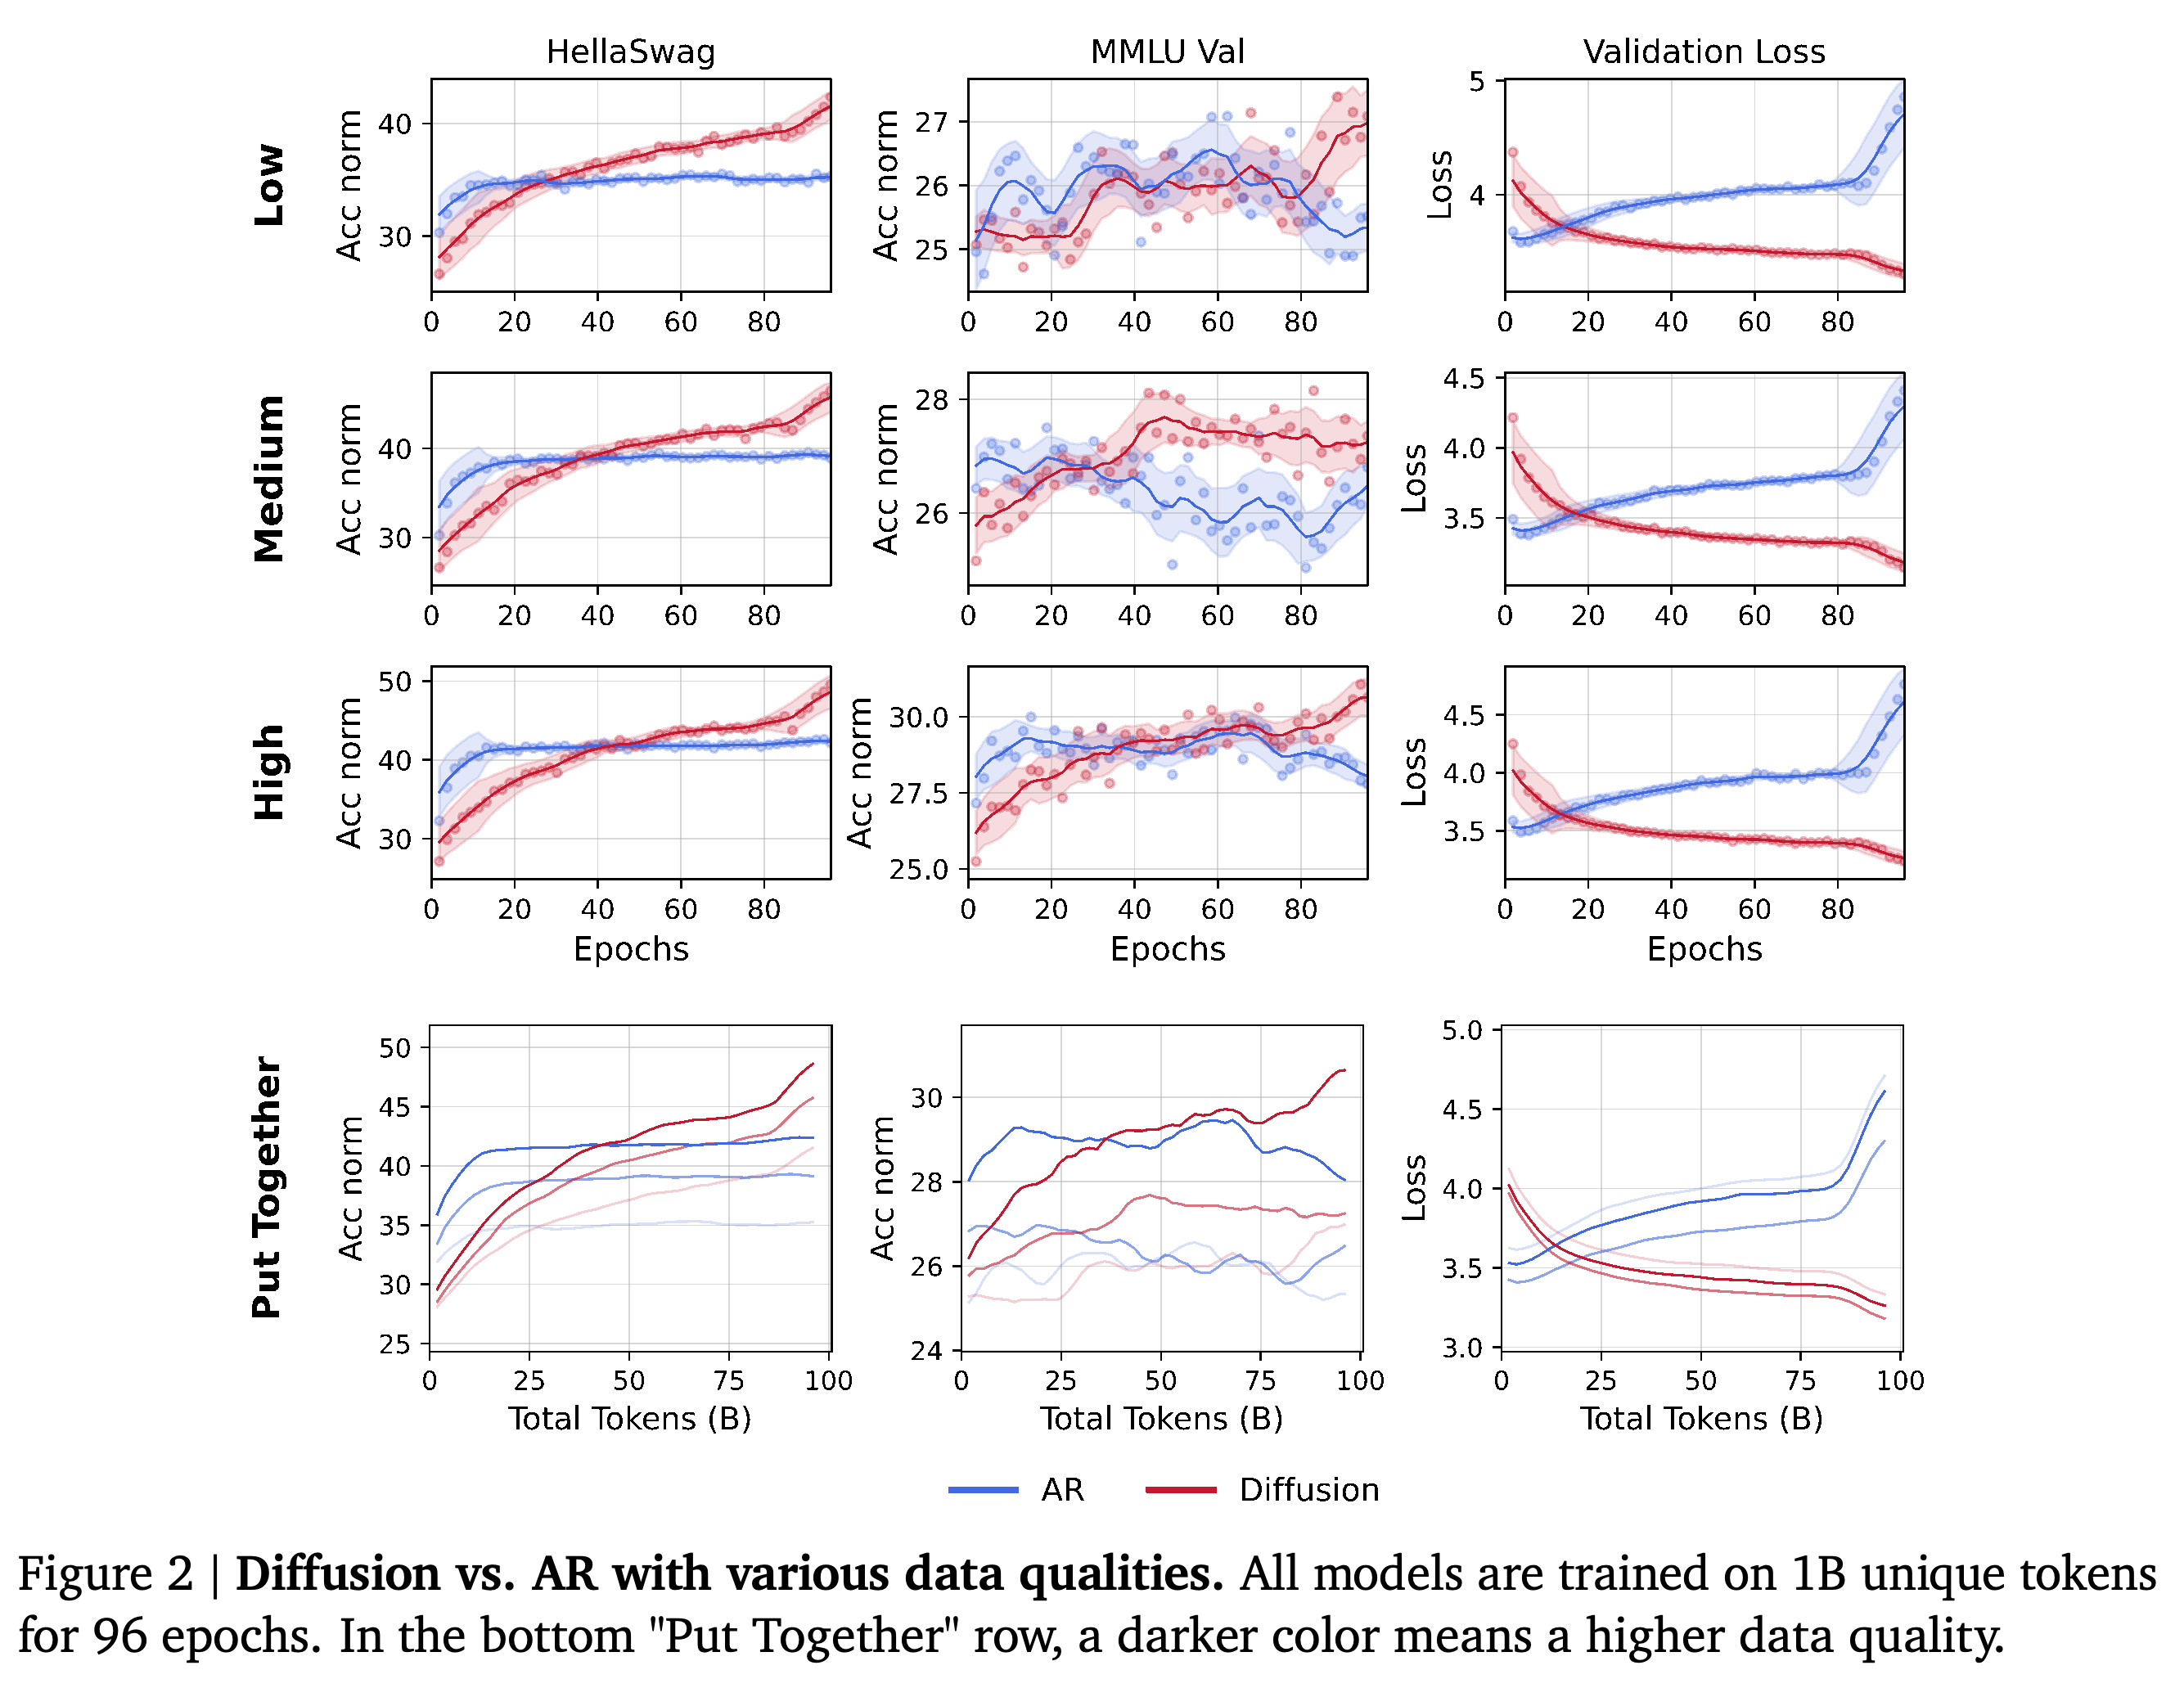
The quality ablation trains 1B-parameter models on 1B unique tokens for 96 epochs using low-, medium-, and high-quality subsets from the same source distribution. Both model families benefit from higher quality, but Figure 2 shows the crossover shifting slightly later as quality increases. The medium-quality diffusion run has the lowest validation loss despite stronger downstream results from higher-quality data, illustrating that loss and benchmark rankings can diverge.
Higher-quality data improves final benchmark accuracy for both families and slightly delays diffusion’s crossover. The medium-quality diffusion run has lower validation loss than the high-quality run despite weaker benchmark results, so validation-loss ranking does not match task-performance ranking.
3.4. How Much Does Model Size Impact the Data-Constrained Training?
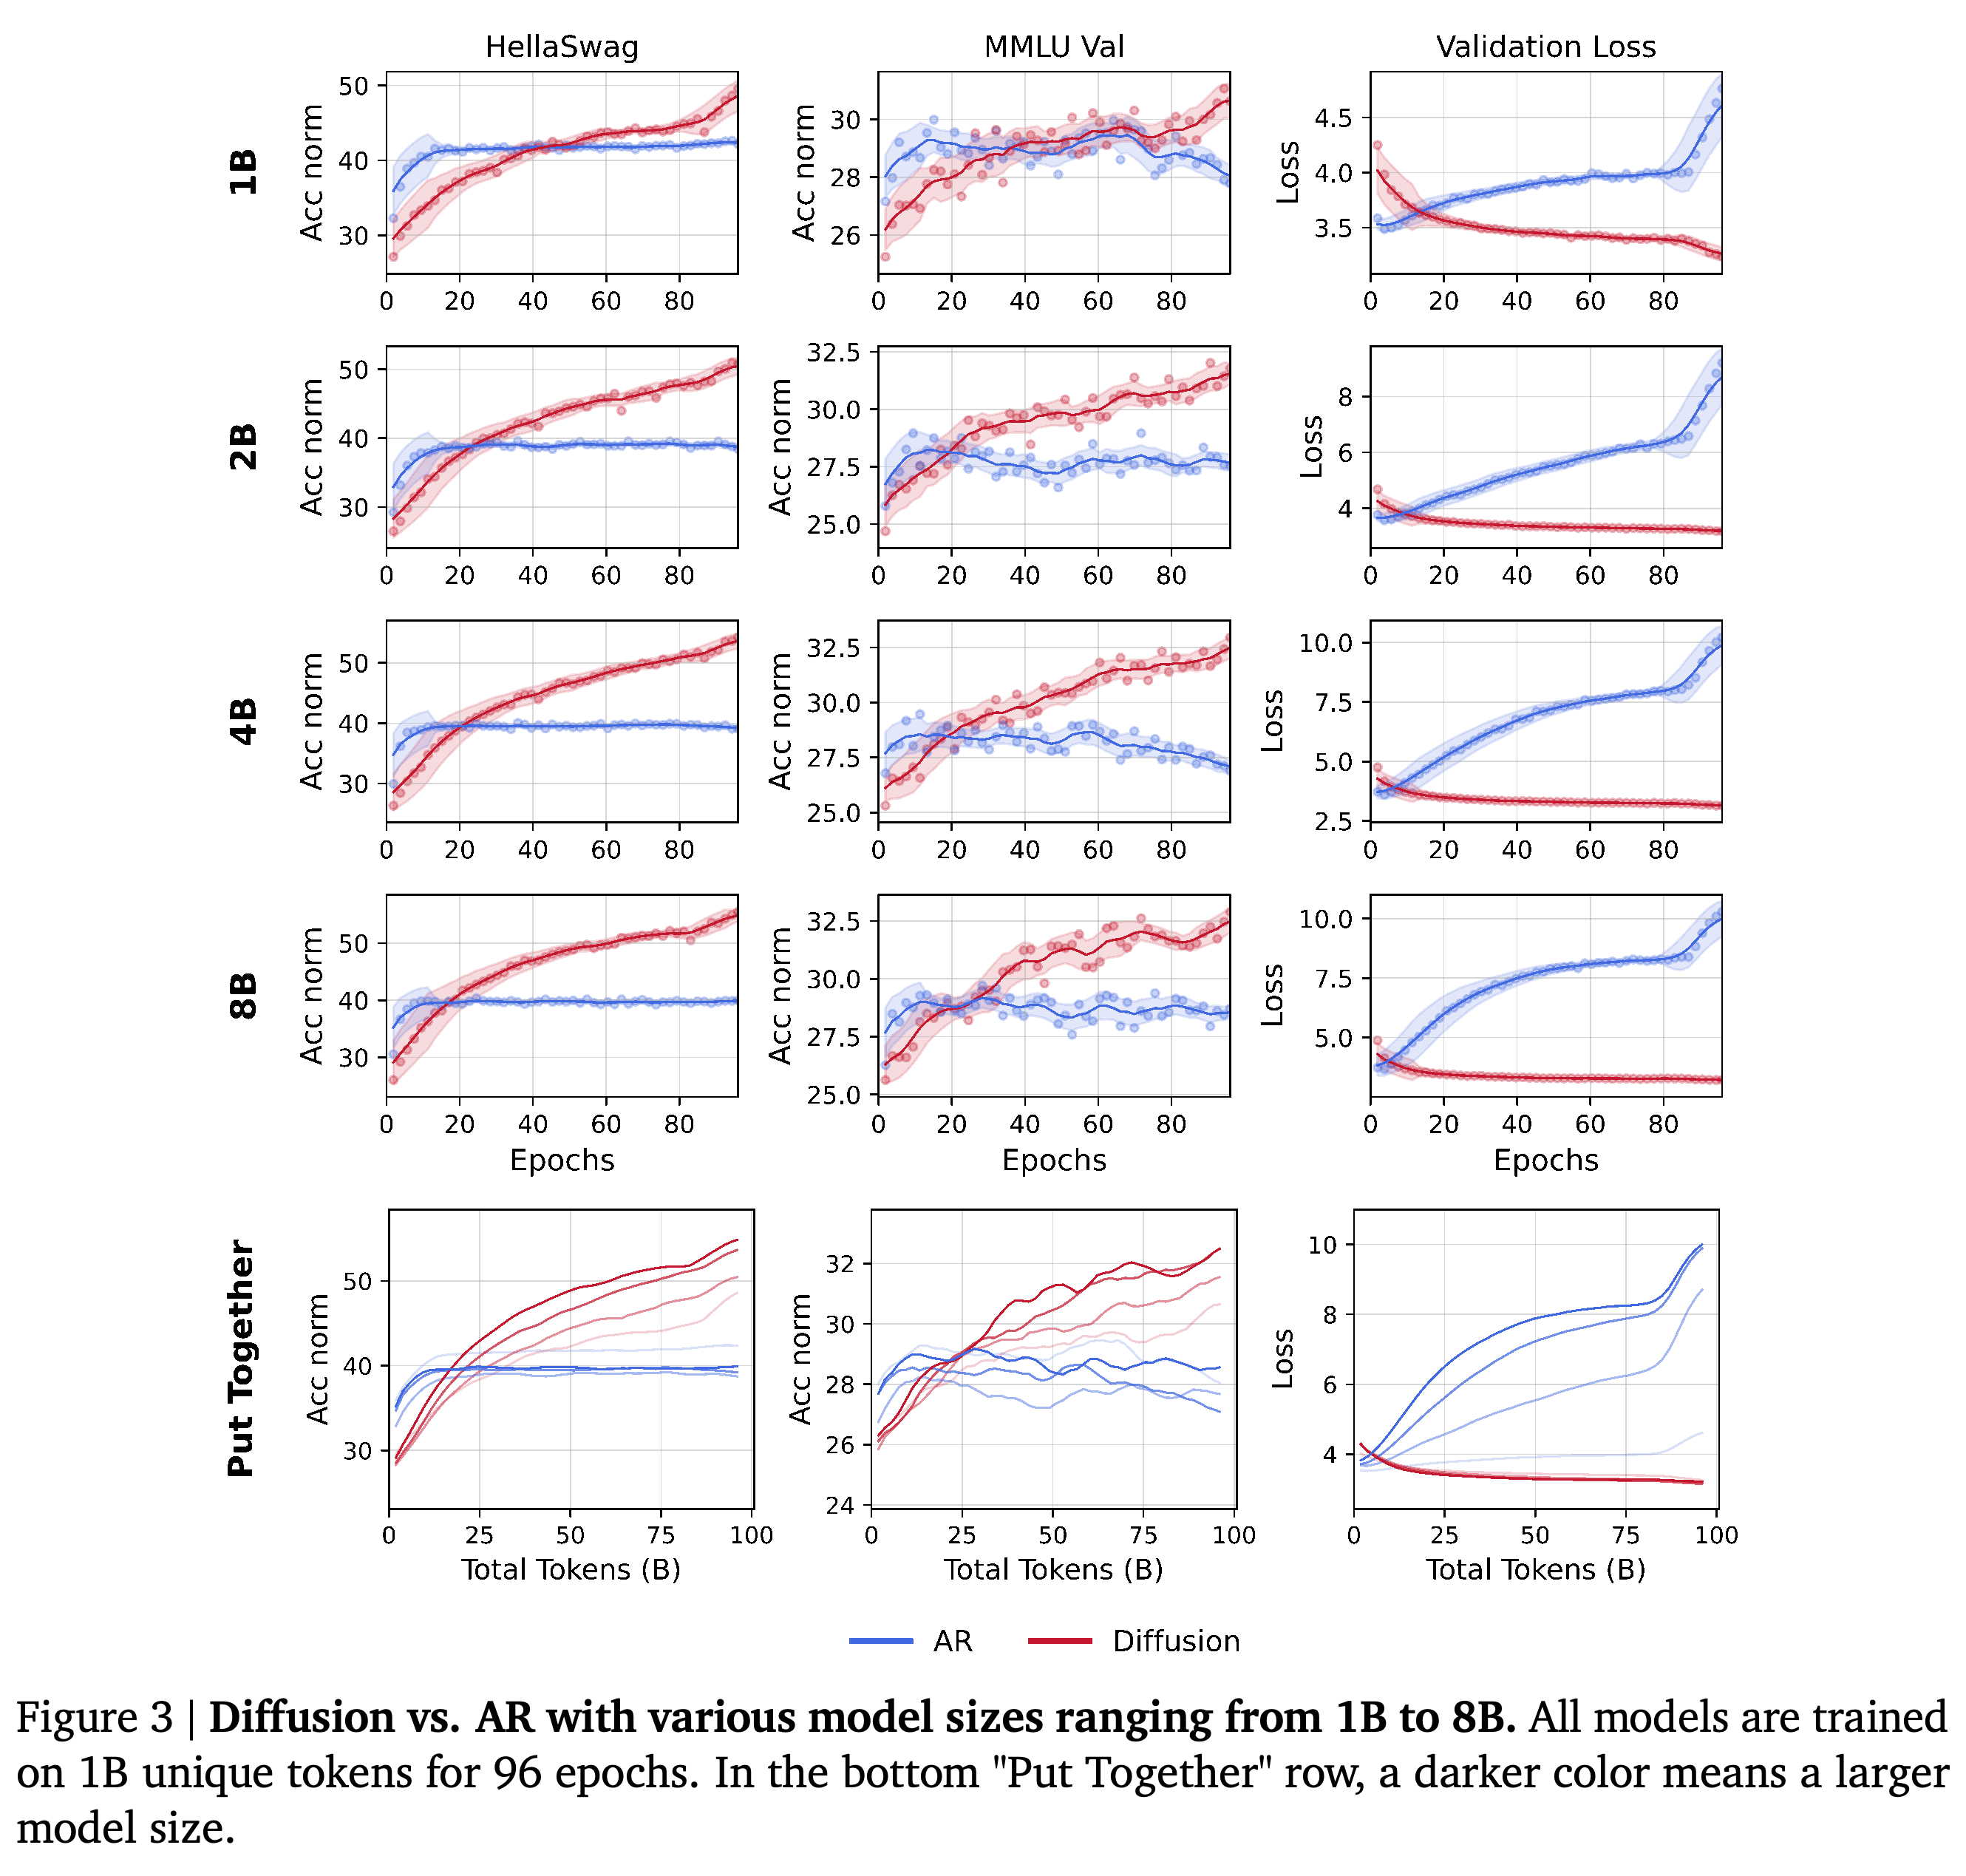
Models with 1B, 2B, 4B, and 8B parameters are trained on 1B unique tokens for 96 epochs with the other settings held constant. Figure 3 shows larger diffusion models learning faster and achieving stronger final benchmark results, whereas larger AR models saturate early and exhibit higher validation loss. Under these conditions, even the 1B diffusion model finishes above the tested AR models across sizes.
- The authors explain the difference through the larger set of conditional prediction problems available to diffusion: a sequence of length L permits \(2^L\) binary masking configurations, compared with L causal prefixes. They acknowledge that these configurations do not all provide distinct learning signal, so the count does not measure independent information.
Increasing diffusion model size improves final benchmark results and brings crossover earlier. Increasing AR size under the same small-data regime yields little downstream benefit and substantially higher late validation loss.
3.5. Sparse, Dense, Super-Density
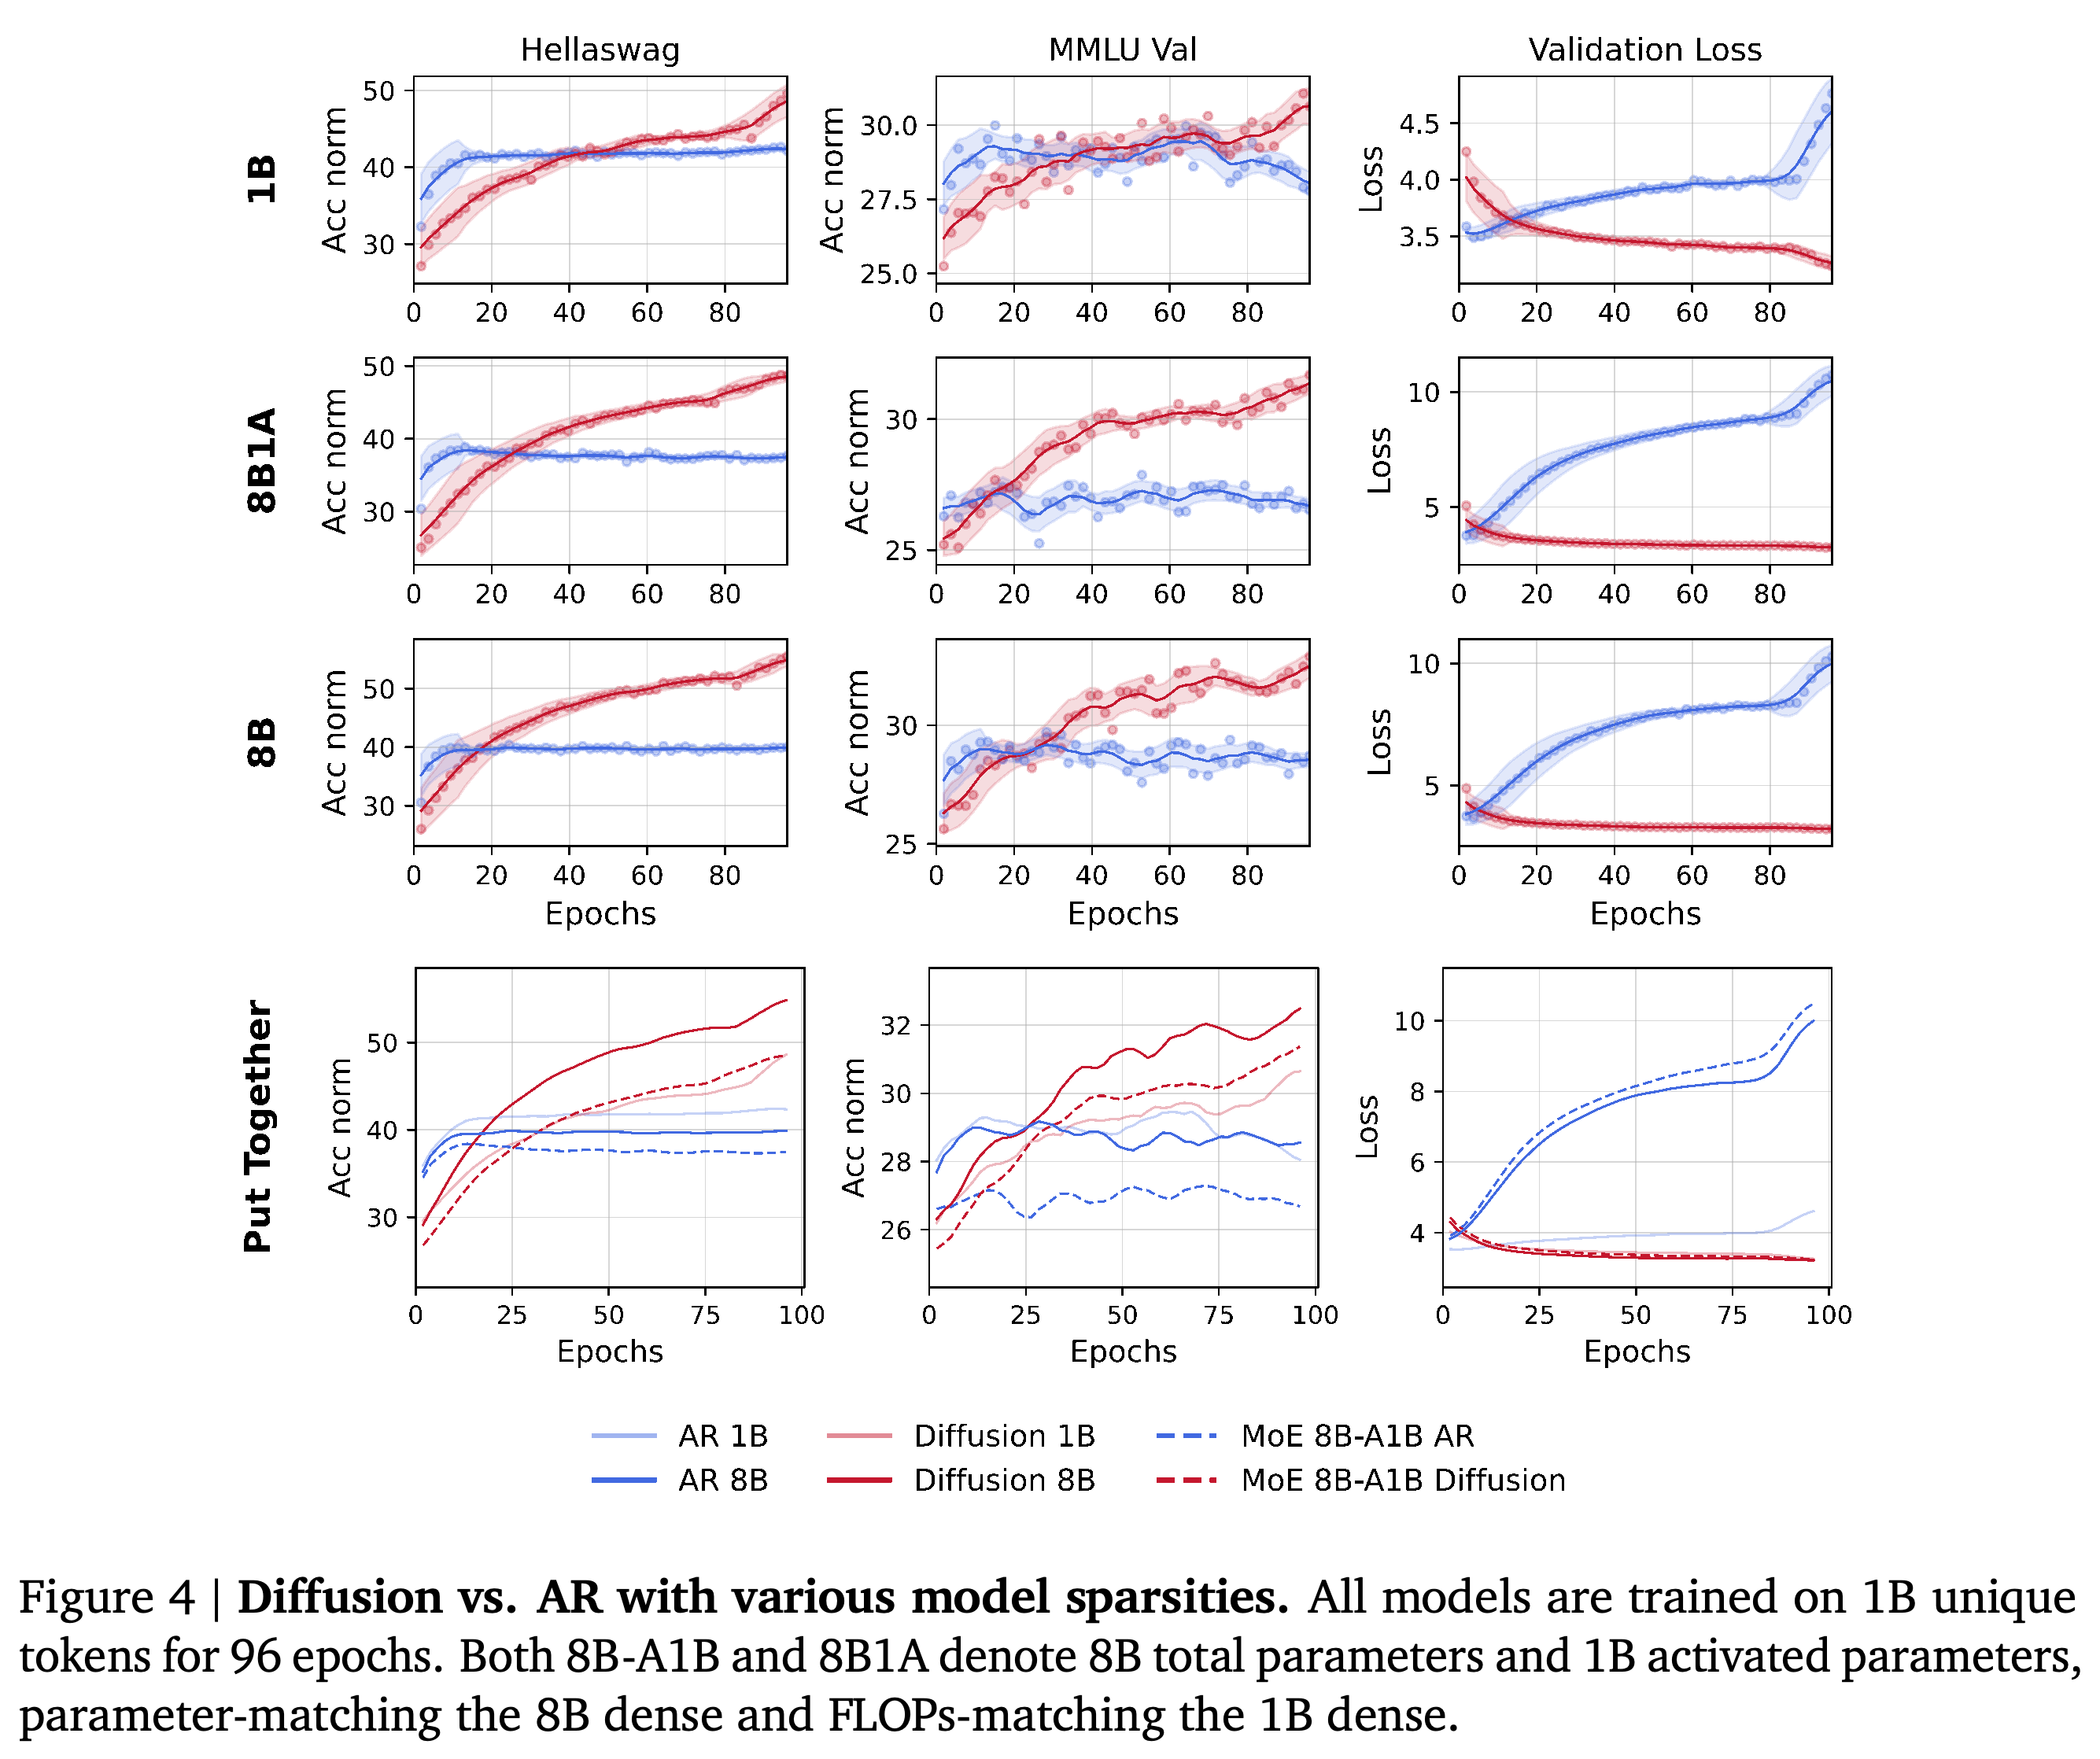
The sparsity experiment compares 1B dense models, which activate their full parameter set, 8B dense models, and mixture-of-experts models with 8B total and 1B active parameters, denoted 8B1A or 8B-A1B. All use 1B unique tokens for 96 epochs; the sparse model matches the 1B dense model’s active parameters and the 8B dense model’s total parameters. Figure 4 shows diffusion surpassing AR in every tested configuration, with crossover timing ordered as 8B dense, then 8B1A mixture-of-experts, then 1B dense.
- AR expansion from 1B to 8B total parameters degrades final performance in this regime, with sparse expansion performing worst. At fixed 8B total parameters, the dense model outperforms the sparse model in both families.
- Diffusion’s sparse model generally falls between its 1B and 8B dense counterparts, particularly on MMLU. These observations support a role for active computation under data constraints, although changing sparsity also changes routing and architecture.
Diffusion crosses above AR for dense and sparse configurations. The 8B-total, 1B-active diffusion model generally lies between the dense diffusion models, while the corresponding sparse AR model performs poorly; at fixed total parameters, dense computation gives stronger results in these experiments.
3.6. Is Noise Deciding the Game?
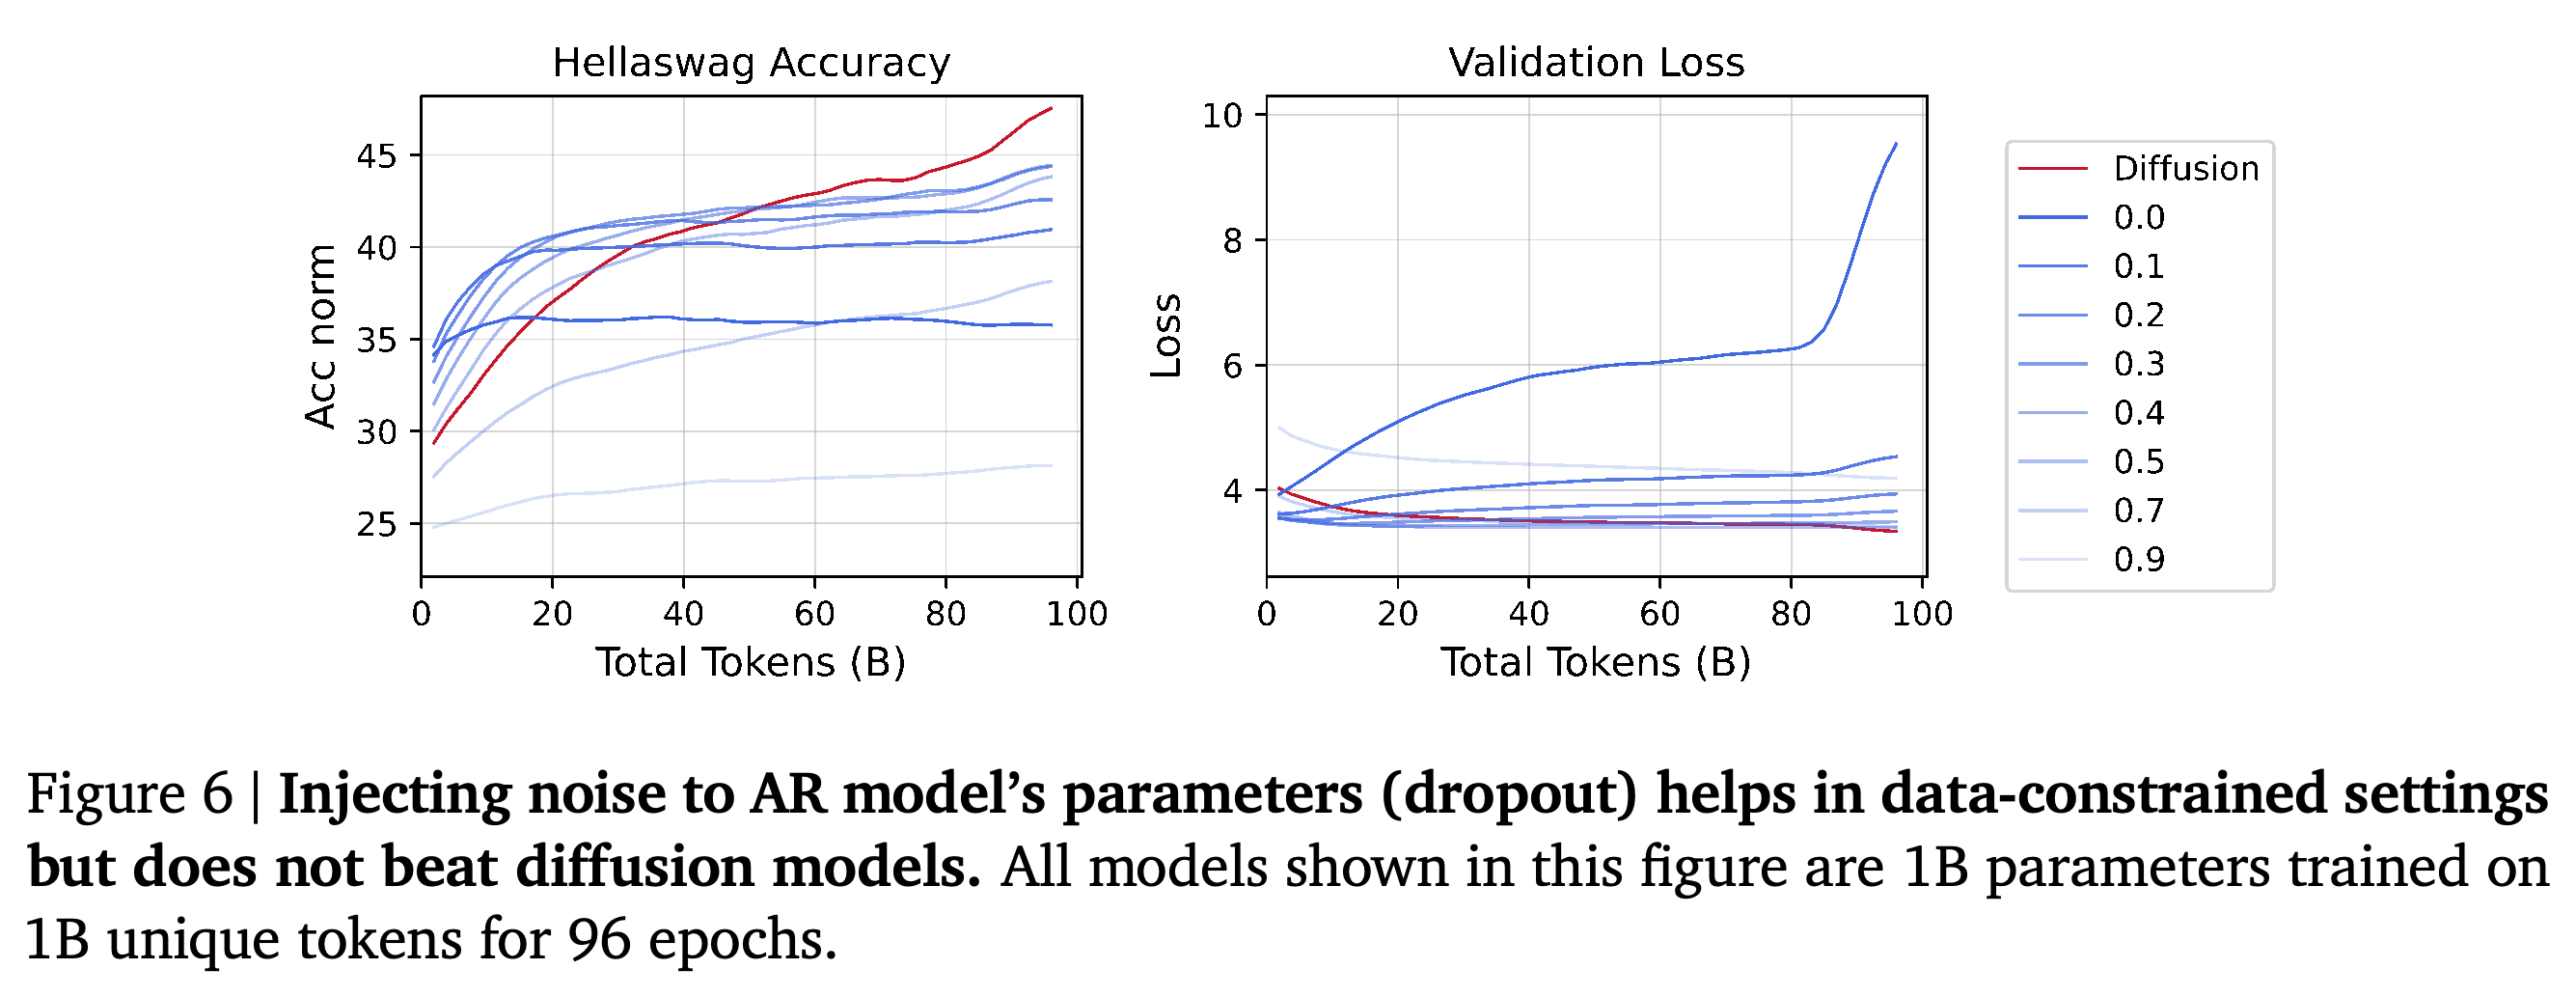
The noise ablations test whether augmentation alone explains diffusion’s advantage, using 1B-parameter models trained on 1B unique tokens for 96 epochs. Random input masking from 10% to 90% improves AR at modest corruption levels, with 10% the best tested masking configuration, but severe corruption reduces performance. Dropout also improves AR, yet neither intervention reaches diffusion’s final HellaSwag performance in Figures 5 and 6.
- The results show that noise provides useful regularization, a training intervention that reduces overfitting, under data scarcity. They do not separately quantify the contributions of any-order modeling and extra computation; the paper acknowledges that controlled ablations of those factors are difficult.
Several dropout settings improve AR accuracy and suppress its validation-loss increase, but none reaches diffusion’s final HellaSwag result. Better loss behavior therefore does not eliminate the downstream performance gap.
4. Scaling Crossovers to Trillion-Level Total Tokens
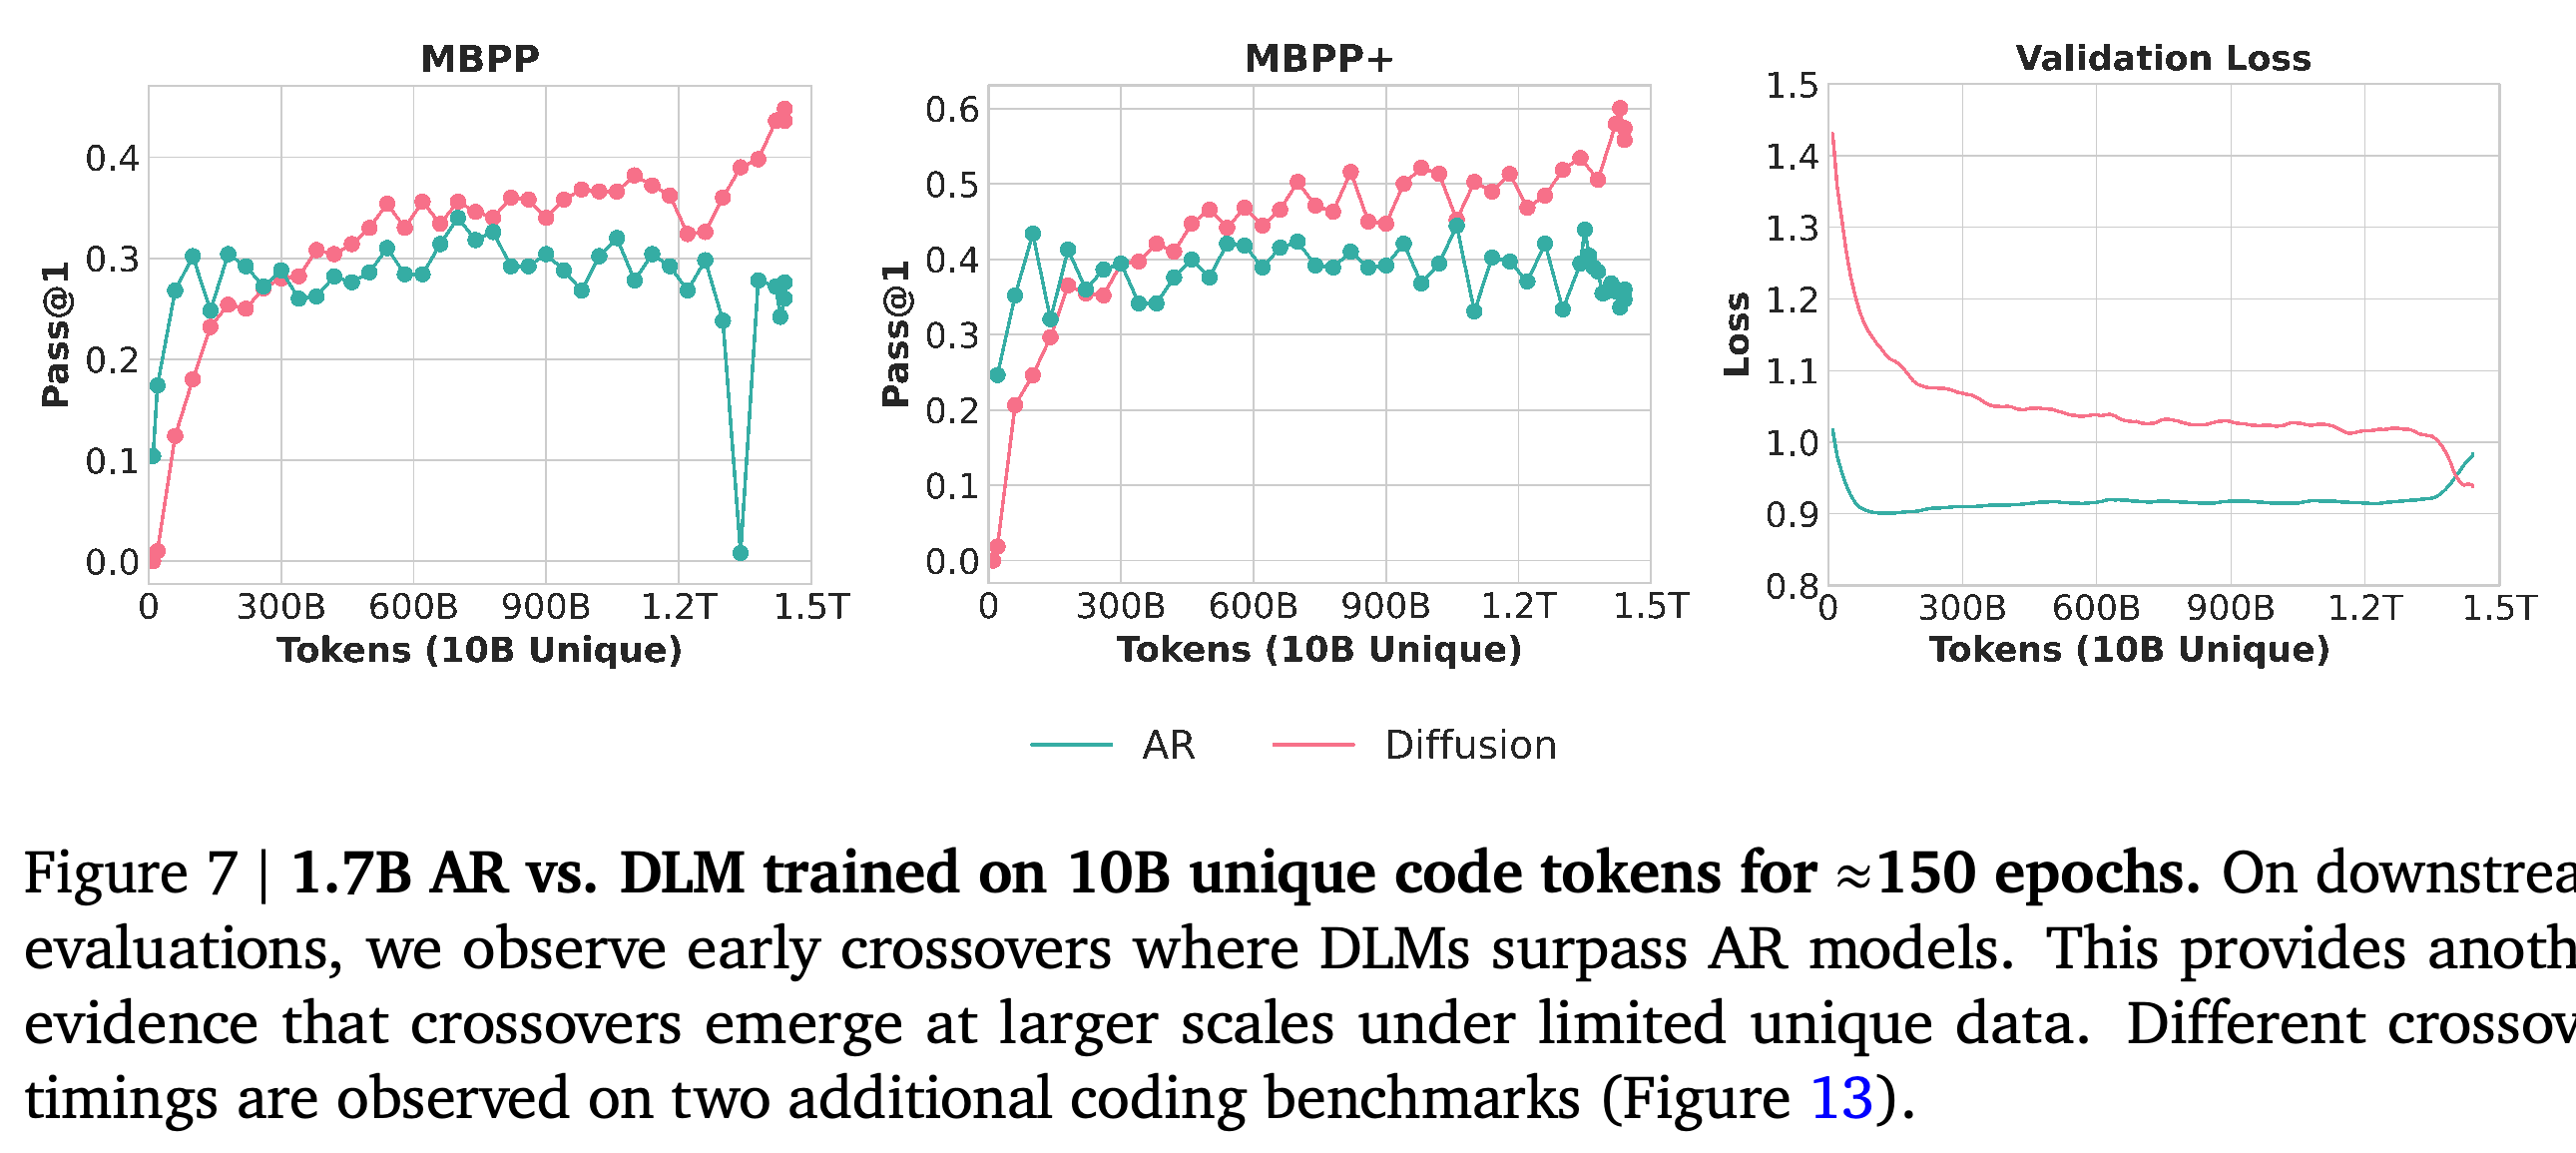
The scaled code experiment trains paired 1.7B-parameter models for approximately 150 epochs using a corpus described as 9B unique Python tokens plus 1B annealing tokens, used during the final learning-rate decay, for an approximately 1.5T-token training budget. Settings include sequence length 4096, global batch size 1024, weight decay 0.1, a parameter regularization coefficient, the GPT-NeoX tokenizer, and a WSD schedule with 2000 warmup steps and decay over 100B tokens. Figure 7 shows early diffusion crossovers on MBPP and MBPP+, evaluated by the fraction of problems solved by one generated attempt, or Pass@1.
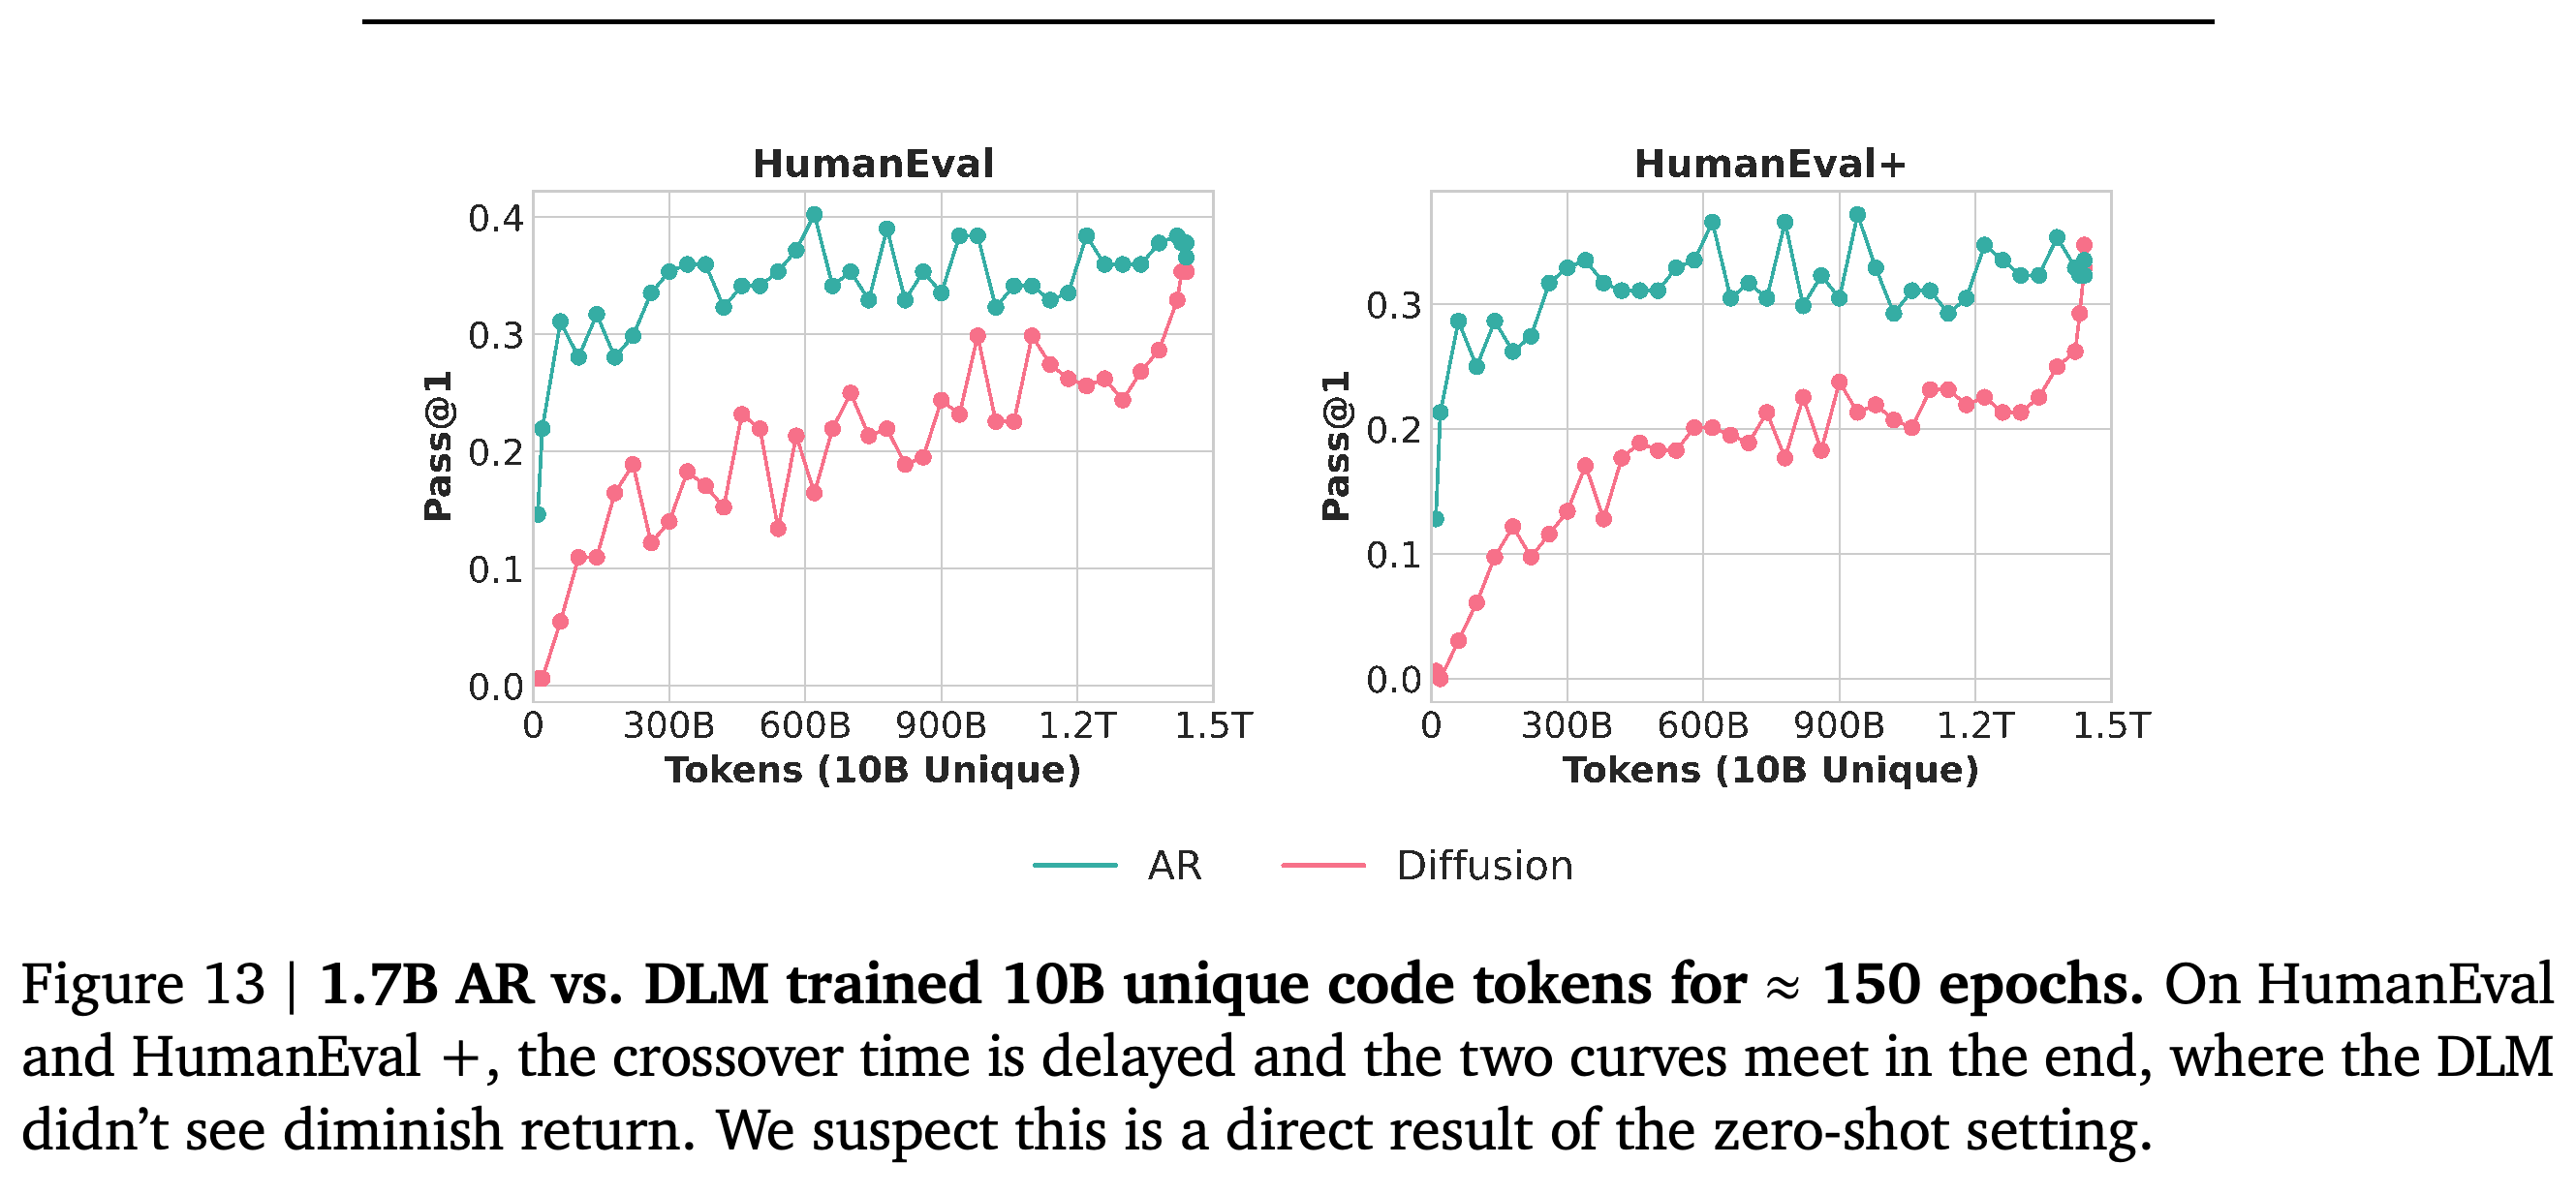
- HumanEval and HumanEval+ approach parity only near the end of annealing in Figure 13. MBPP variants use three prompt examples, while HumanEval variants use none; the authors hypothesize that this difference affects crossover timing, but they do not isolate it experimentally.
- Diffusion has not clearly converged by the final checkpoint. The study demonstrates crossover at a larger token budget and on generation tasks, while the different benchmark trajectories preclude a uniform crossover time.
Diffusion overtakes AR on MBPP and MBPP+ well before the approximately 1.5T-token endpoint and remains stronger at the end. AR maintains lower validation loss for most of training, showing that generative benchmark ranking can diverge from loss ranking.
Diffusion trails AR for most of HumanEval and HumanEval+ training and approaches parity near the final annealing stage. This delayed trajectory qualifies the early crossover on MBPP variants; the zero-shot explanation remains a hypothesis because prompting conditions were not independently varied.
5. High Validation Loss ≠ Degraded Intelligence
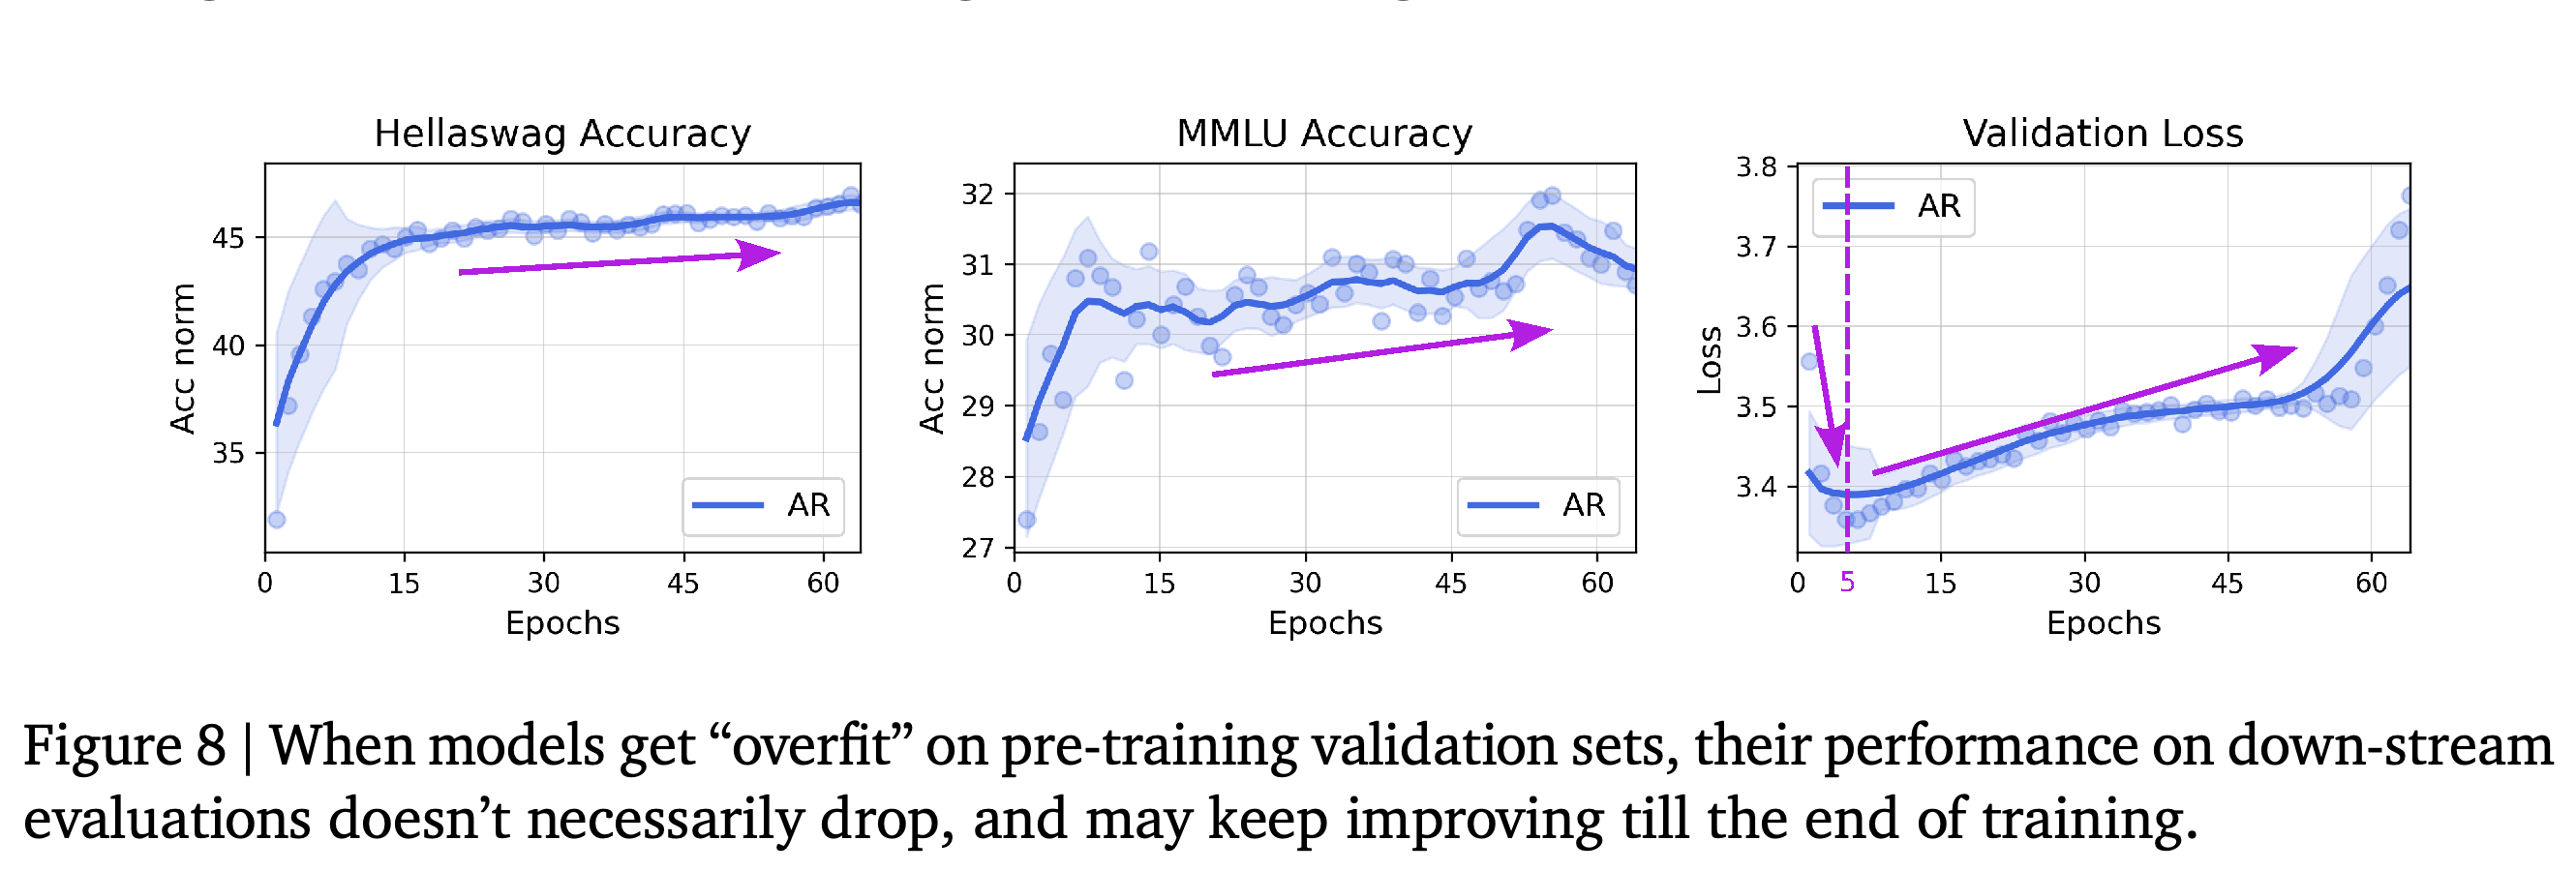
Increasing validation cross-entropy, a loss based on the probability assigned to observed tokens, does not necessarily mean declining multiple-choice accuracy: absolute negative log-likelihood (NLL) can worsen while relative answer scores improve. Figures 8 and 9 show AR validation loss increasing while correct-answer NLL remains lower than alternative-answer NLL and their separation generally widens. The detailed analysis uses a 1B-parameter AR model trained on 1.5B unique tokens for 64 epochs, including both Nemotron-CC training with c4 validation and c4 training with c4 validation.
- The first reported validation checkpoint, after 3,600 training steps, already favors correct choices. Subsequent increases in the NLL of both correct and incorrect answers can preserve or improve their relative ranking.
- The authors propose excessive confidence on some text segments as an explanation and extend this reasoning to generative tasks as a hypothesis. The observations support evaluating downstream performance alongside loss.
After validation loss reaches its minimum near epoch 5 and begins rising, HellaSwag accuracy continues improving and MMLU accuracy does not show a corresponding monotonic decline. The onset of validation-loss overfitting therefore does not identify a universal stopping point for downstream capability.
6. Diffusion Language Models also Overfit the Data
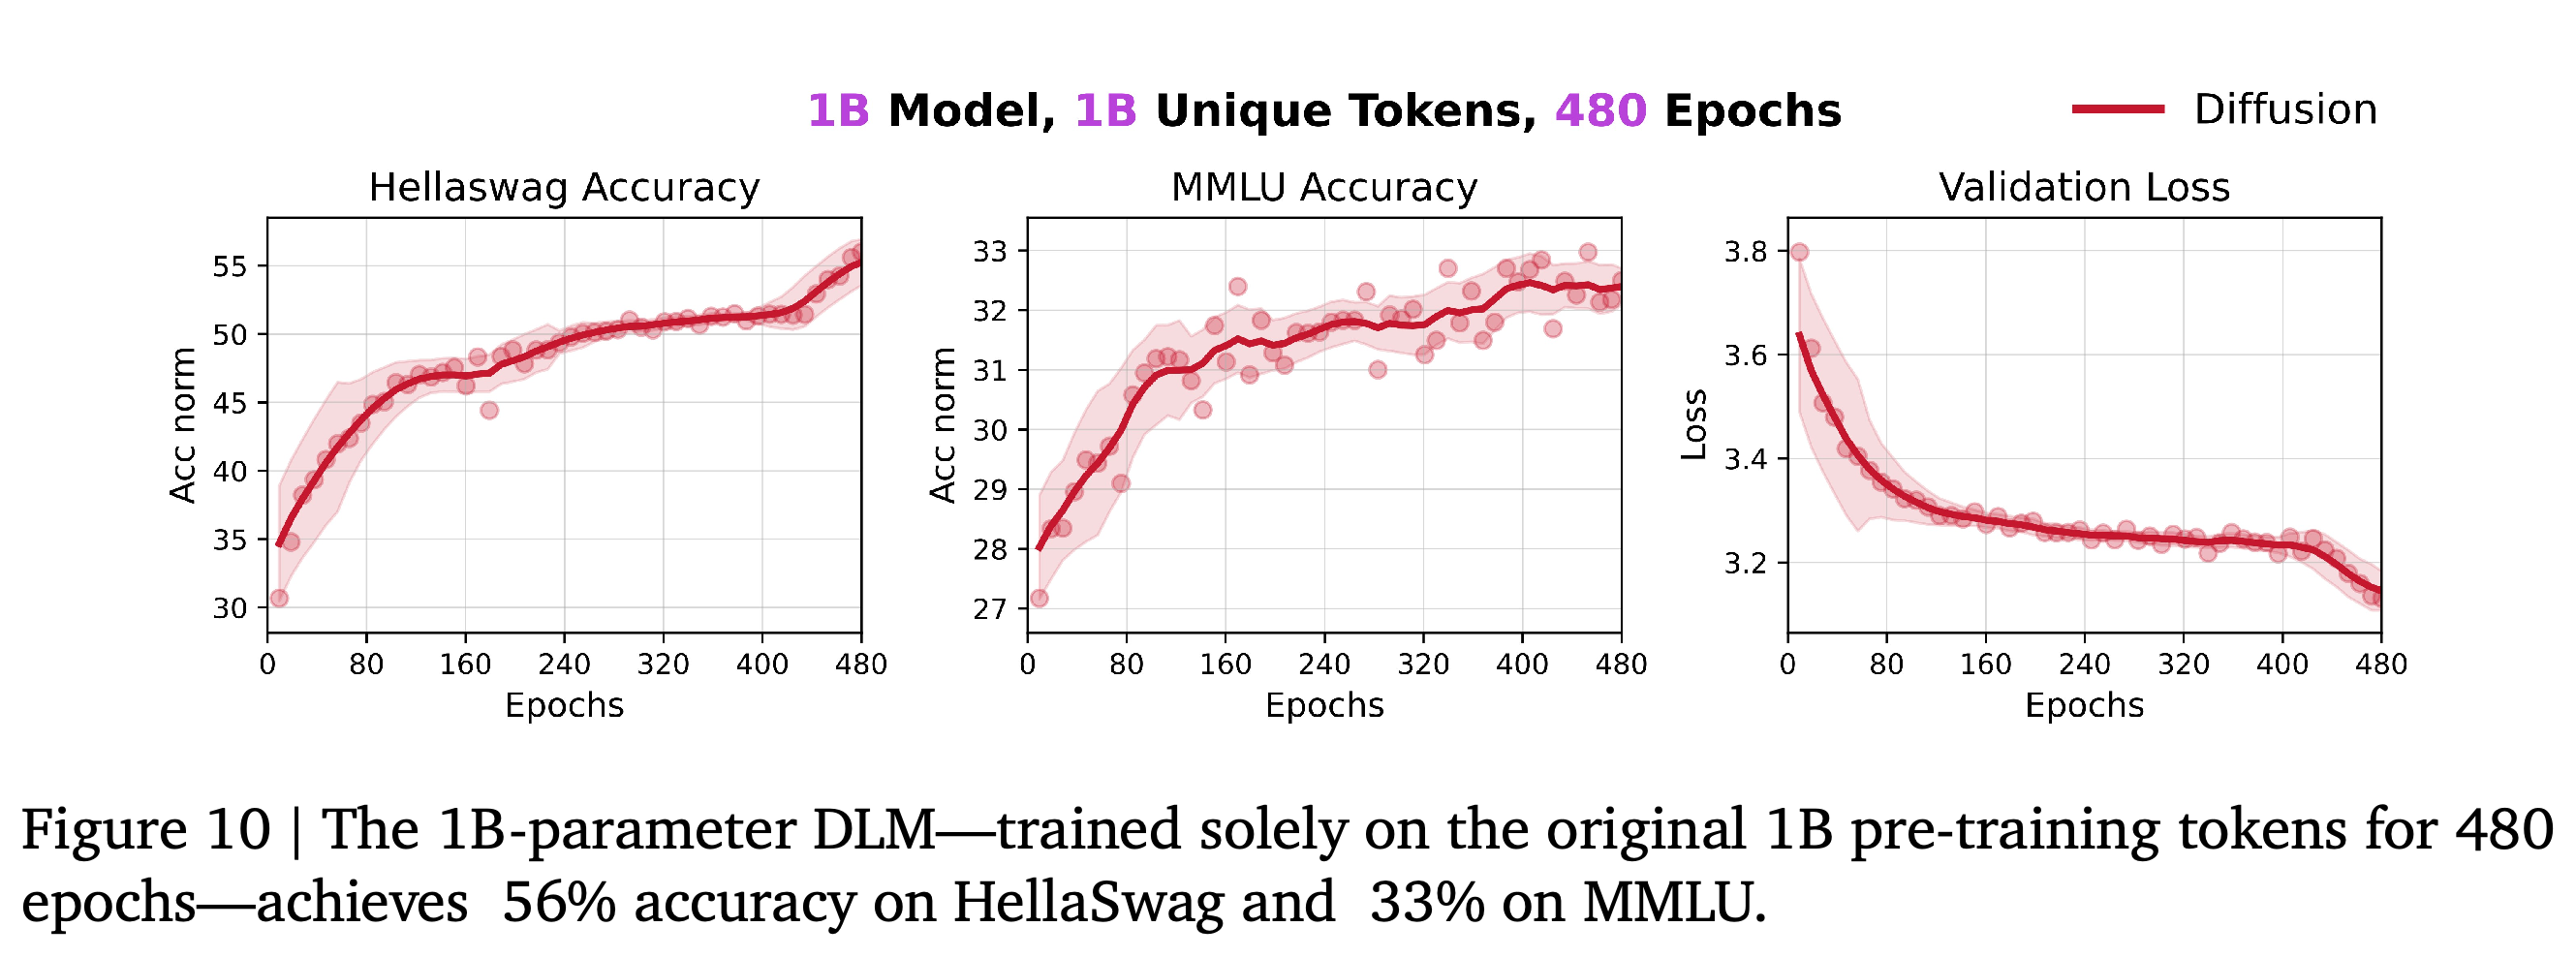
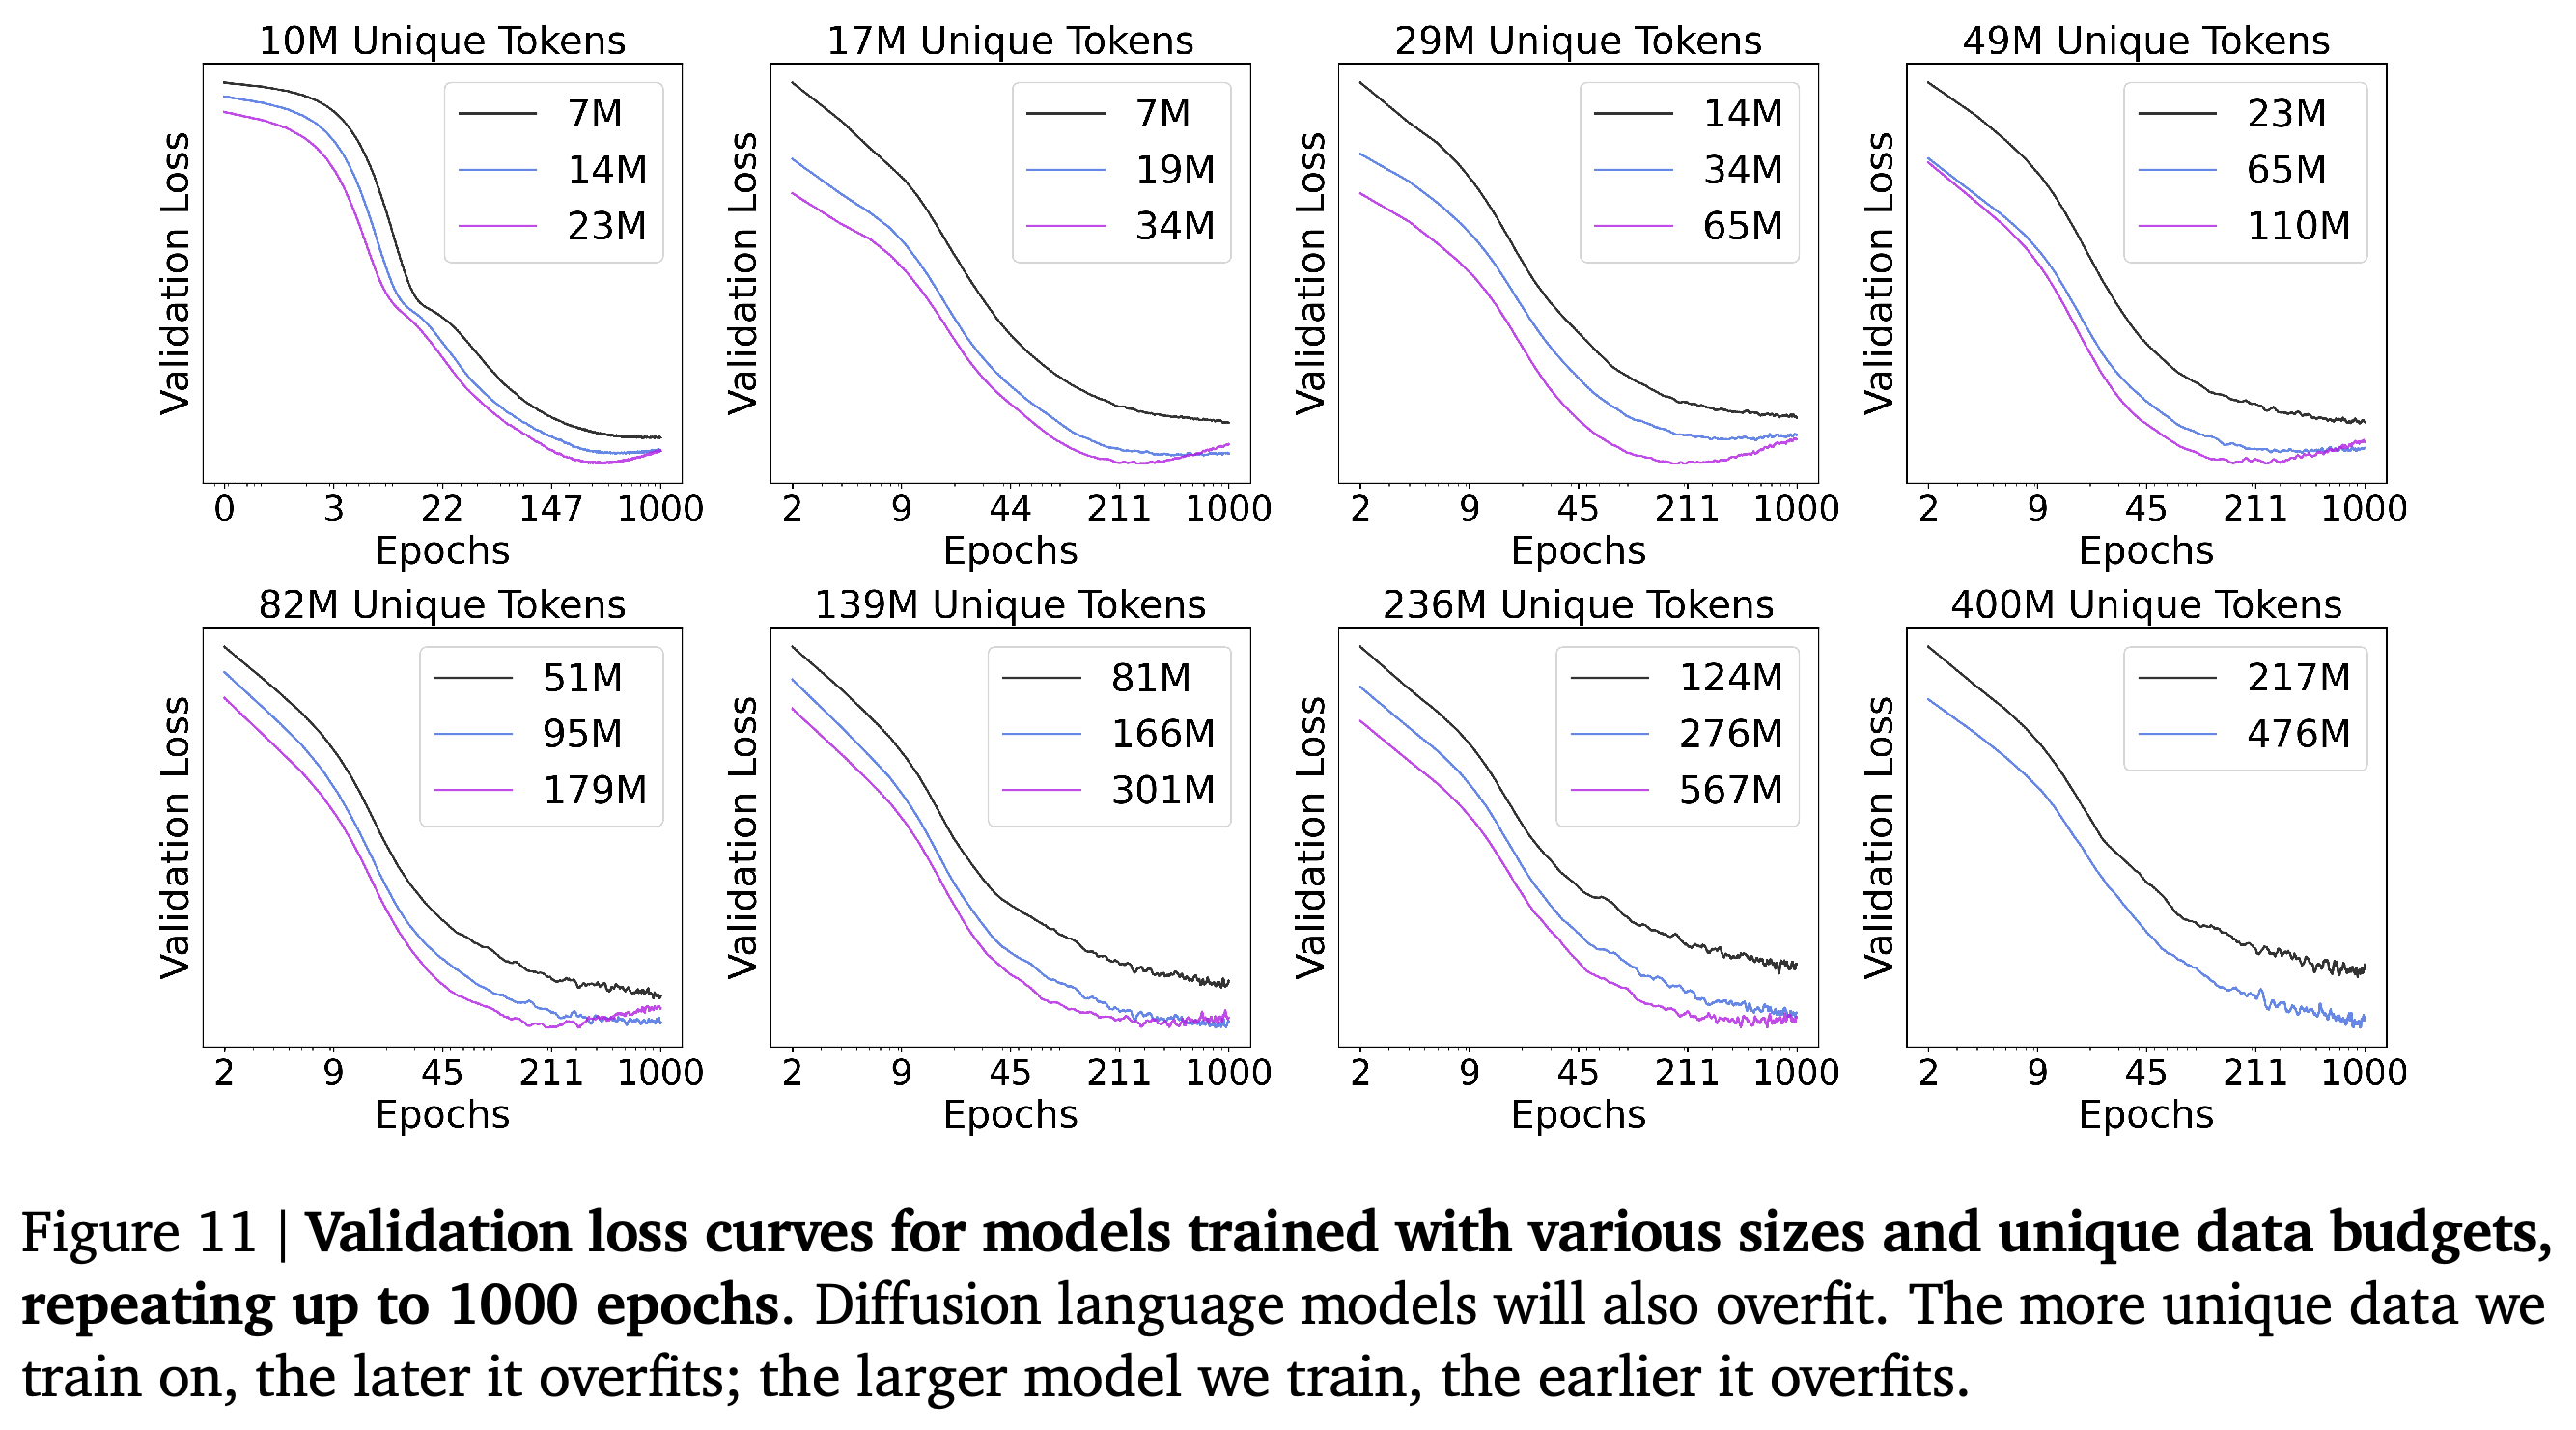
Extending a 1B-parameter DLM to 480 epochs over the same 1B-token dataset produces 480B total training tokens and the reported 56% HellaSwag and 33% MMLU accuracy in Figure 10. The section compares these with reported AR results of 41% and 29%, without presenting a paired 480-epoch AR experiment. Separate c4-en runs extending to 1000 epochs show that diffusion validation loss eventually rises when unique datasets are sufficiently small and models sufficiently large.
- Figure 11 covers unique-data budgets from 10M to 400M tokens with multiple model sizes. More unique data delays validation-loss overfitting, while larger models bring its onset earlier.
- The extended runs establish that diffusion also overfits. A loss increase does not itself establish when downstream performance declines.
Benchmark accuracy improves over hundreds of repetitions, and validation loss falls further during the final training phase. The reported 56% HellaSwag and 33% MMLU results demonstrate additional learning from the same 1B-token dataset within the tested 480 epochs.
Some larger models on the smallest datasets develop rising validation loss after prolonged repetition. Larger unique-data budgets postpone this behavior, demonstrating eventual diffusion overfitting; the figure does not directly measure downstream accuracy at its onset.
7. Discussions
The discussion interprets the experiments as a trade-off between learning more from fixed data and minimizing computational work. It organizes diffusion’s proposed advantages into arbitrary-context prediction, repeated computation, and sampling of corrupted data, then contrasts these with AR’s efficient training and serving.
7.1. What is the Real Advantage of Diffusion Language Models?
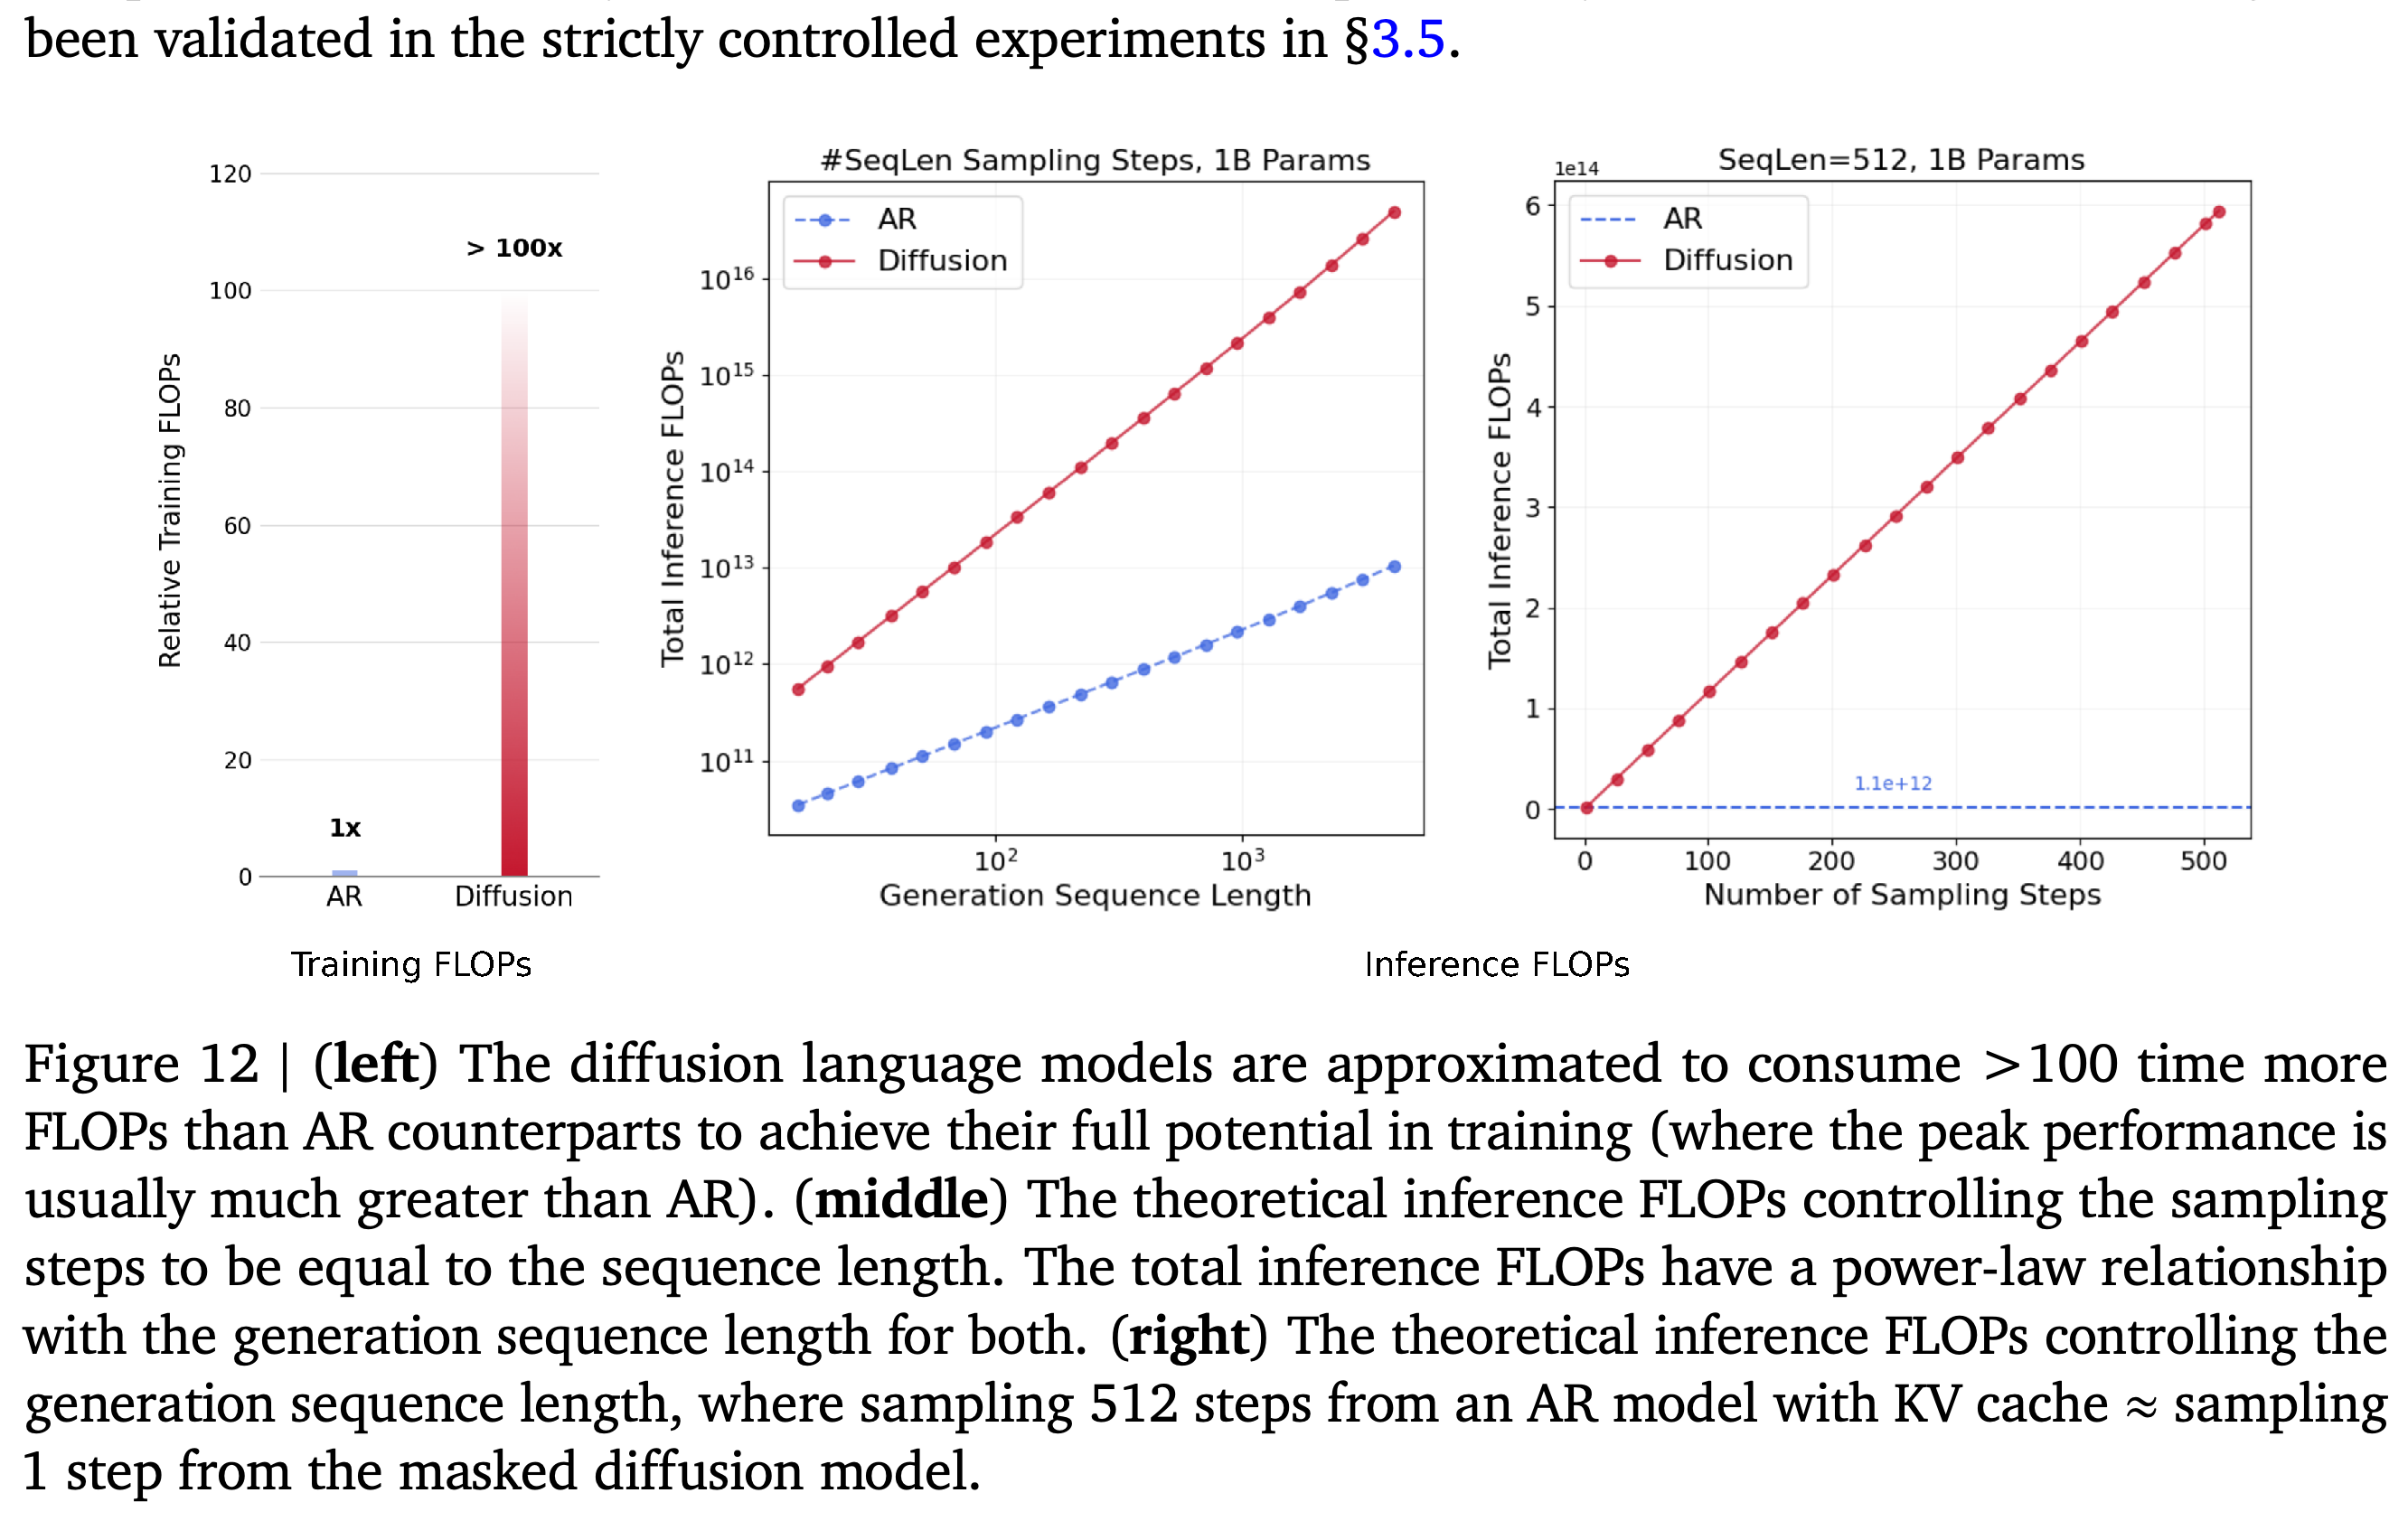
The authors argue that any-order prediction exposes relationships unavailable to strictly causal prediction, while repeated masking samples more of the diffusion objective’s expectation. Their super-density argument emphasizes that iterative denoising repeatedly computes representations instead of relying on the reuse available through AR’s KV cache. Figure 12 combines a preliminary estimate of >100× training FLOPs to reach diffusion’s full potential with theoretical inference calculations.
- The middle panel sets the number of sampling steps equal to generated sequence length for 1B-parameter models. Across lengths 16–4096, the discussion reports inference FLOP ratios from 16× to 4700×; these are theoretical calculations rather than measured serving latencies.
- At sequence length 512, the right panel shows diffusion computation increasing linearly with denoising steps and approximately equates one diffusion step with generating the whole sequence using cached AR. Parallel execution can affect latency, so FLOP ratios alone do not determine elapsed time.
- The >100× training estimate concerns reaching each family’s potential and varies with model size and data budget. It is not the FLOP ratio of every matched-token comparison in the paper.
The training panel gives a preliminary >100× estimate for reaching diffusion’s full potential, while the inference panels calculate the FLOP cost of repeated full-sequence processing. The middle panel sets sampling steps equal to sequence length, and the right fixes length at 512; these conditions are essential for interpreting the ratios.
7.2. Autoregressive Models are Trading Data Potential for Compute Efficiency
AR supervises every token during teacher-forced training and reuses computation during sequential inference. Under a linear masking schedule, the paper states that AR receives approximately twice the expected supervised-token signals of masked diffusion in a training batch; it also cites prior evidence that left-to-right modeling gives lower web-text loss than alternative single sequence orders. Block diffusion, which generates blocks using diffusion conditioned on preceding clean context, is discussed as an intermediate approach whose training efficiency remains challenging.
7.3. Limitations
The paper identifies higher energy costs, processing time, and memory pressure from repeated bidirectional computation, together with sensitivity to masking schedules, denoising weights, step counts, and decoding policies. Diffusion’s variational objective makes perplexity, a likelihood-based prediction measure, unsuitable for direct comparison with normalized AR likelihood. The experiments also leave streaming, tool use, long-horizon generation, multilingual training, multimodal training, and long-context behavior insufficiently characterized.
- Heavy data reuse can increase memorization and benchmark-contamination risk when duplicate removal or auditing is imperfect. The paper identifies these risks without measuring their extent.
- The deployment stack for DLMs is less mature than the AR stack. The paper discusses lower latency through multi-token generation, but its FLOP analysis does not establish practical latency under specified hardware and decoding settings.
8. Related Work
Related work covers masked diffusion theory, large DLMs trained from scratch, commercial diffusion systems, and hybrid AR–diffusion methods. It also reviews approaches to scarce unique data: repeated training, dropout, corpus curation, rewriting, synthetic data, retrieval, pruning, and domain upsampling, which increases the training share of a selected domain. This paper investigates repeated pretraining across model families; it does not experimentally compare diffusion against every reviewed data-improvement strategy.
Appendix
- The supplied PDF has no separately titled appendix. Its final page contains Table 1 and Figure 13 after the references: Table 1 records evaluation protocols, and Figure 13 supplies the delayed HumanEval and HumanEval+ trajectories discussed in the main text. Project resources are https://github.com/JinjieNi/dlms-are-super-data-learners and the training backend https://github.com/JinjieNi/MegaDLMs; the supplied version is https://arxiv.org/abs/2511.03276v1.
Brief Thoughts
The strongest evidence is the repeated observation of crossover across controlled data, quality, size, and sparsity experiments, followed by confirmation on code generation at a larger training budget. For engineering decisions, the results support evaluating longer data reuse with downstream metrics when unique data is scarce, while accounting for training and serving costs. The causal explanation remains less settled than the empirical pattern: noise is directly ablated, but any-order modeling and additional computation are not independently isolated, and the theoretical cost analysis does not establish production latency.