


SWE-CI: Evaluating Agent Capabilities in Maintaining Codebases via Continuous Integration | Summary
04 Mar 2026 | Paper Review AI Coding Agents Software Maintenance LLM EvaluationContents
- Summary
- 1 Introduction
- 2 Measuring the Agent’s Ability to Maintain Codebase
- 3 SWE-CI
- 4 Experiments
- 5 Conclusion
- Appendix
- Brief Thoughts
This article explains the key points of SWE-CI: Evaluating Agent Capabilities in Maintaining Codebases via Continuous Integration.
- 2026-03-04 (arXiv)
- Chen, Jialong, Xu, Xander, Wei, Hu, Chen, Chuan, Zhao, Bing.
- Sun Yat-sen University, Alibaba Group, Skylenage
- Paper
- Github
Summary
- SWE-CI: Evaluating Agent Capabilities in Maintaining Codebases via Continuous Integration evaluates repeated repository-level modification rather than isolated repairs. Its 100 tasks span 68 Python repositories, with base/oracle commits separated by an average of 233 days and 71 consecutive commits.
- An Architect–Programmer workflow derives incremental requirements from test failures, modifies the current codebase, and runs external verification for up to 20 iterations. EvoScore aggregates normalized changes in passing-test counts, with a weighting parameter that can emphasize later codebase states.
- Experiments cover 20 models from 8 providers and consume more than 10 billion tokens. Most models have a zero-regression rate below 0.25; on successfully solved tasks, 15 out of 20 models have favorable Pylint win/loss comparisons against human oracle code, whereas all 20 have unfavorable MI score comparisons.
- SWE-CI exposes progress and regressions across successive modifications, but EvoScore is a test-based proxy for maintainability rather than a direct measure of design quality. The results apply to Python repositories, unchanged-dependency spans, a fixed oracle test suite, and the evaluated dual-agent harness.
1 Introduction
The introduction argues that snapshot-style benchmarks cannot distinguish a brittle patch from an extensible implementation when both pass the same tests. SWE-CI carries the agent-modified codebase forward across iterations, allowing earlier implementation decisions to affect subsequent development.
- HumanEval, MBPP, and LiveCodeBench represent function-level synthesis; SWE-bench represents repository-level Issue-to-PR evaluation; Terminal-bench and τ-bench extend evaluation to interactive tool use.
- The paper draws on software evolution research and the cited estimate that maintenance accounts for 60% to 80% of software lifecycle costs.
- Historical commits establish the distance between task endpoints; the evaluation does not replay the 71 intervening commits as a sequence of historical requirements.
2 Measuring the Agent’s Ability to Maintain Codebase
The measurement framework separates requirement generation, code modification, and trajectory scoring. Its operational premise is that a codebase’s suitability for further modification can be assessed through functional correctness across repeated development steps.
- Normalized Change measures the current passing-test count relative to the base and oracle.
- EvoScore aggregates these measurements over the agent-generated evolution trajectory.
2.1 Task formalization
A task consists of a test set T, a base codebase c0, and an oracle codebase c*. The function require_T maps two codebases to a requirement document describing their functional gap, while code_T maps a requirement and a codebase to an updated codebase.
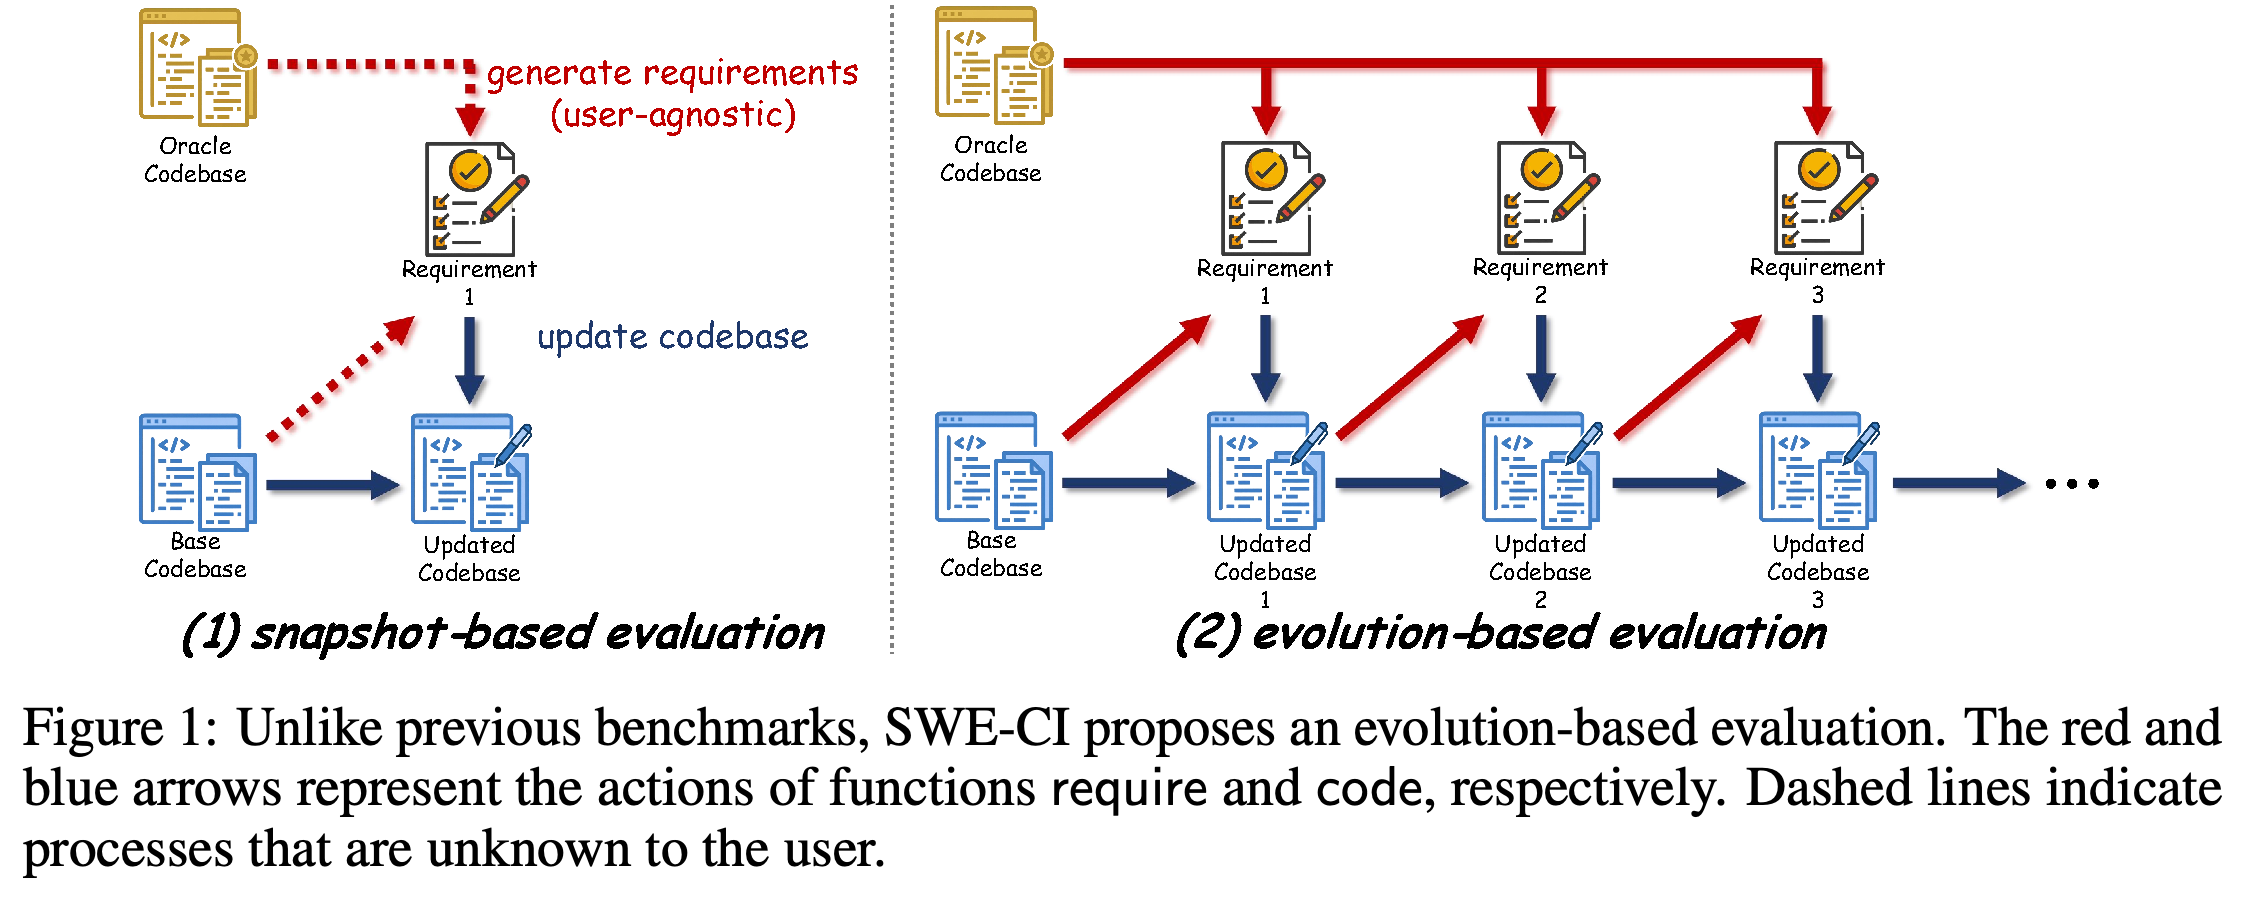
- Snapshot evaluation derives a single requirement from the base and oracle, then evaluates the resulting update.
- Evolution-based evaluation regenerates requirements from the current codebase and the same oracle, making each update the starting point for the next iteration.
- Figure 1 shows the continuing dependency between updated codebases and subsequent requirements.
The snapshot path generates one requirement from the base and oracle, whereas the evolution path repeatedly uses the updated codebase to generate the next requirement. This continuing state allows earlier implementation decisions to affect later performance.
2.2 Normalized Change
The passing-test count is (n(c)=\sum_{t\in T}\mathbb{I}(t,c)), where I(t,c) is 1 exactly when test t passes on codebase c. Normalized Change is a(c) = (n(c) − n(c0))/(n(c*) − n(c0)) when n(c) ≥ n(c0), and a(c) = (n(c) − n(c0))/n(c0) otherwise.
- Improvement is divided by the initial base-to-oracle gap; reaching the oracle’s passing-test count gives a(c) = 1.
- Deterioration below the base is divided by the initially passing-test count; when that count is positive, reducing it to zero gives a(c) = −1.
- The paper reports a range of [−1, 1]. The upper bound requires n(c) ≤ n(c*); the formula itself can exceed 1 if a codebase passes more tests than the oracle. The metric tracks net counts rather than individual test regressions.
2.3 EvoScore
For N updated codebases, EvoScore is e = (Σ_{i=1}^N γ^i a(ci))/(Σ_{i=1}^N γ^i). The definition specifies γ ≥ 1: γ = 1 yields the average Normalized Change, while larger values emphasize later states.
- The motivation follows ISO/IEC 25010’s definition of maintainability in terms of effective modification without introducing defects or degrading quality.
- Later weighting is intended to reward decisions that facilitate subsequent development rather than only rapid initial progress.
- EvoScore measures functional progress across a trajectory; it does not separate the contributions of architecture, requirement analysis, and implementation.
3 SWE-CI
SWE-CI converts chronological base/oracle commit pairs into executable maintenance tasks with source code and pre-built Docker environments. The dataset is available at https://huggingface.co/datasets/skylenage/SWE-CI, and the implementation is available at https://github.com/SKYLENAGE-AI/SWE-CI.
- The target is the oracle’s tested functionality, not exact reproduction of its source code.
- The benchmark combines environment-controlled data curation with iterative Architect–Programmer evaluation.
3.1 Data curation
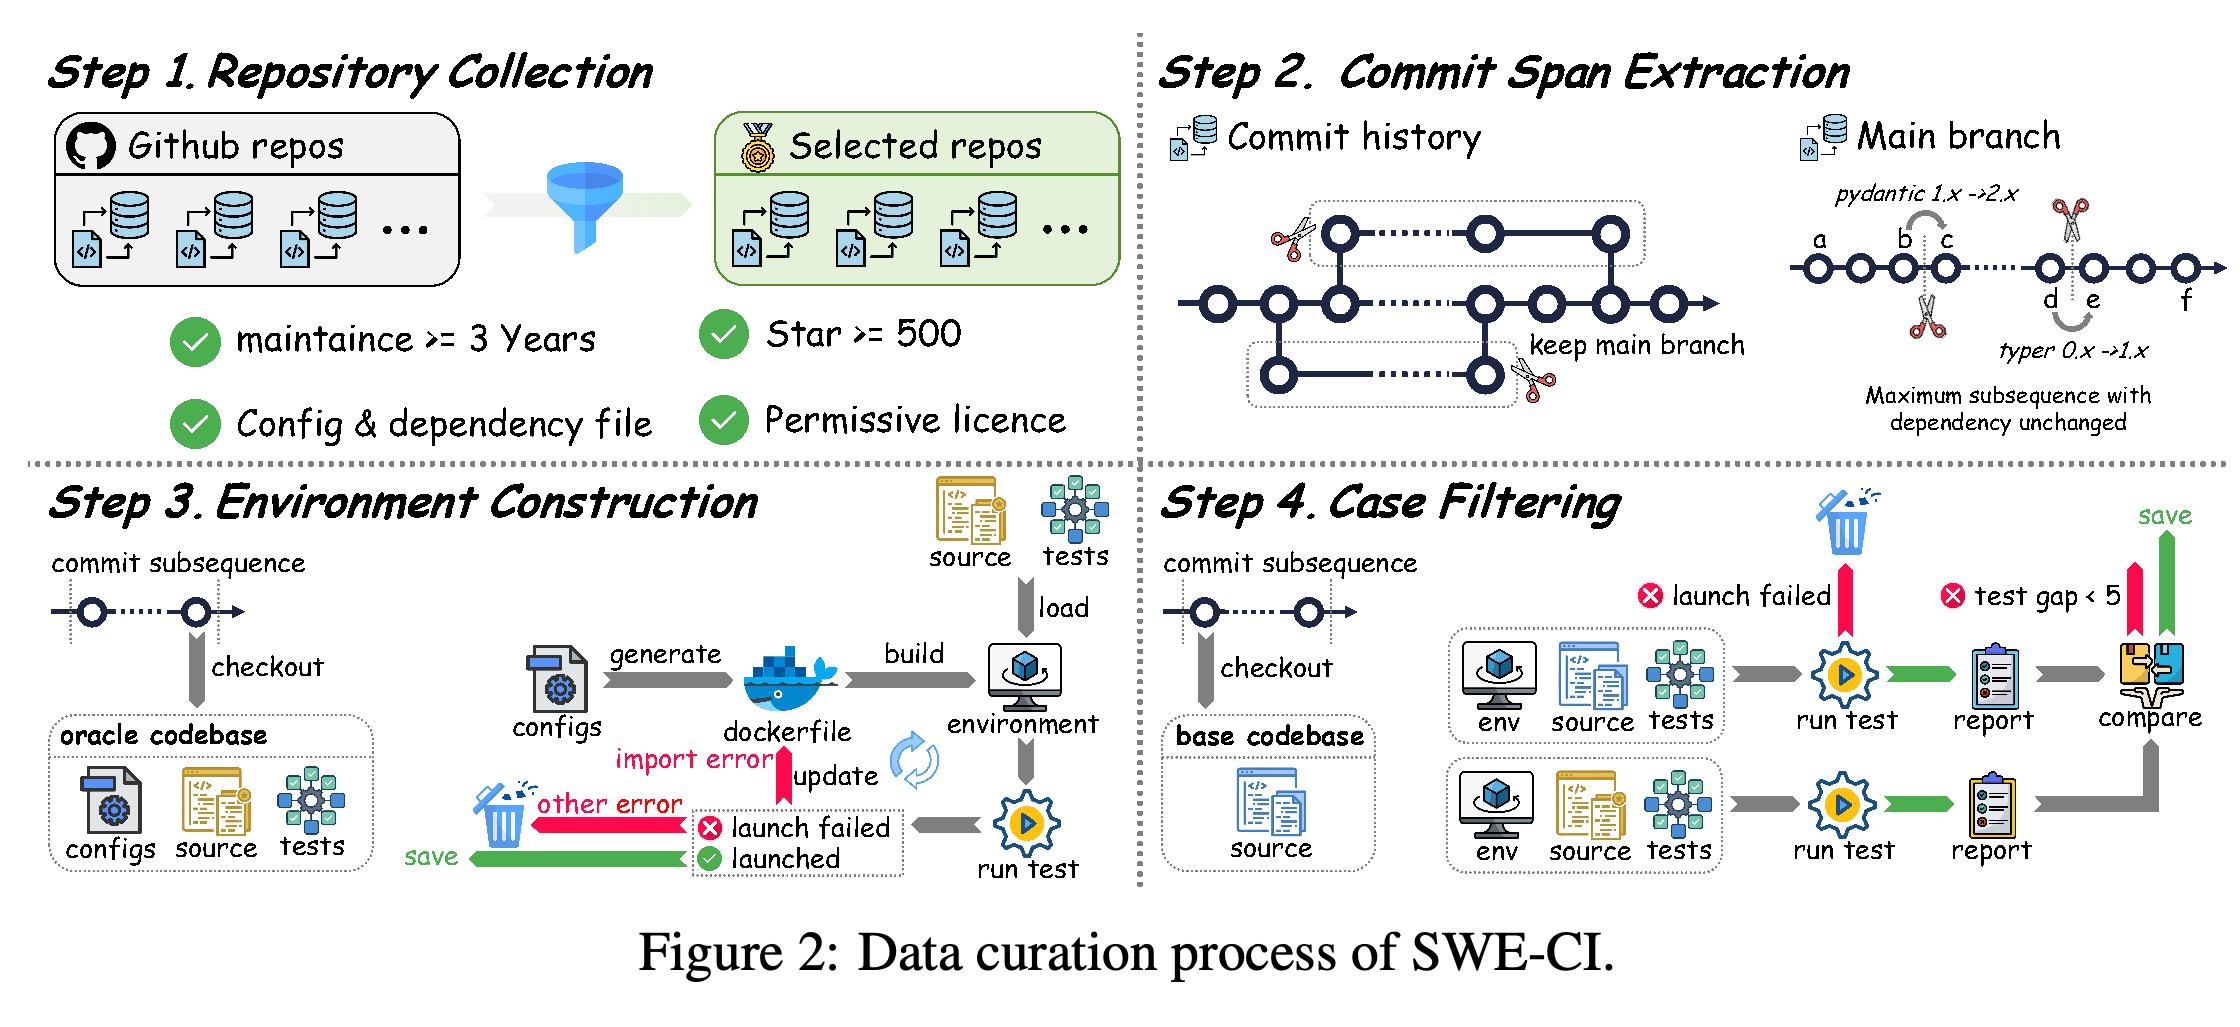
Step 1: Repository Collection retains Python repositories actively maintained for at least three years, with more than 500 stars, configuration and dependency files, unit tests, and a permissive license such as MIT or Apache-2.0. This leaves 4,923 repositories.
Step 2: Commit Span Extraction keeps the main branch and identifies maximal commit subsequences with unchanged dependencies. Their endpoints form candidate base/oracle pairs; discarding pairs with fewer than 1,000 modified lines leaves 8,311 candidates.
- Holding dependencies constant reduces environment incompatibility between endpoints.
- This restriction excludes maintenance spans that cross dependency changes.
Step 3: Environment Construction generates Dockerfiles from oracle configurations and dependencies, then executes oracle tests. Launch failures caused by missing dependencies trigger automatic Dockerfile repair, while failures attributed to other causes lead to exclusion; 1,458 candidate pairs remain.
Step 4: Case Filtering removes pairs whose oracle tests cannot launch against the base codebase or whose passing-test gap is fewer than five. Of the remaining 137 candidates, the authors select the top 100 by time span and intervening commit count.
- The final dataset contains 100 samples from 68 repositories, averaging 233 days and 71 consecutive commits per pair.
- Every final pair includes at least 500 modified source-code lines, excluding test-file changes; this statistic is distinct from the earlier 1,000-line candidate filter.
- Figure 2 shows the filtering and environment-repair pipeline, including comparison of base and oracle reports on the same test suite.
The four-stage pipeline filters repository eligibility, dependency stability, executable environments, and functional distance between endpoints. Missing-dependency launch failures enter a repair loop, while other errors, base launch failures, and test gaps below five remove candidates.
3.2 Dual-agent evaluation protocol
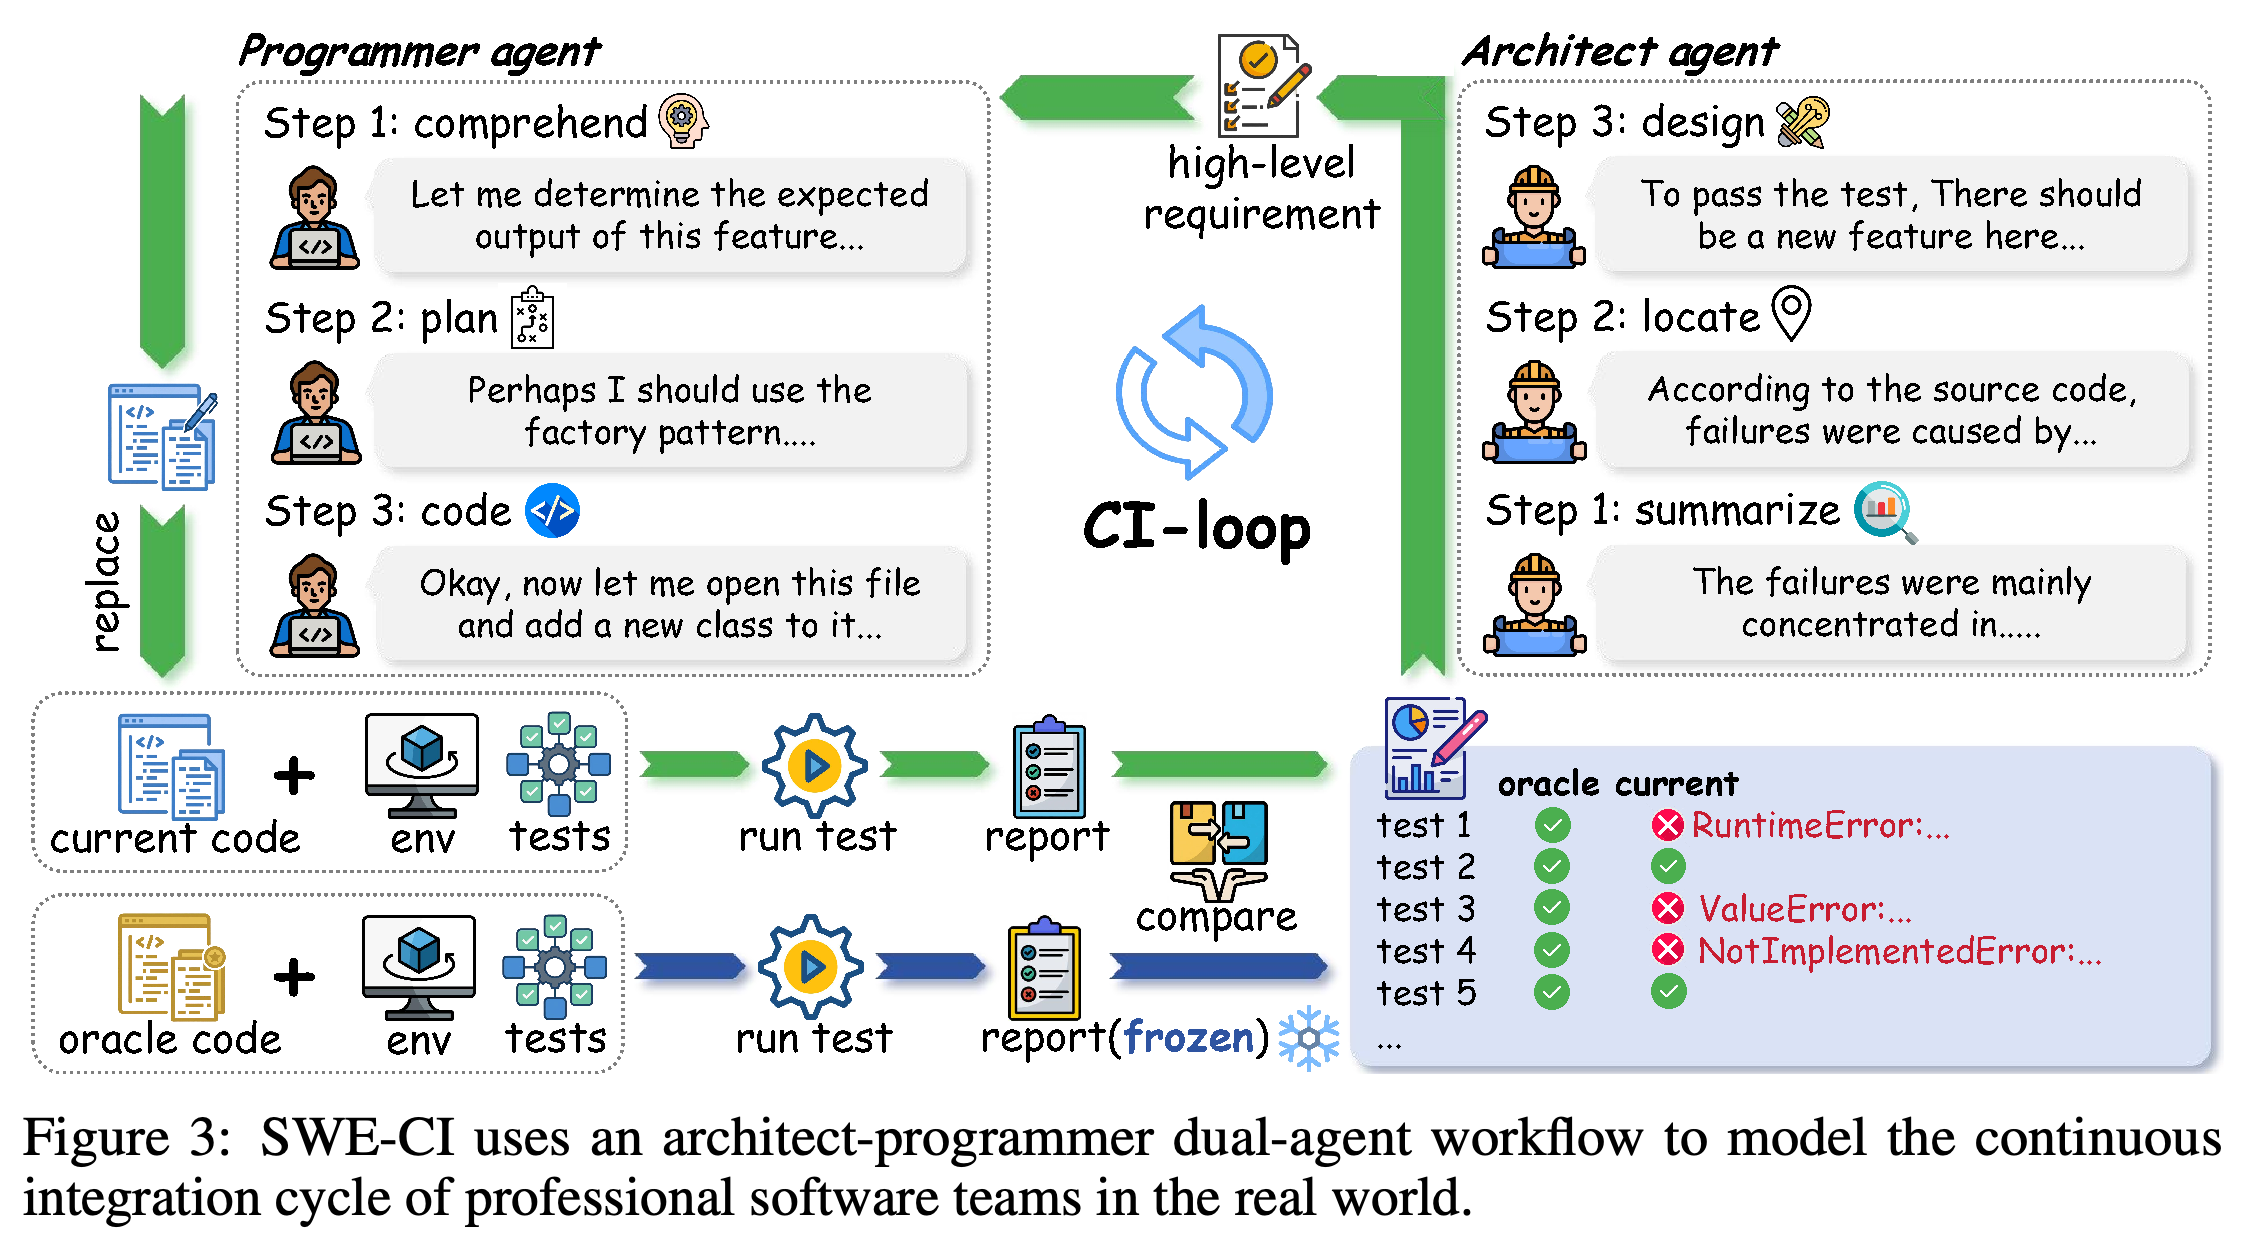
The Architect summarizes failures, locates implementation deficiencies, and designs a high-level requirements document from the current-to-oracle test gap. Each iteration contains no more than five urgent requirements, expressed as expected behavior rather than concrete implementation instructions.
- The Programmer comprehends the requirements, plans their implementation, and edits the codebase.
- The Programmer is driven by the distilled requirement document rather than directly by the complete test gap; the appendix also permits inspection of relevant tests.
- Figure 3 shows external verification feeding the next Architect analysis while the oracle report remains frozen.
External verification compares the current codebase with a frozen oracle report. The Architect converts remaining failures into high-level requirements, and the Programmer modifies the code before the cycle repeats without resetting the repository.
4 Experiments
The experiments examine trajectory performance, sensitivity to temporal weighting, regression behavior, and static code quality. Evaluation covers 20 models from 8 providers with total token consumption exceeding 10 billion.
- The main analyses distinguish functional progress, regression avoidance, and static code quality.
- Additional experiments report complete-task success, average turns, and cumulative best progress.
4.1 Experiment setting
The default harness is iFlow CLI, with pytest and pytest-json-report used for verification and a timeout of 3600 seconds per test run. The protocol allows at most 20 iterations, and the Architect and Programmer use the same underlying model unless otherwise specified.
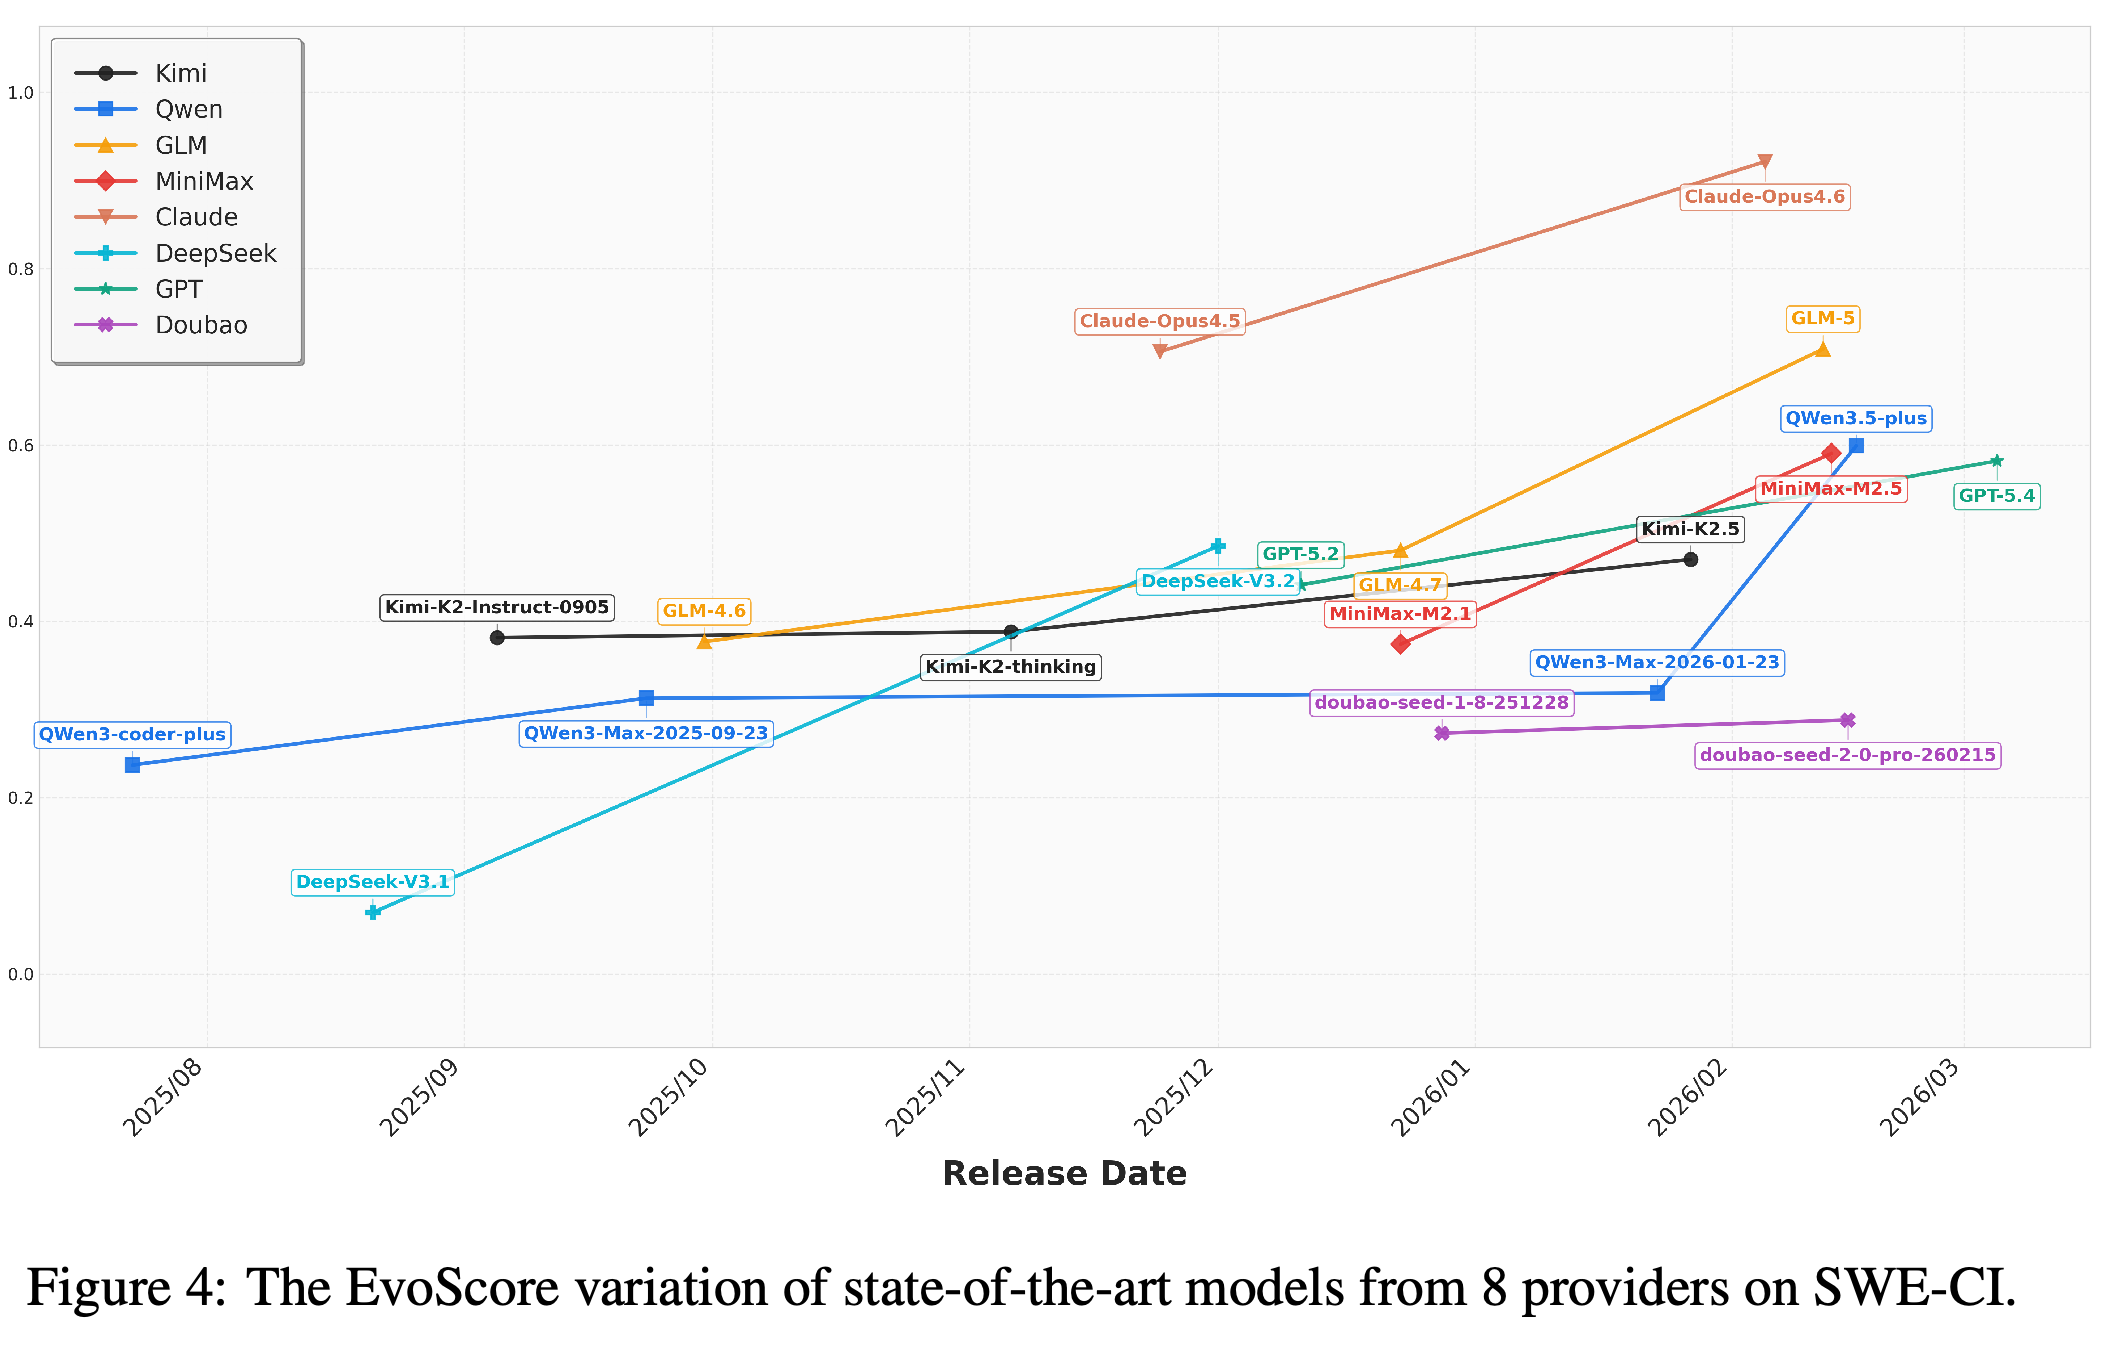
- Figure 4 reports EvoScore with γ = 1.
- The appendix prompts prohibit both agents from actively executing tests; verification is performed by the external system.
- The reported scores characterize the combined workflow rather than an isolated Programmer.
4.2 Maintainability
Observation 1 reports higher EvoScore for newer evaluated models within each provider, with the Claude Opus series leading and GLM-5 also performing strongly. Figure 4 plots these scores against release dates.
- The authors interpret the larger gains among recent releases as accelerating progress in code maintenance capability.
- The comparison is observational and does not isolate training changes or establish a general rate of progress beyond the evaluated models.
EvoScore at γ = 1 rises across the evaluated release sequences within providers, with Claude Opus leading and GLM-5 among the strongest alternatives. The plot shows release-associated performance differences but does not identify their training causes.
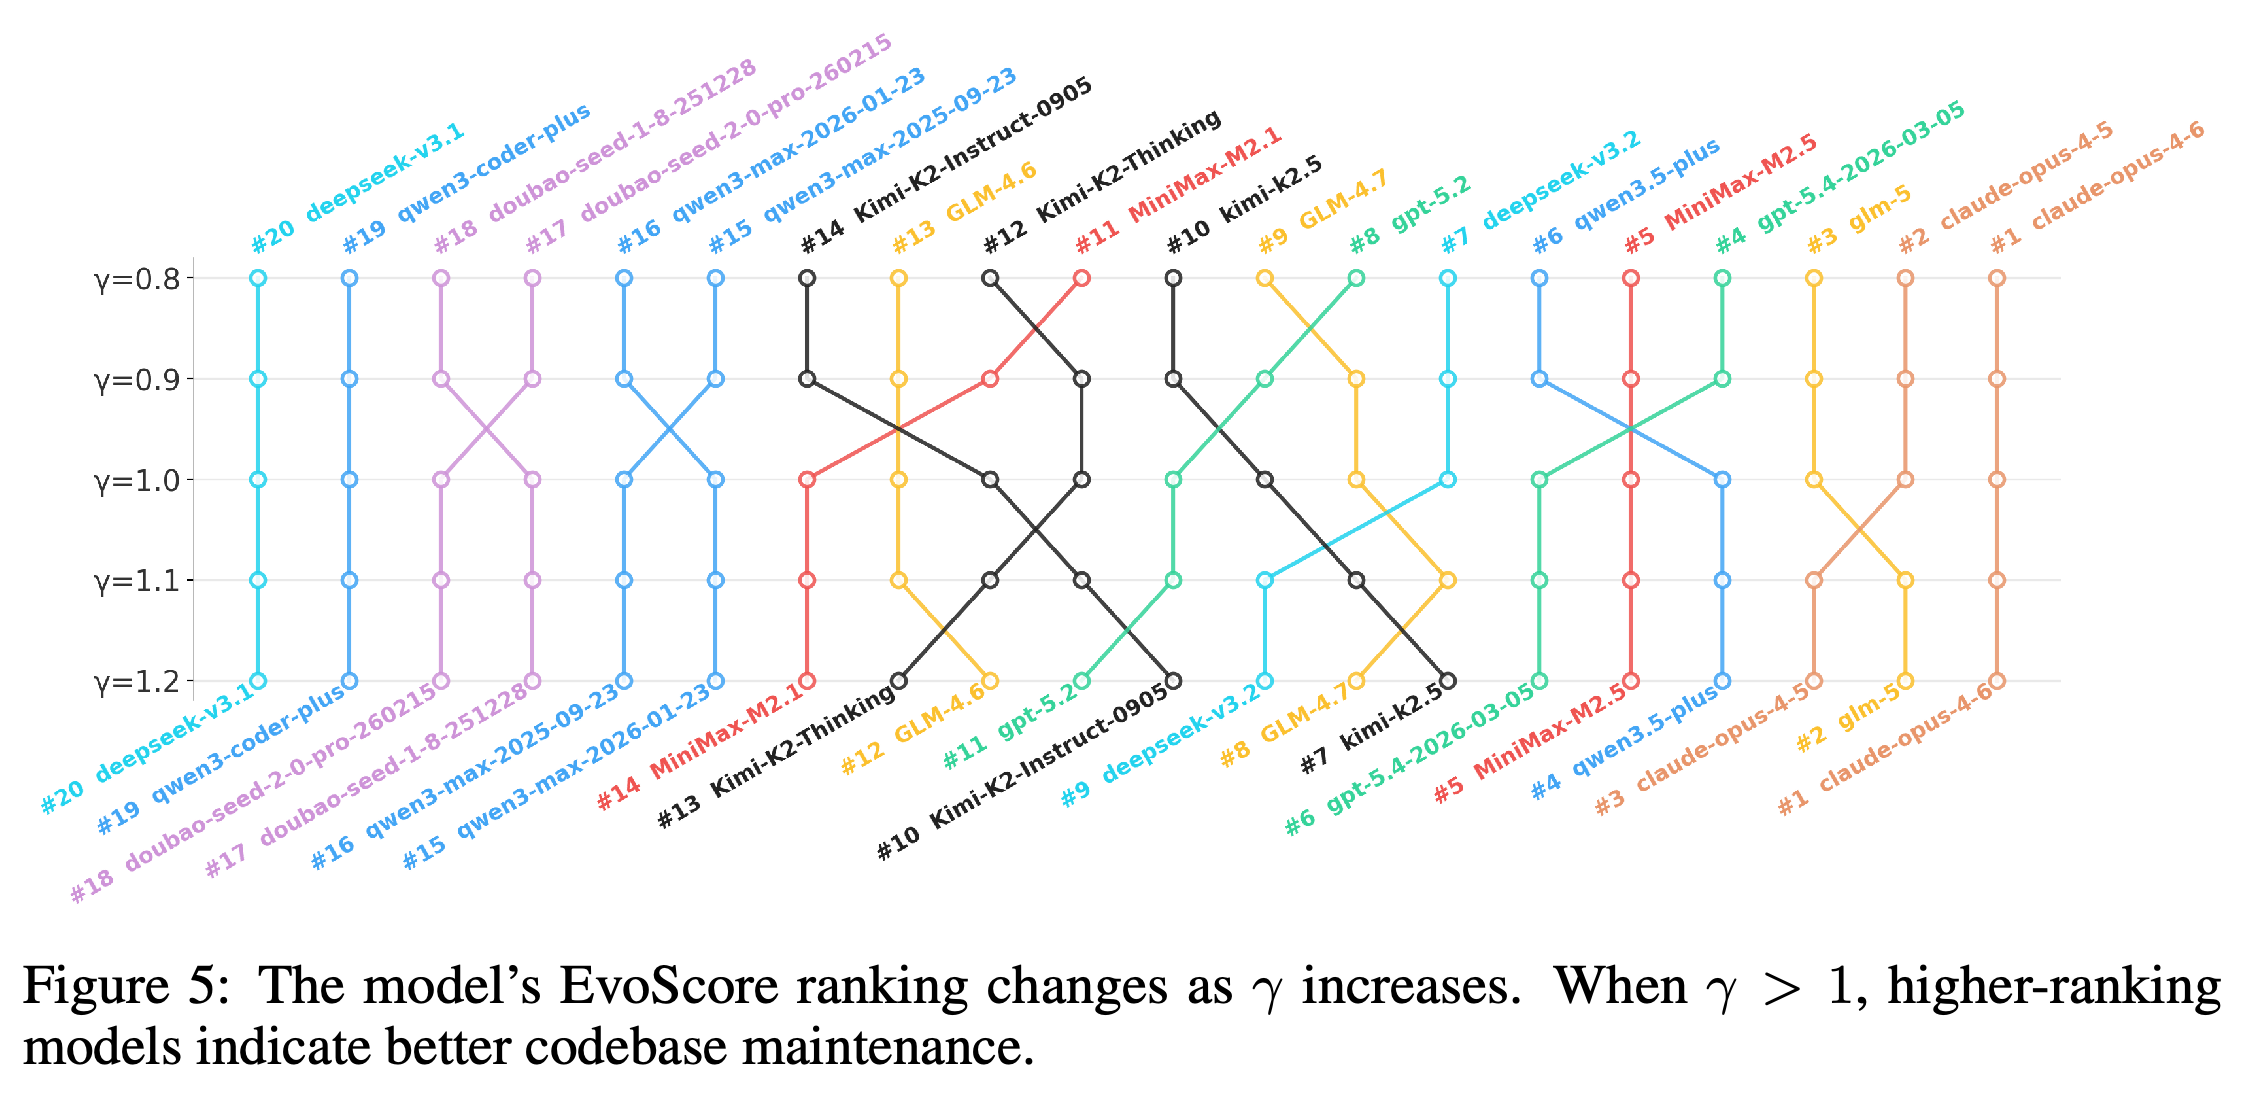
Observation 2 varies γ from 0.8 to 1.2 to examine ranking sensitivity. MiniMax, GPT, and DeepSeek generally decline as later iterations receive more weight, whereas Kimi, GLM, and Qwen generally rise; Doubao and Claude remain comparatively stable.
- Although the main definition specifies γ ≥ 1, the sensitivity experiment also uses γ < 1 to emphasize earlier states.
- Figure 5 shows how reweighting unchanged trajectories affects relative rankings; claude-opus-4-6 remains first at γ = 1.2, while GLM-5 ranks second.
- The proposed link between provider-specific tendencies and training strategies is conjectural.
Rank trajectories across γ = 0.8, 0.9, 1.0, 1.1, and 1.2 show sensitivity to early versus late progress. claude-opus-4-6 remains first throughout, while GLM-5 rises from third to second; several GPT, MiniMax, and DeepSeek models fall in rank as later states receive more weight.
4.3 Regression
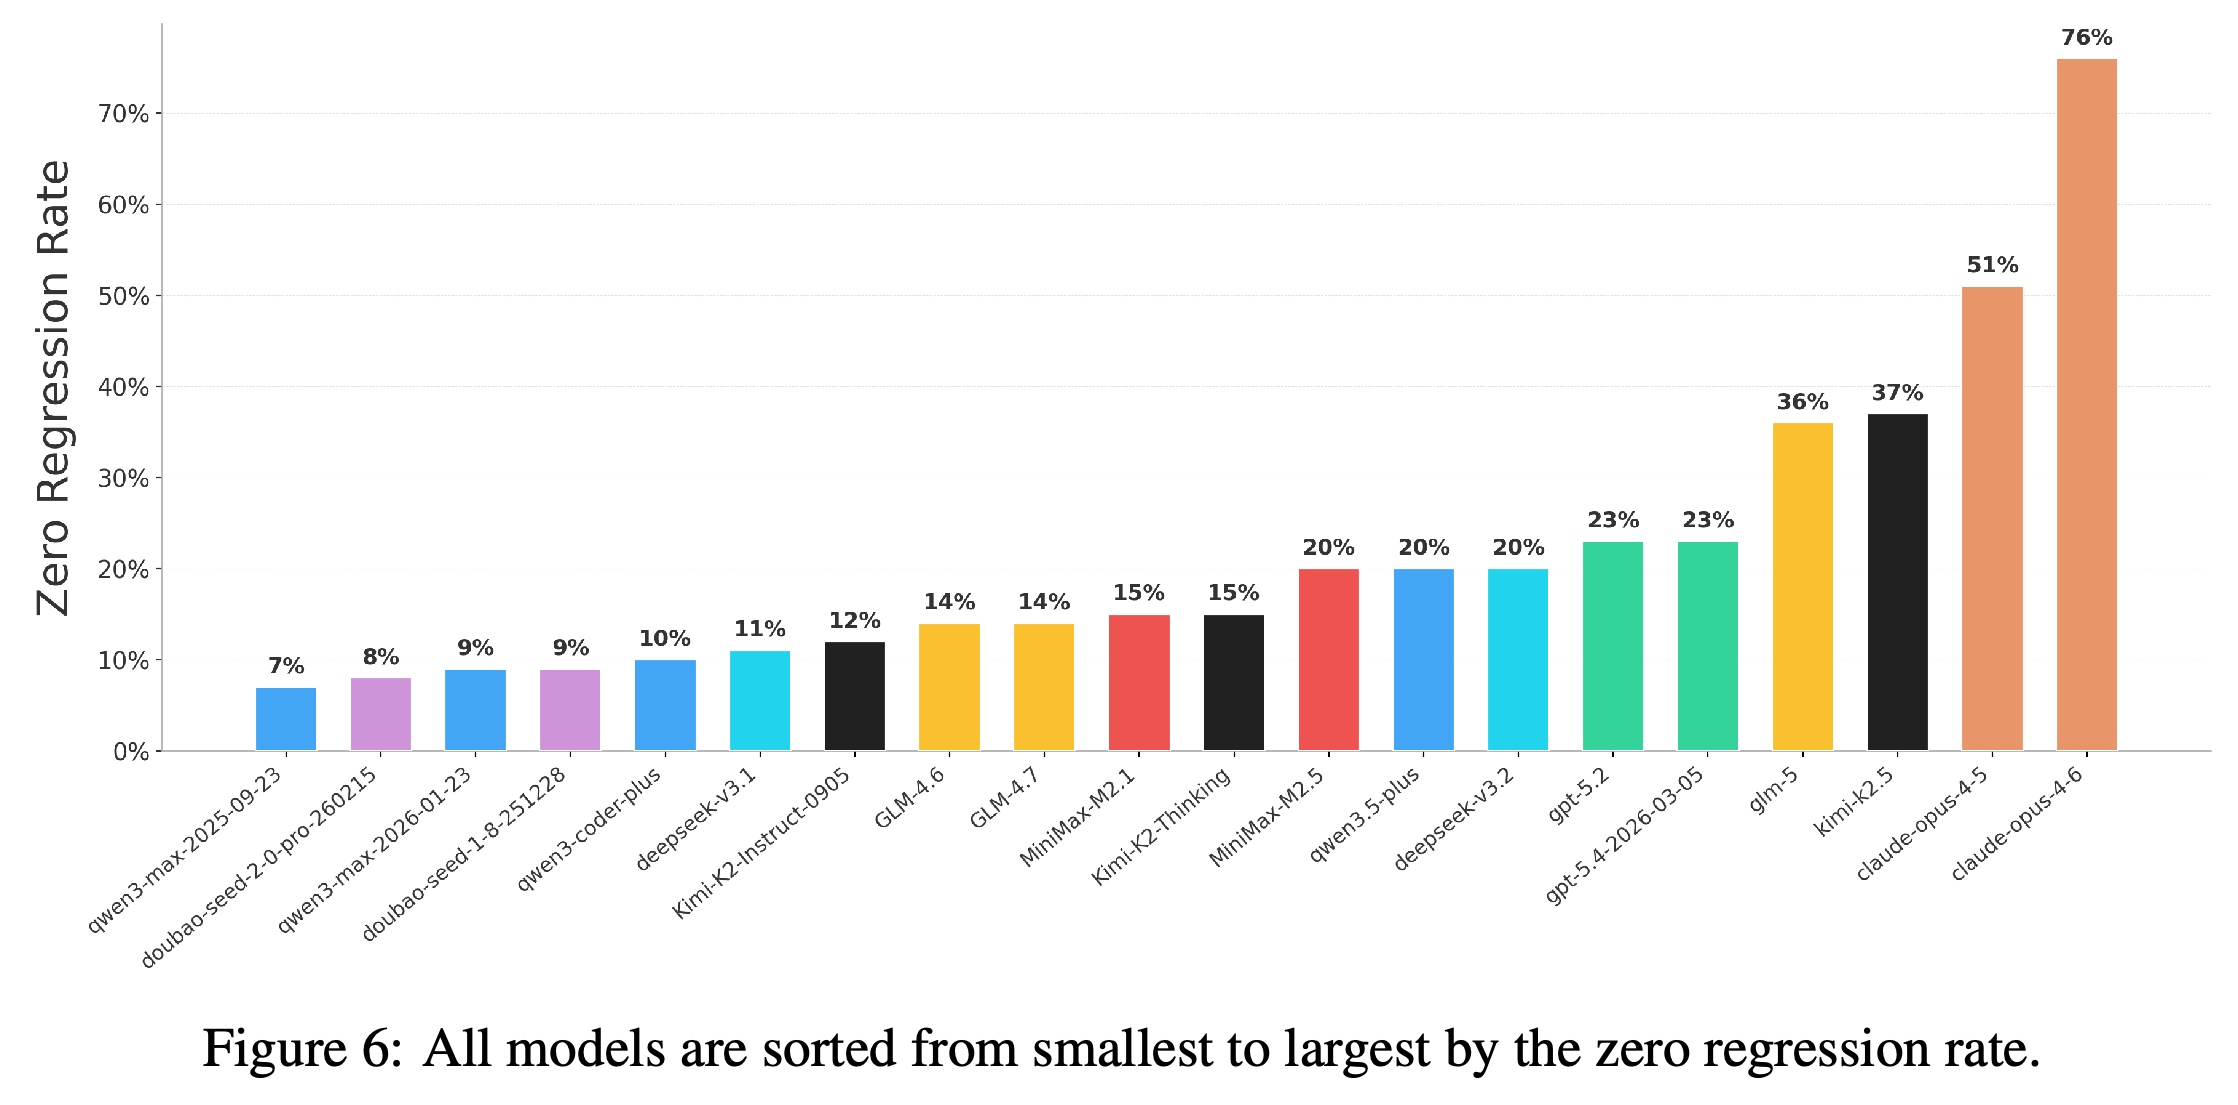
Observation 3 defines zero-regression rate as the fraction of samples with no previously passing test broken anywhere in the maintenance process. Most models score below 0.25; Figure 6 reports 51% for claude-opus-4-5 and 76% for claude-opus-4-6, the only two models above 0.5.
- A regression repaired later still prevents the trajectory from counting as zero-regression.
- GLM-5 and kimi-k2.5 reach 36% and 37%, respectively.
The bars measure whether a complete maintenance trajectory avoids every regression, not whether it ends successfully. claude-opus-4-5 and claude-opus-4-6 reach 51% and 76%, respectively, while most evaluated models remain below 25%.
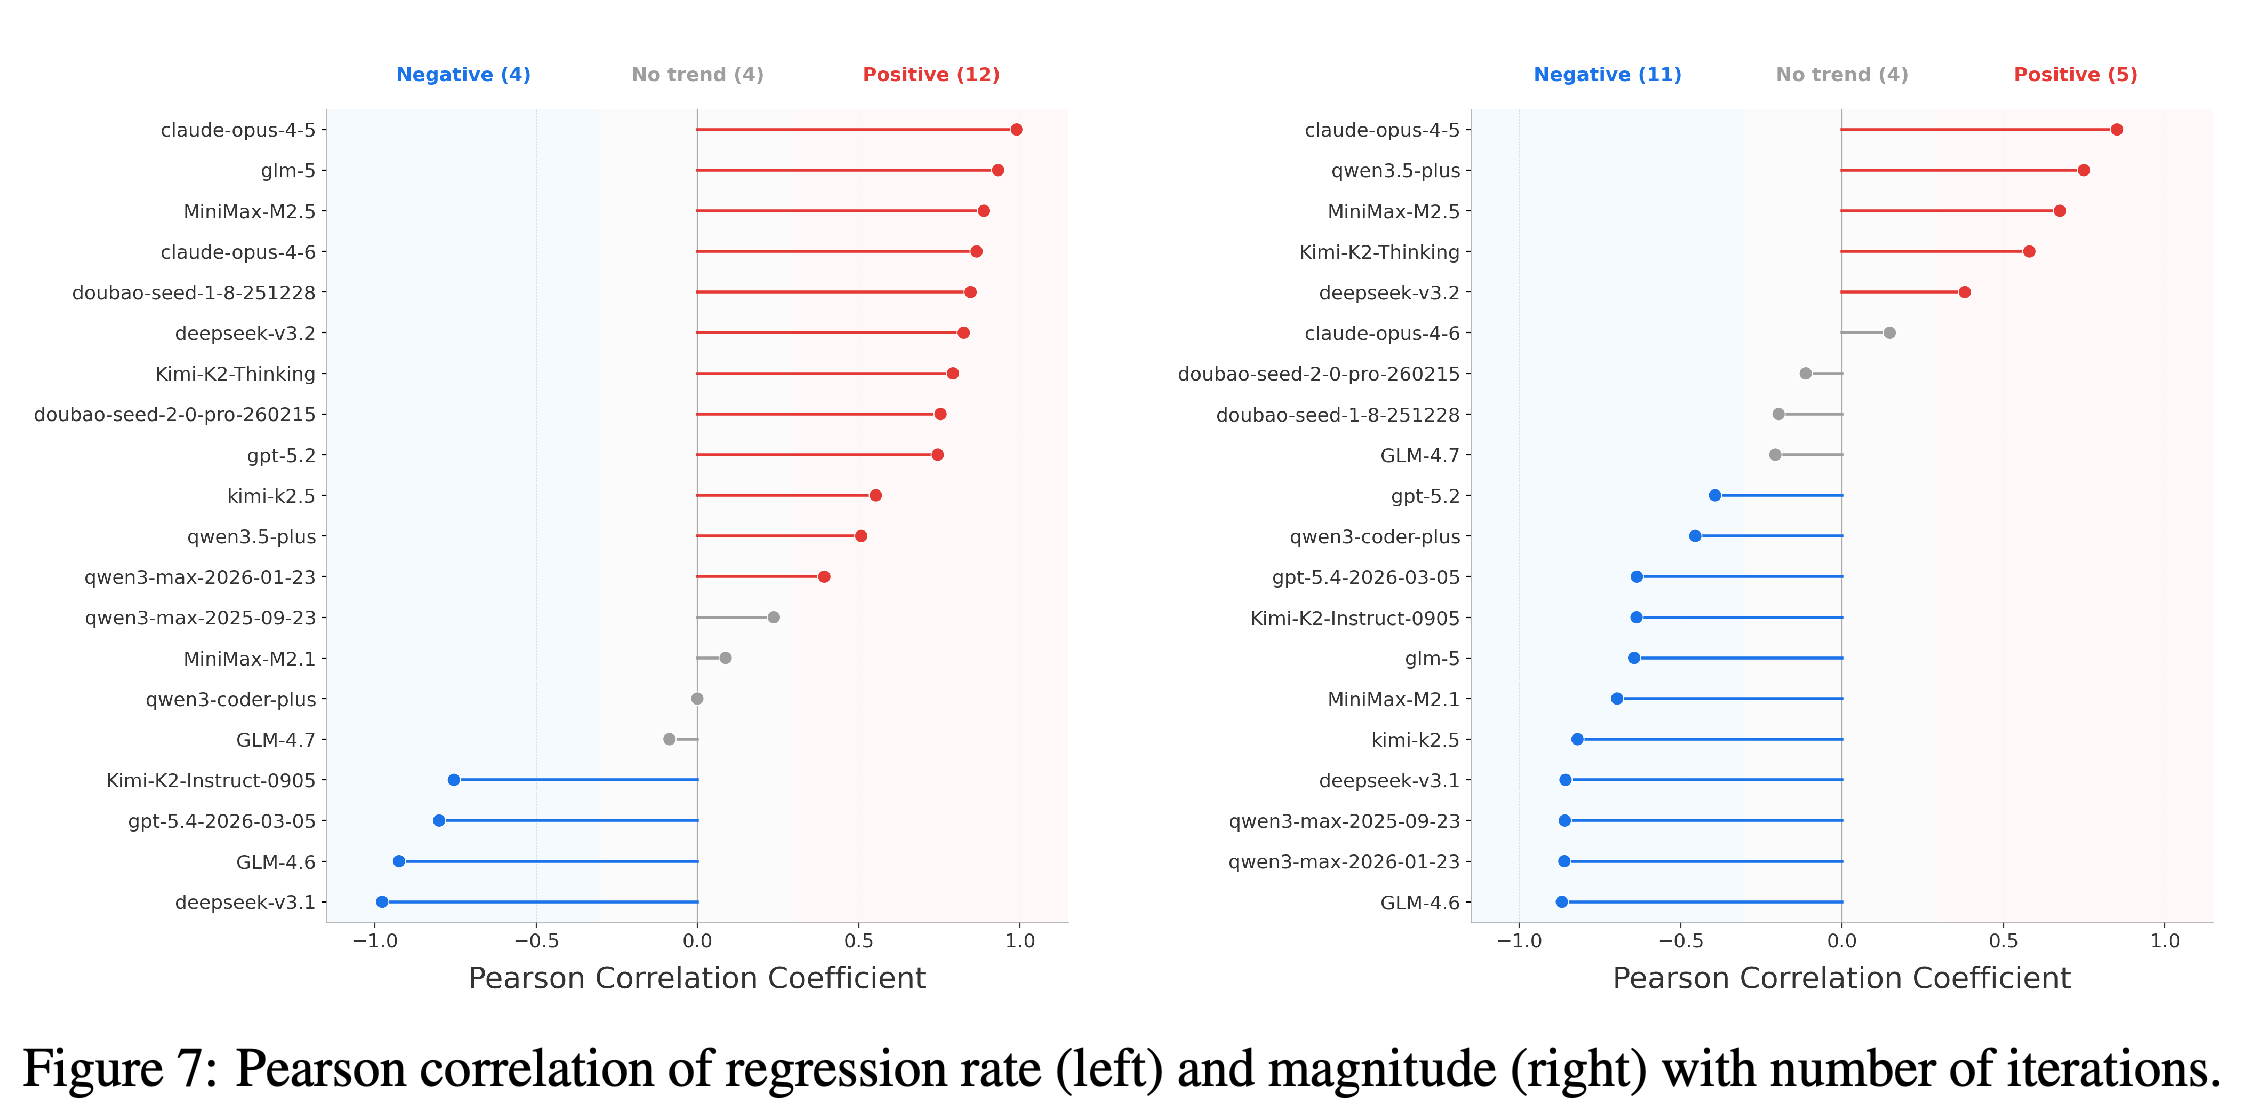
Observation 4 examines Pearson correlations between iteration count and regression rate or magnitude. Figure 7 classifies 12 out of 20 models as positively correlated for regression rate and 11 out of 20 as negatively correlated for regression magnitude.
- These separate model counts support a qualified pattern of more frequent but smaller later regressions, not a uniform trend across all models.
- The authors conjecture that harder remaining requirements prompt more localized trial-and-error changes in later iterations.
- The correlations do not establish that accumulating technical debt causes these trends.
The panels separate regression frequency from magnitude. Twelve models are classified as positively correlated with iteration count for regression rate, and eleven as negatively correlated for magnitude; these are separate counts rather than evidence that the same trend holds uniformly across models.
4.4 Coding style
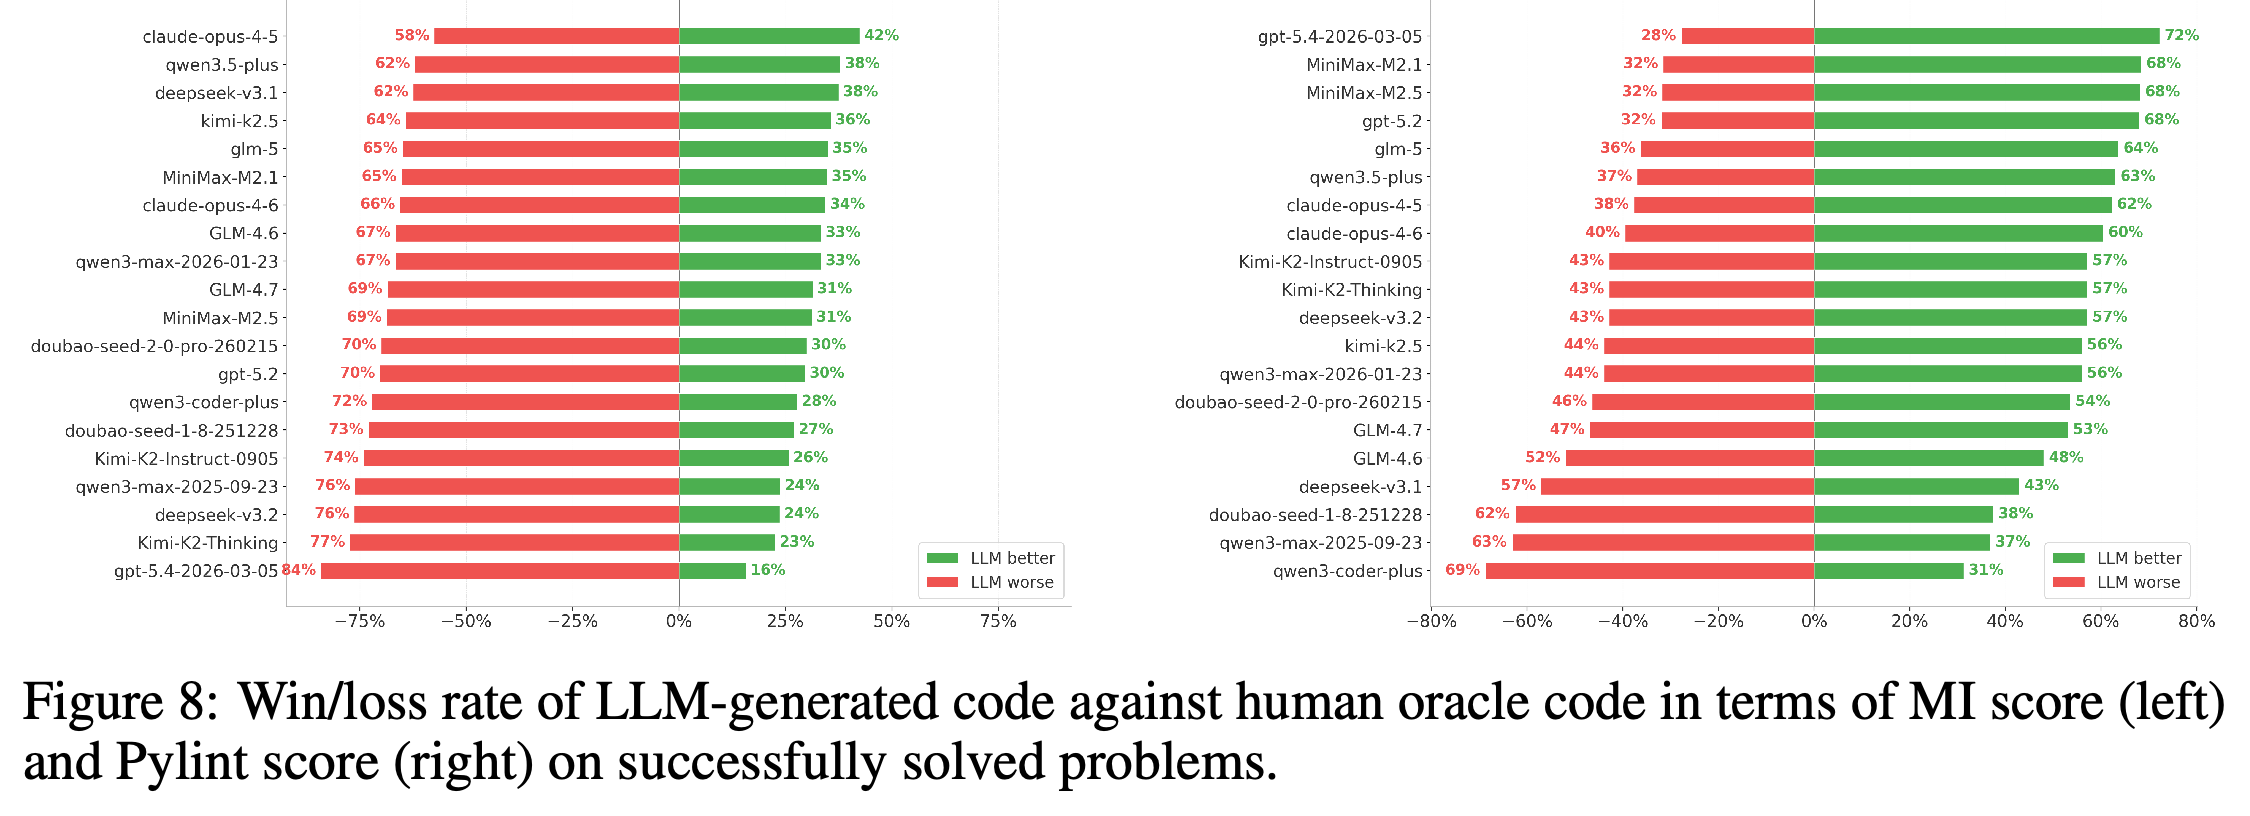
Observation 5 compares agent-generated code with human oracle code only on successfully solved tasks. In Figure 8, 15 out of 20 models have favorable Pylint win/loss comparisons, but all 20 have unfavorable MI score comparisons.
- The paper uses Pylint to assess conventions such as naming and line length, and MI to assess structural indicators including cyclomatic complexity.
- The result shows that favorable scores on coding conventions need not coincide with favorable scores on the selected maintainability metric.
- These are aggregate win/loss tendencies, not evidence that every generated solution has worse MI than its human counterpart.
On successfully solved tasks, every model loses more often than it wins against human oracle code on MI, whereas fifteen models win more often on Pylint. The split distinguishes performance on the selected convention-based and structural code metrics.
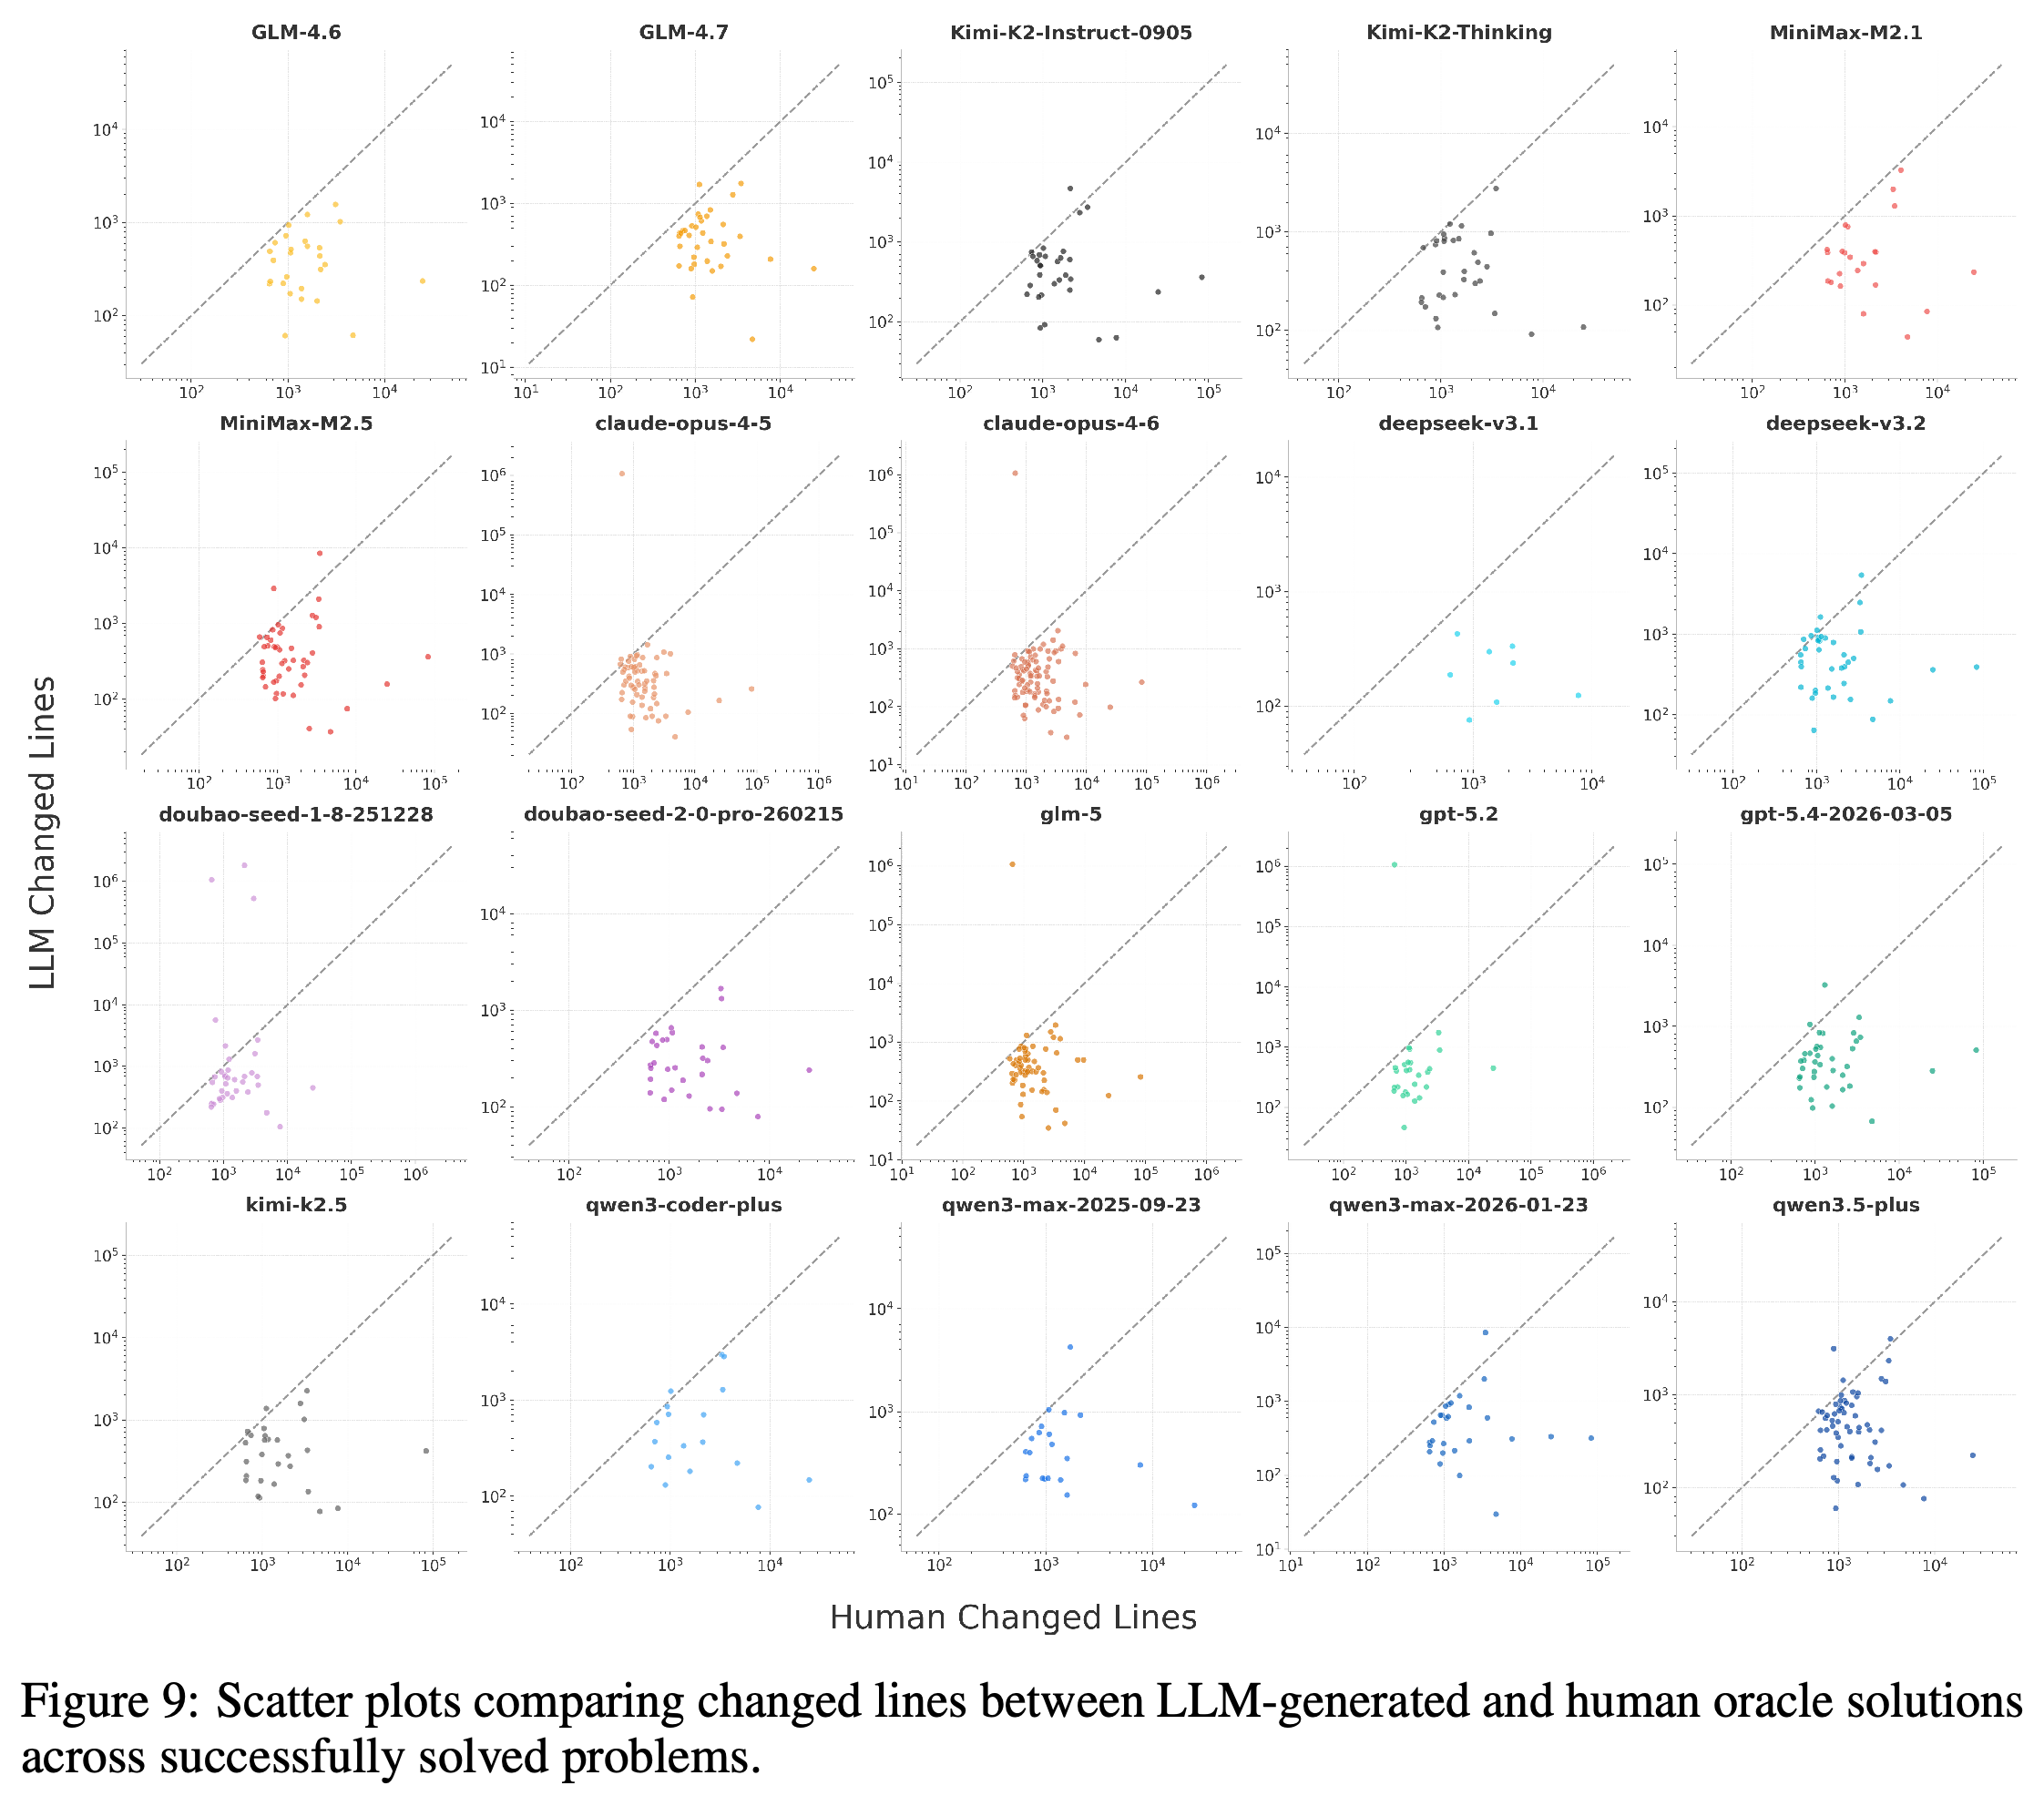
Observation 6 compares changed-line counts on successfully solved tasks. Figure 9 shows points clustering below the equality diagonal across the 20 models, indicating generally smaller agent patches than the historical human changes.
- Together with the MI results, the authors interpret smaller patches as prioritizing immediate functionality over abstraction, encapsulation, and modularization.
- The comparison does not establish that smaller patches cause lower maintainability or that additional human changes were architectural investments.
- The Programmer prompt requests necessary changes and discourages scope expansion, which also conditions the patch-size comparison.
Each panel plots agent changed-line counts against human changed-line counts, with the diagonal marking equality. Points generally fall below it, indicating smaller agent patches on solved tasks; the plot does not establish the purpose or maintainability value of the additional human changes.
5 Conclusion
The conclusion presents SWE-CI as an evaluation of functional correctness under repeated code modification. Regression avoidance remains a substantial weakness across the evaluated models, even when agents ultimately satisfy the target tests.
- The benchmark combines substantial repository evolution spans, a continuing agent-modified codebase, and trajectory-based diagnostics.
- The results describe the tested workflow rather than separating intrinsic model capability from requirement-generation and harness effects.
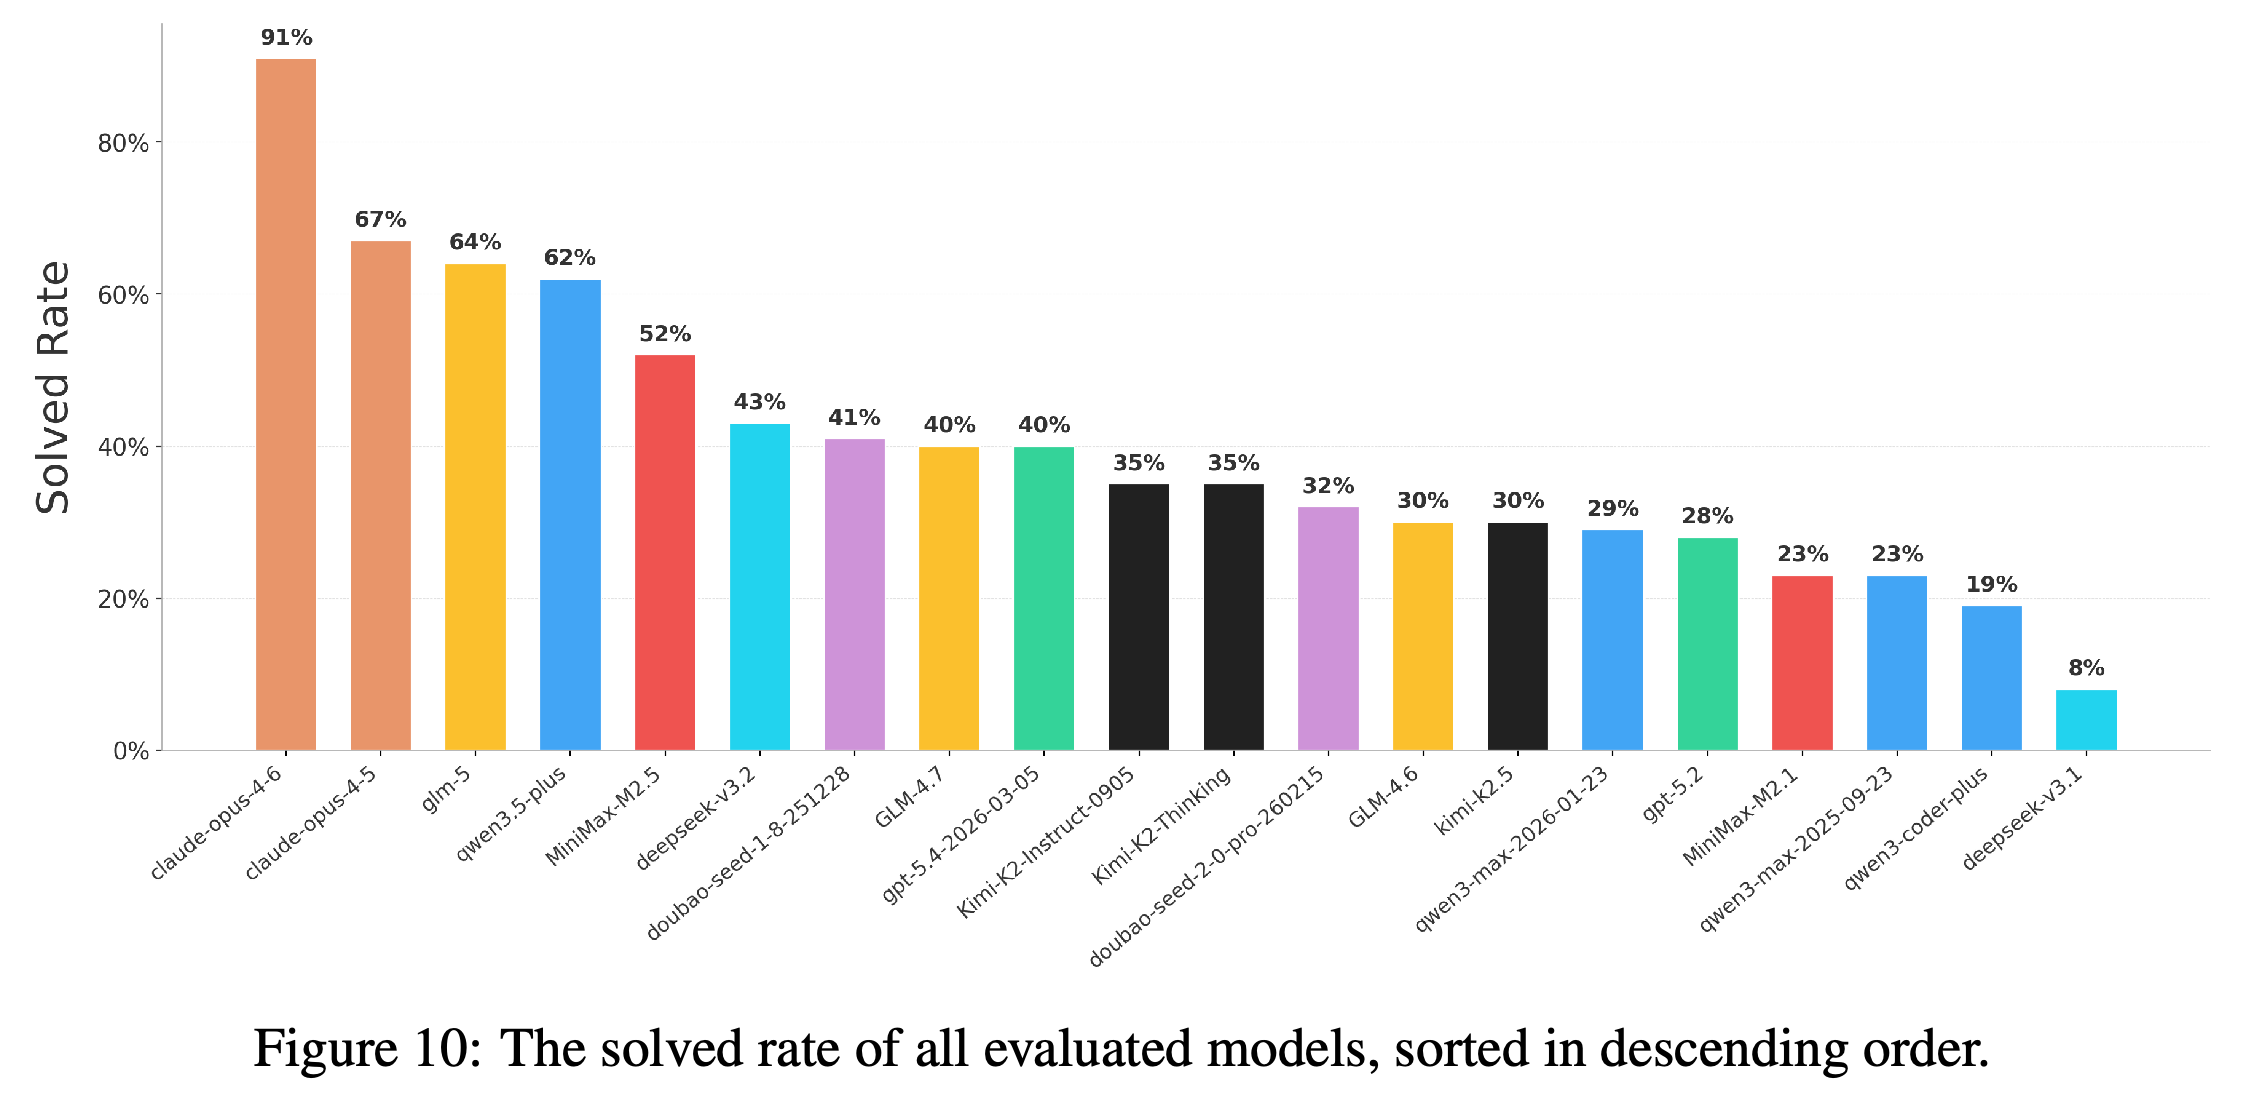
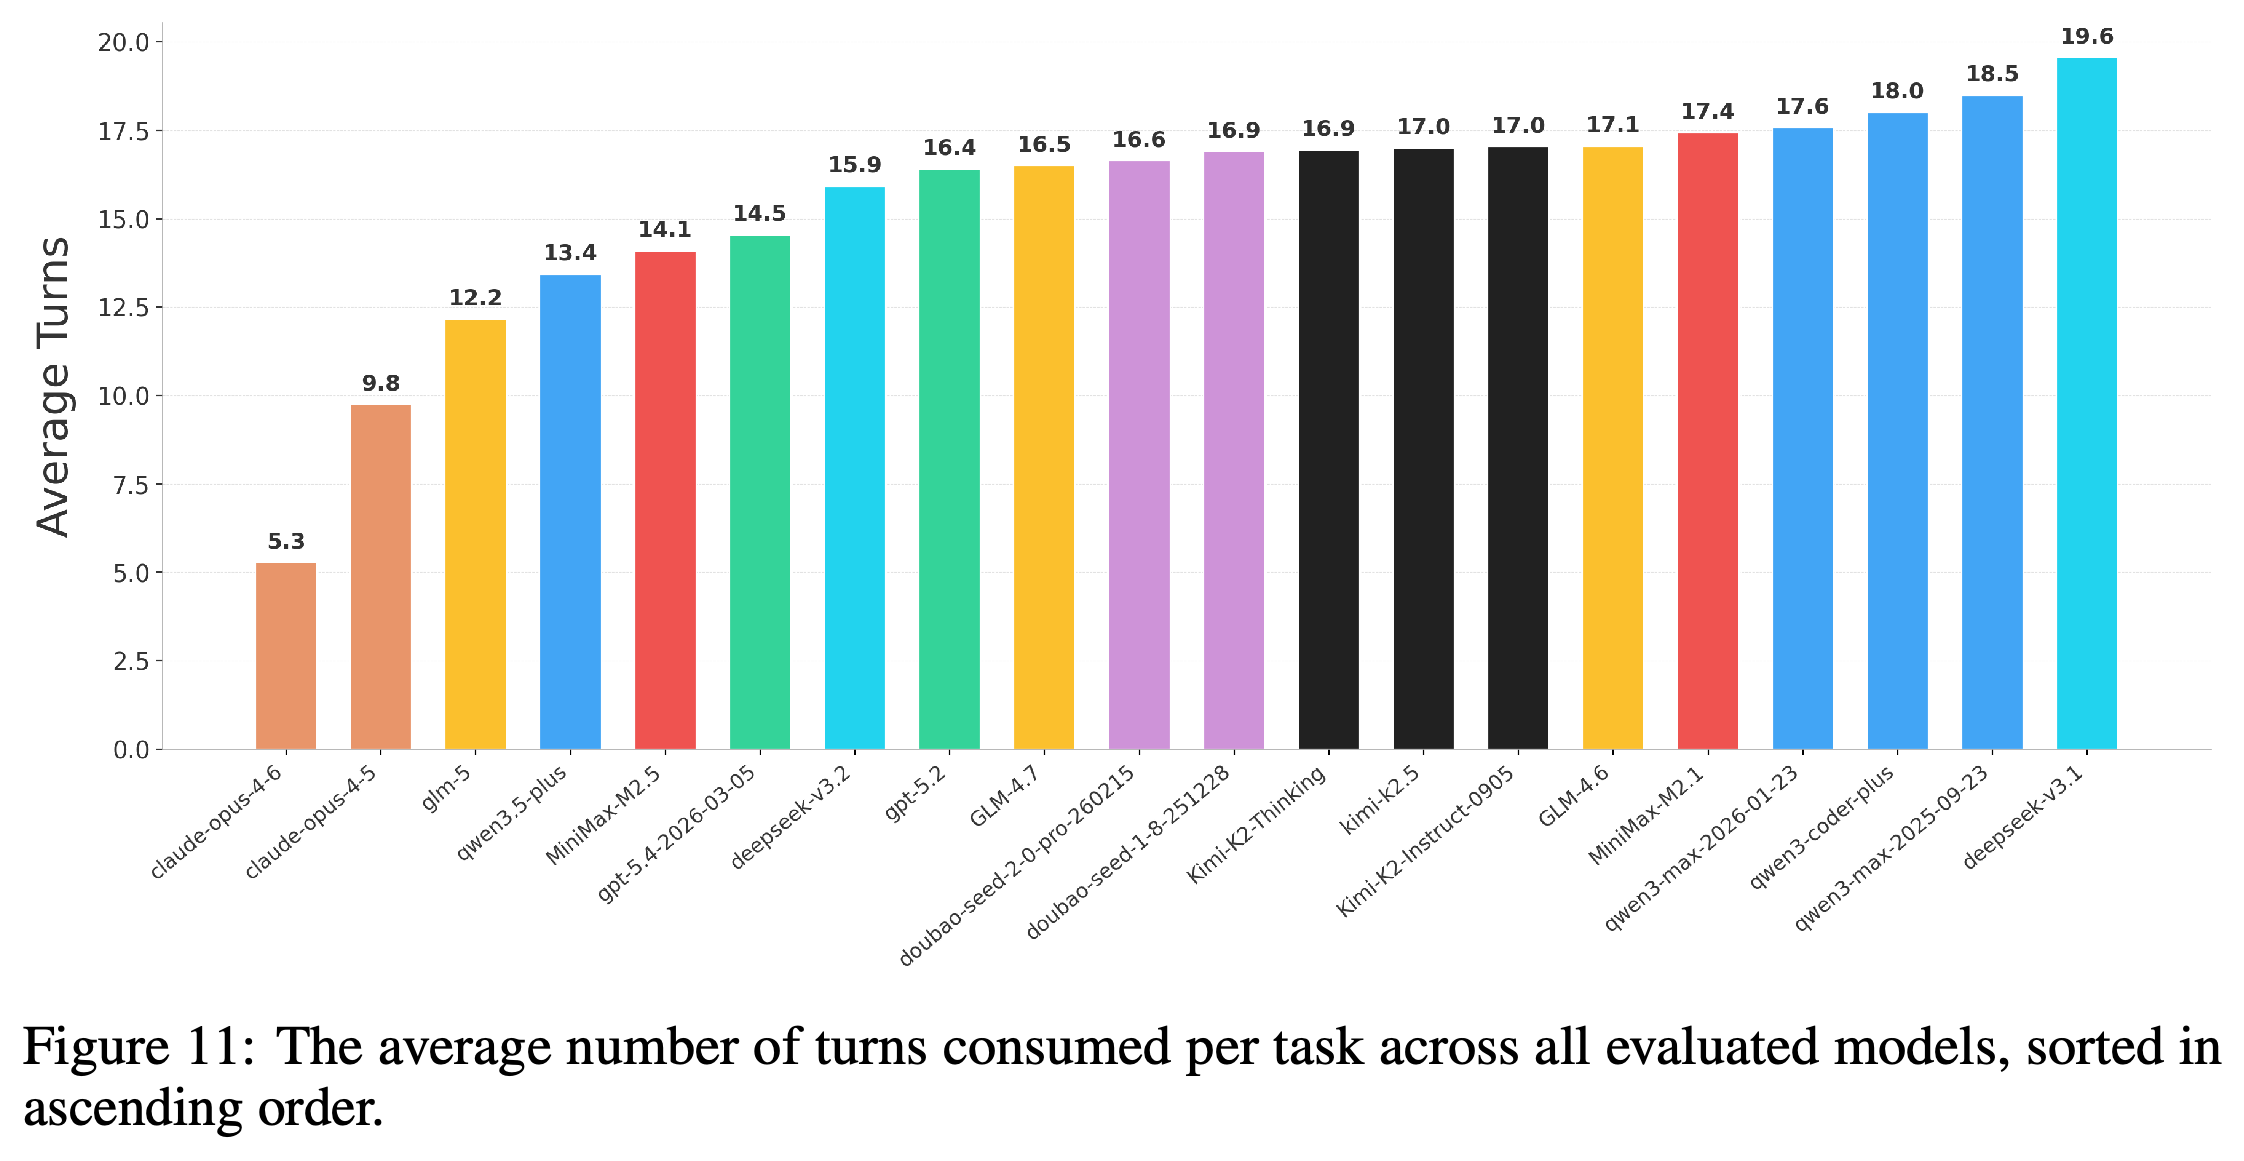
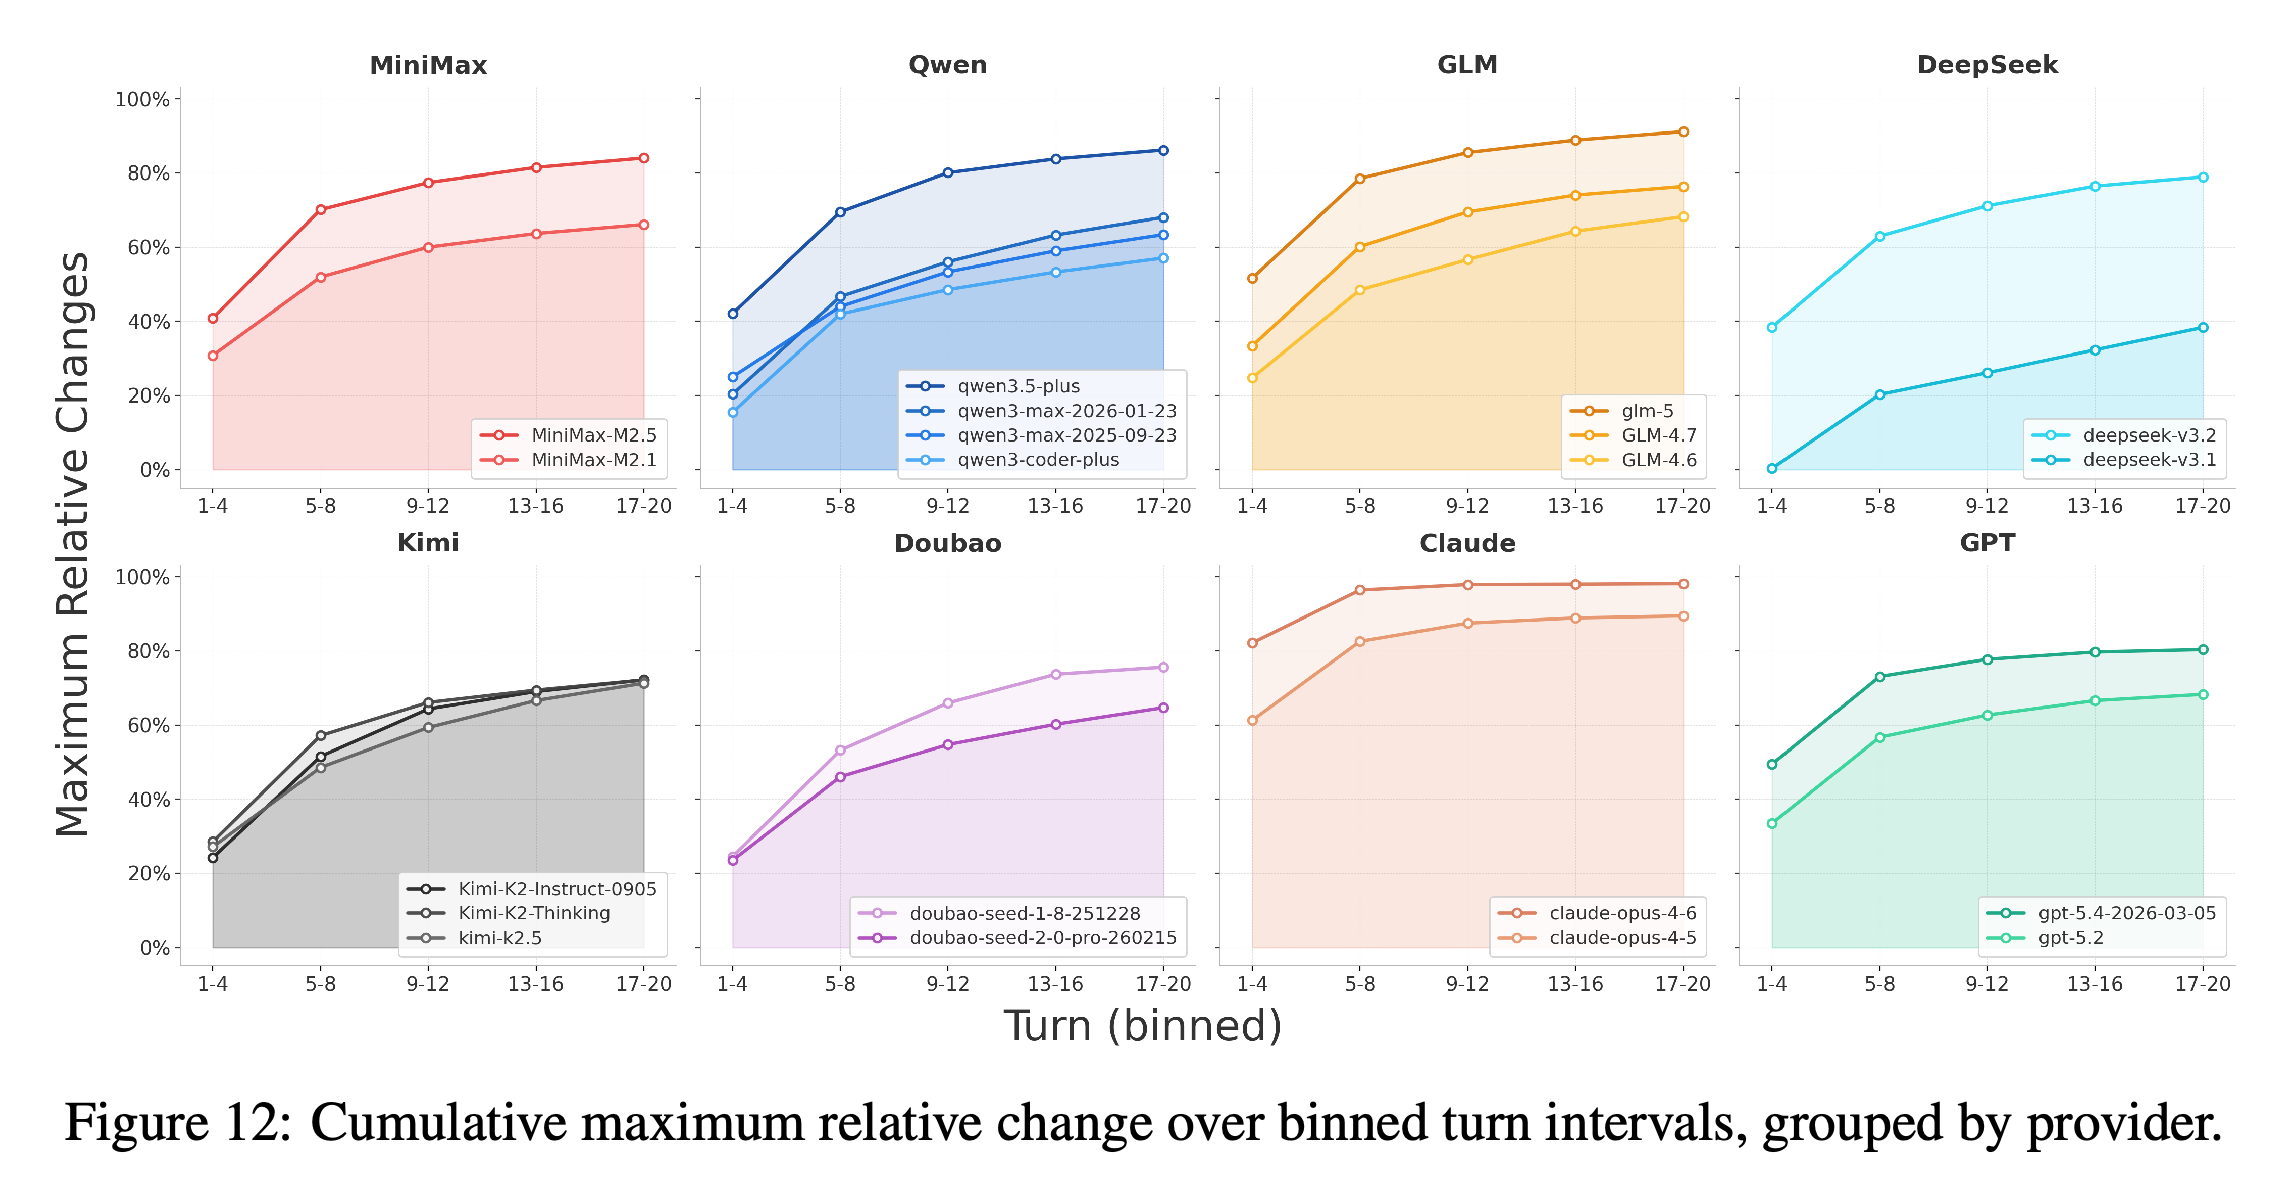
The appendix provides complementary diagnostics: most models solve fewer than 50% of tasks, weaker models tend to approach the 20-turn limit, and cumulative best progress is already substantial in the first 1–4 turns. Figures 10–12 summarize complete-task success, turn consumption, and progress over successive turn bins.
- Figure 10 reports solved rates of 91% for claude-opus-4-6, 67% for claude-opus-4-5, 64% for glm-5, and 62% for qwen3.5-plus.
- Figure 11 reports 5.3 average turns for claude-opus-4-6 versus 19.6 for deepseek-v3.1.
- Figure 12 uses cumulative maxima, so its curves cannot decrease and do not display temporary regressions.
Complete-task success ranges from 91% for claude-opus-4-6 to 8% for deepseek-v3.1. Only five models exceed 50%, showing that partial progress on this benchmark often falls short of fully recovering the oracle's tested functionality.
Average turn consumption ranges from 5.3 for claude-opus-4-6 to 19.6 for deepseek-v3.1 under the 20-turn cap. Stronger models often finish earlier, but the cross-model comparison does not measure the benefit of extending the budget for a fixed model.
Provider-grouped curves show substantial early cumulative progress, further gains in subsequent bins, and generally smaller increments toward the end. Because the statistic is a cumulative maximum, it conceals temporary deterioration and must be interpreted alongside the regression analyses.
Appendix
- A Related Work reviews function-level code generation, repository-level software engineering, long-horizon and evolution-aware evaluation, and software maintainability research. It compares SWE-CI with InterCode, Commit0, LongCLI-Bench, SWE-Bench-CL, and SWE-EVO, positioning its focus as the cumulative consequences of repeated development on the same agent-modified codebase.
- B Additional Experiments adds three diagnostics. B.1 Solved rate measures the fraction of tasks whose requirements are fully satisfied at the end; rankings largely align with EvoScore, and most models remain below 50%. The paper associates solved rate with (\gamma\to\infty), but the limit of the stated EvoScore formula is final Normalized Change, not a binary complete-task success indicator.
- B.2 Average turns shows that stronger models often finish earlier, while weaker models approach the 20-turn limit. B.3 Maximum relative changes plots cumulative best progress in turn bins 1–4, 5–8, 9–12, 13–16, and 17–20; the authors report large early gains and slower subsequent improvement. Neither analysis tests whether extending a fixed model’s iteration budget beyond 20 would help.
- C Prompts provides System Prompt for Architect Agent and System Prompt for Programmer Agent. The Architect inspects /app/non-passed/summary.jsonl, relevant tests, and source code, then writes 1 to 5 requirements to /app/requirement.xml with location, description, contract, and acceptance fields; its permitted edits are limited to that document.
- The Programmer reads /app/requirement.xml, inspects relevant code and optionally tests, and edits source files under /app/code/ while leaving /app/code/tests/ and the requirement document unchanged. Both agents are prohibited from actively running tests, and the Programmer is instructed to make only necessary changes rather than broaden the development scope.
Brief Thoughts
Endpoint success and trajectory stability provide different information: claude-opus-4-6 solves 91% of tasks but avoids all regressions on 76%. A final pass/fail score alone would omit the regressions revealed by the continuing-codebase evaluation.
EvoScore measures progress under repeated modification, not a causal estimate of maintainability. Requirements are generated from a fixed target test suite rather than independently arriving future requests, and the same model usually performs both requirement analysis and implementation. The unchanged-dependency filter and Python-only dataset narrow the maintenance scenarios represented. Static code comparisons cover successfully solved tasks, not all attempted solutions. The paper does not report confidence intervals or a controlled ablation separating Architect, Programmer, and harness contributions.
The MI and patch-size results do not establish that concise agent code sacrifices maintainability. Historical human changes span a broader development episode, while the Programmer prompt favors minimal necessary edits; both conditions can affect the comparison independently of architectural ability.