


KARL: Knowledge Agents via Reinforcement Learning | Summary
05 Mar 2026 | Paper Review Search Agents Reinforcement Learning Synthetic Data Test-Time ScalingContents
- Summary
- 1 Introduction
- 2 KARLBench
- 3 Agent Harness
- 4 Training a Knowledge Agent via Reinforcement Learning (KARL)
- 5 Scaling KARL via Test-time Compute
- 6 Agent Infrastructure
- 7.1 Evaluation and Training Set
- 7.2 Training Data Synthesis
- 7.3 Training Experiments
- 7.4 Test-Time Compute Experiments
- 8.1 Quantitative Behavioral Analysis
- 8.2 Qualitative Case Studies
- 9 Conclusion
- Appendix
- Brief Thoughts
This article explains the key points of KARL: Knowledge Agents via Reinforcement Learning.
- 2026-03-05 (arXiv)
- Chang, Jonathan D., Drozdov, Andrew, Toshniwal, Shubham, Oertell, Owen, Trott, Alexander, Portes, Jacob, Gupta, Abhay, Koppol, Pallavi, Baheti, Ashutosh, Kulinski, Sean, et al.
- Databricks AI Research
- Paper
Summary
- KARL: Knowledge Agents via Reinforcement Learning studies grounded reasoning over closed document collections. It introduces KARLBench, covering six search regimes, and post-trains GLM 4.5 Air using corpus-grounded synthetic tasks and iterative large-batch off-policy reinforcement learning.
- KARL jointly trains search queries, answer generation, and context compression on BrowseComp-Plus and TREC-Biogen; four other tasks are excluded from its RL training. Its KARLBench score rises from the base model’s 52.6 to 58.9 without additional test-time compute, reaches 67.5 with 10 parallel rollouts—matching Claude Opus 4.6—and reaches 68.1 with 20 rollouts.
- Compression swaps and retrieval-conditioned trajectory analyses support improvements in context management and evidence use, not retrieval alone. The results are specific to a vector-search-only harness, and numerical-reasoning failures, harmful compression, LLM-based grading, and inconsistent filtering descriptions limit claims about broader enterprise reliability.
1 Introduction
Grounded reasoning requires information outside model parameters, including proprietary enterprise knowledge. The paper argues that success on one search benchmark does not establish competence in constraint satisfaction, report synthesis, numerical reasoning, exhaustive retrieval, or procedural explanation; KARLBench and heterogeneous RL training address this evaluation and training gap.
- The system combines agentic task synthesis, OAPL post-training, a shared retrieval harness, and parallel inference-time computation.
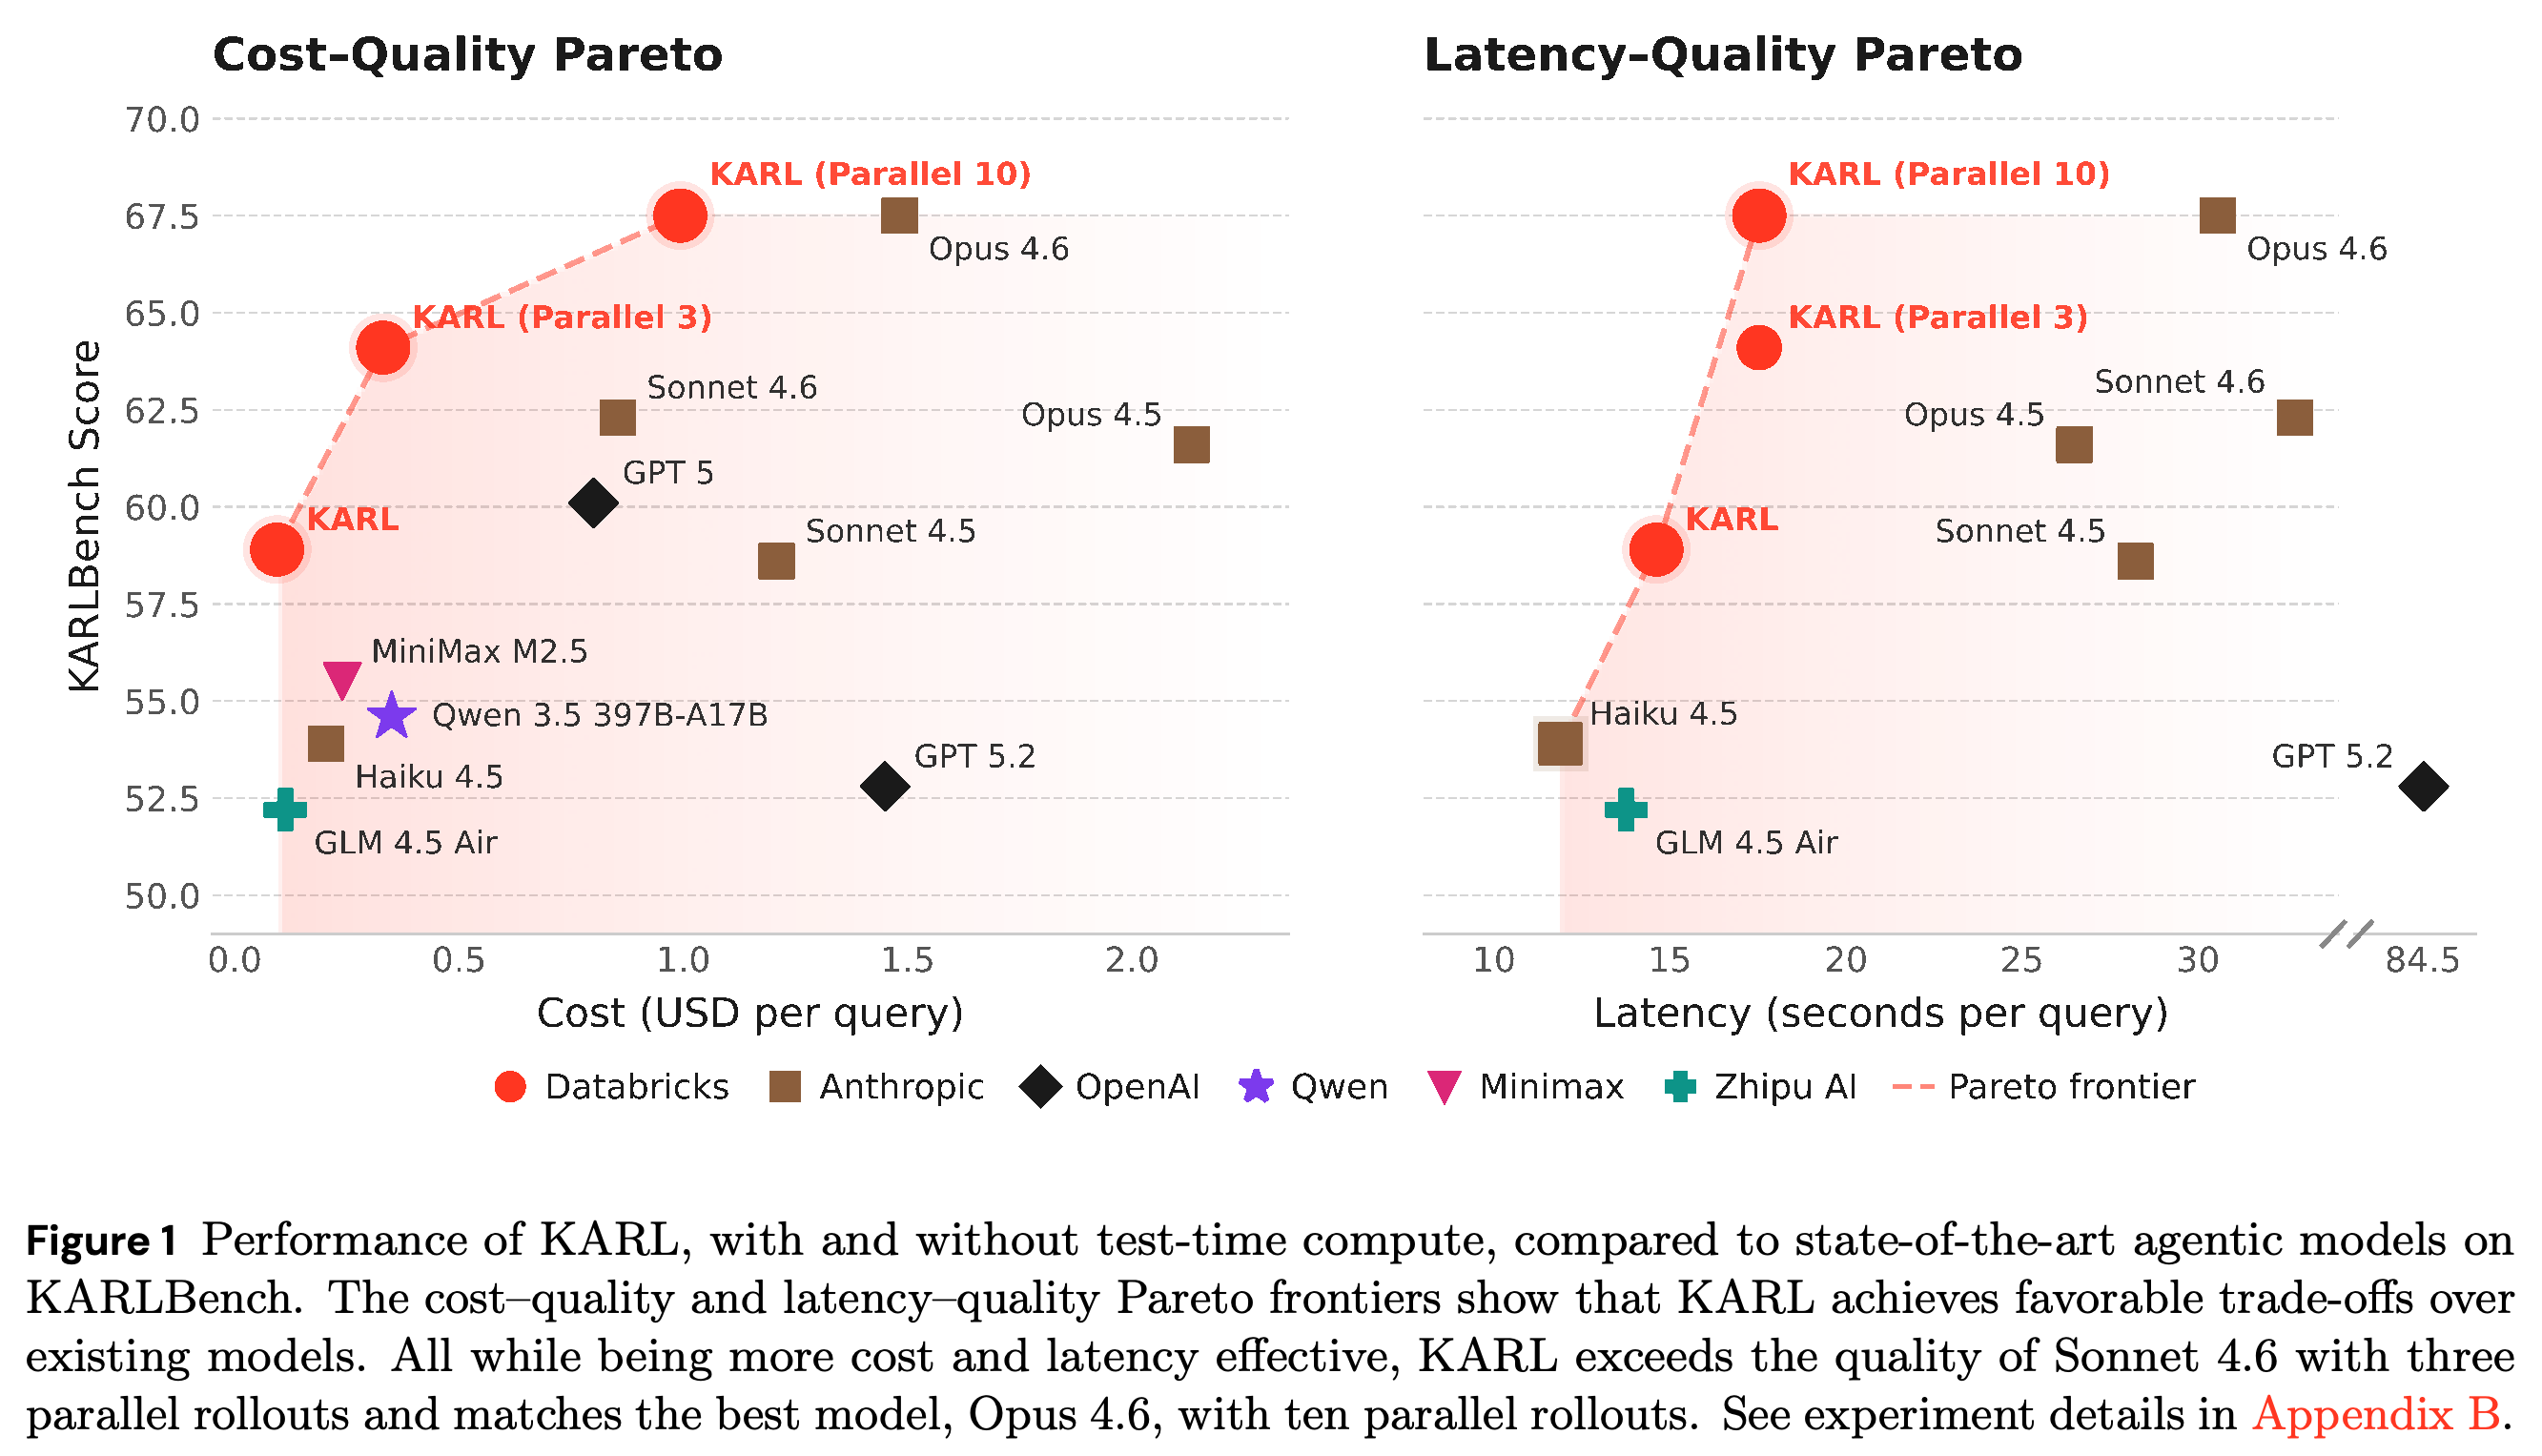
- Figure 1 summarizes cost–quality and latency–quality trade-offs under the paper’s inference configurations, token prices, and latency protocol.
Three parallel rollouts exceed Sonnet 4.6’s overall score, while ten match Opus 4.6 under the reported protocol. The favorable quality-adjusted positions depend on token prices and the latency definition; the plot does not show KARL as uniformly faster or cheaper than its base model.
2 KARLBench
KARLBench evaluates six structurally different grounded-reasoning capabilities independently. Restricting agents to vector search controls the retrieval interface and isolates evidence acquisition and integration, but excludes the broader tool orchestration required by benchmarks such as OfficeQA.
2.1 Tasks Overview
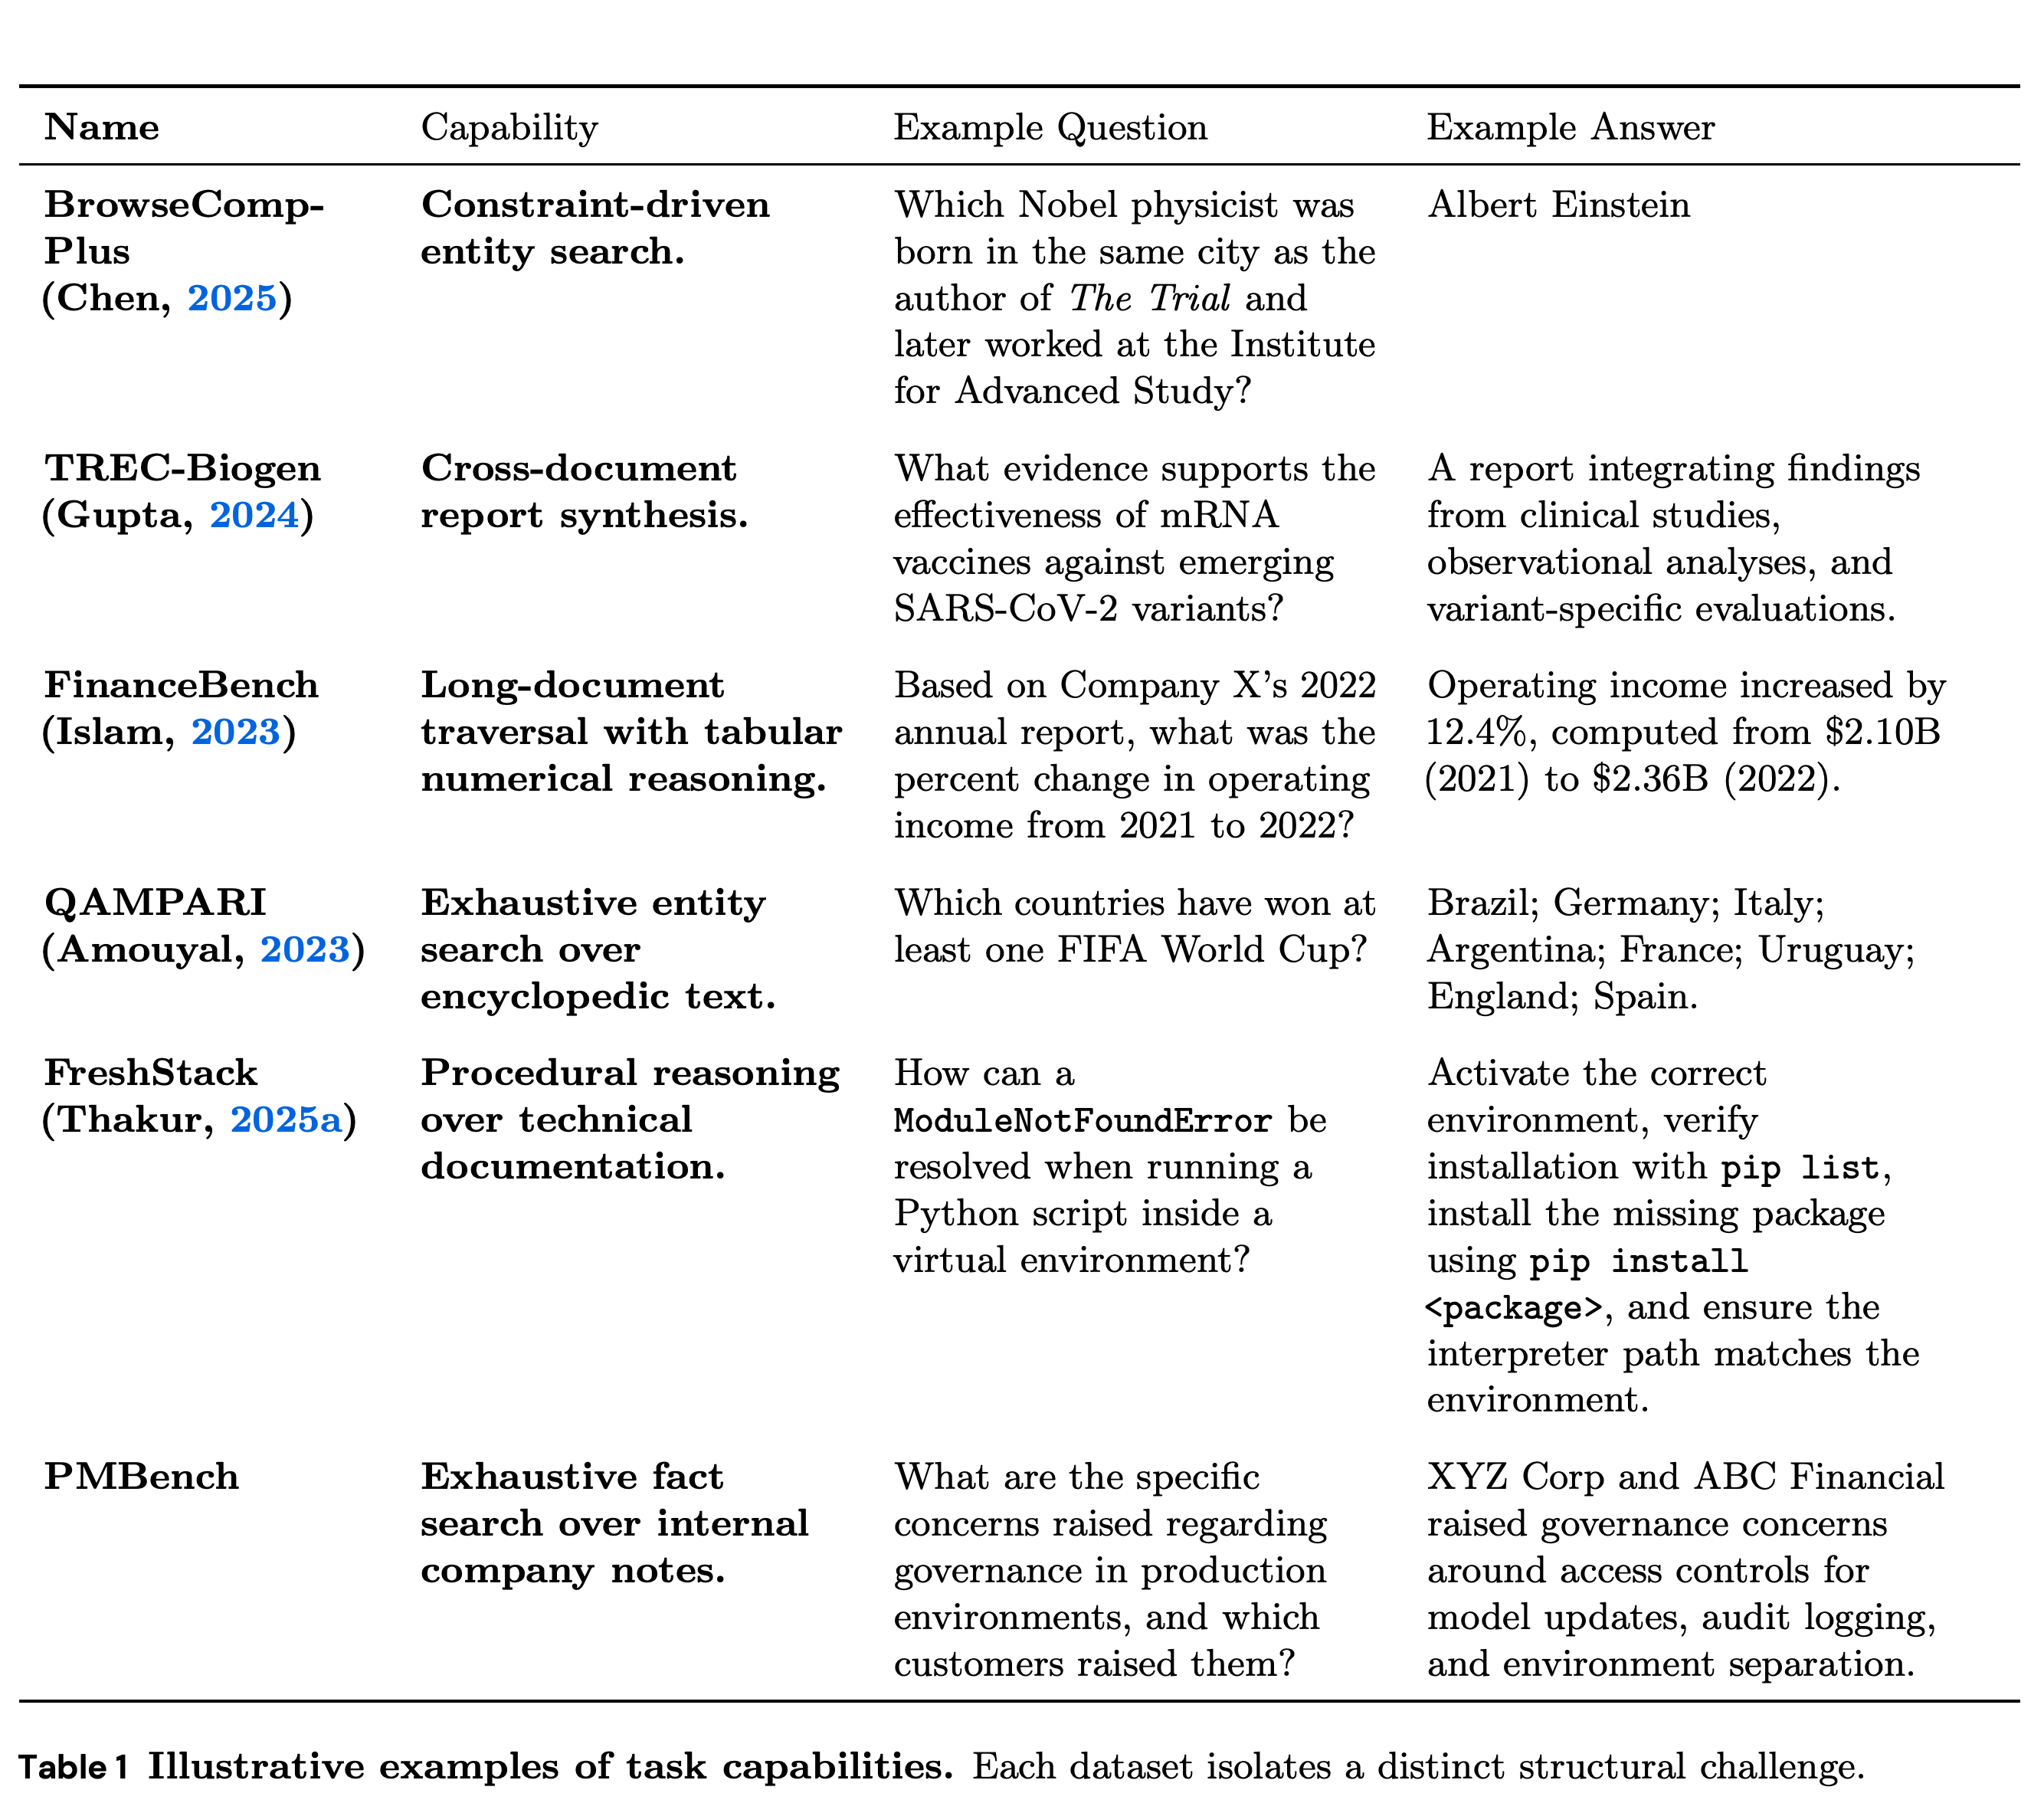
BrowseComp-Plus tests constraint-driven entity search; TREC-Biogen tests cross-document biomedical report synthesis; FinanceBench tests long-document traversal and tabular numerical reasoning. QAMPARI requires exhaustive entity retrieval, FreshStack requires procedural reasoning over technical documentation and source code, and PMBench requires aggregating facts from internal company notes.
- Table 1 illustrates task formats rather than measured model results.
- The distinction between identifying one answer and assembling many supporting facts motivates training on both deep and wide search.
The examples distinguish single-entity identification from multi-fact reporting, numerical calculation, exhaustive enumeration, technical procedures, and enterprise-note aggregation. They illustrate task diversity rather than verified answer quality or measured benchmark outcomes.
2.2 Corpus Construction
Corpus construction preserves original segmentation where possible and avoids dataset-specific re-chunking, semantic augmentation, metadata enrichment, or downstream chunk-size tuning. BrowseComp-Plus indexes the first 512 tokens per document, FinanceBench uses pages, FreshStack uses supplied chunks up to 2048 tokens, and TREC-Biogen uses abstracts.
- QAMPARI indexes supplied sentence-level chunks containing at least one gold answer entity, producing 256,680 chunks. This is a focused exhaustive-search setting rather than an unrestricted encyclopedic corpus.
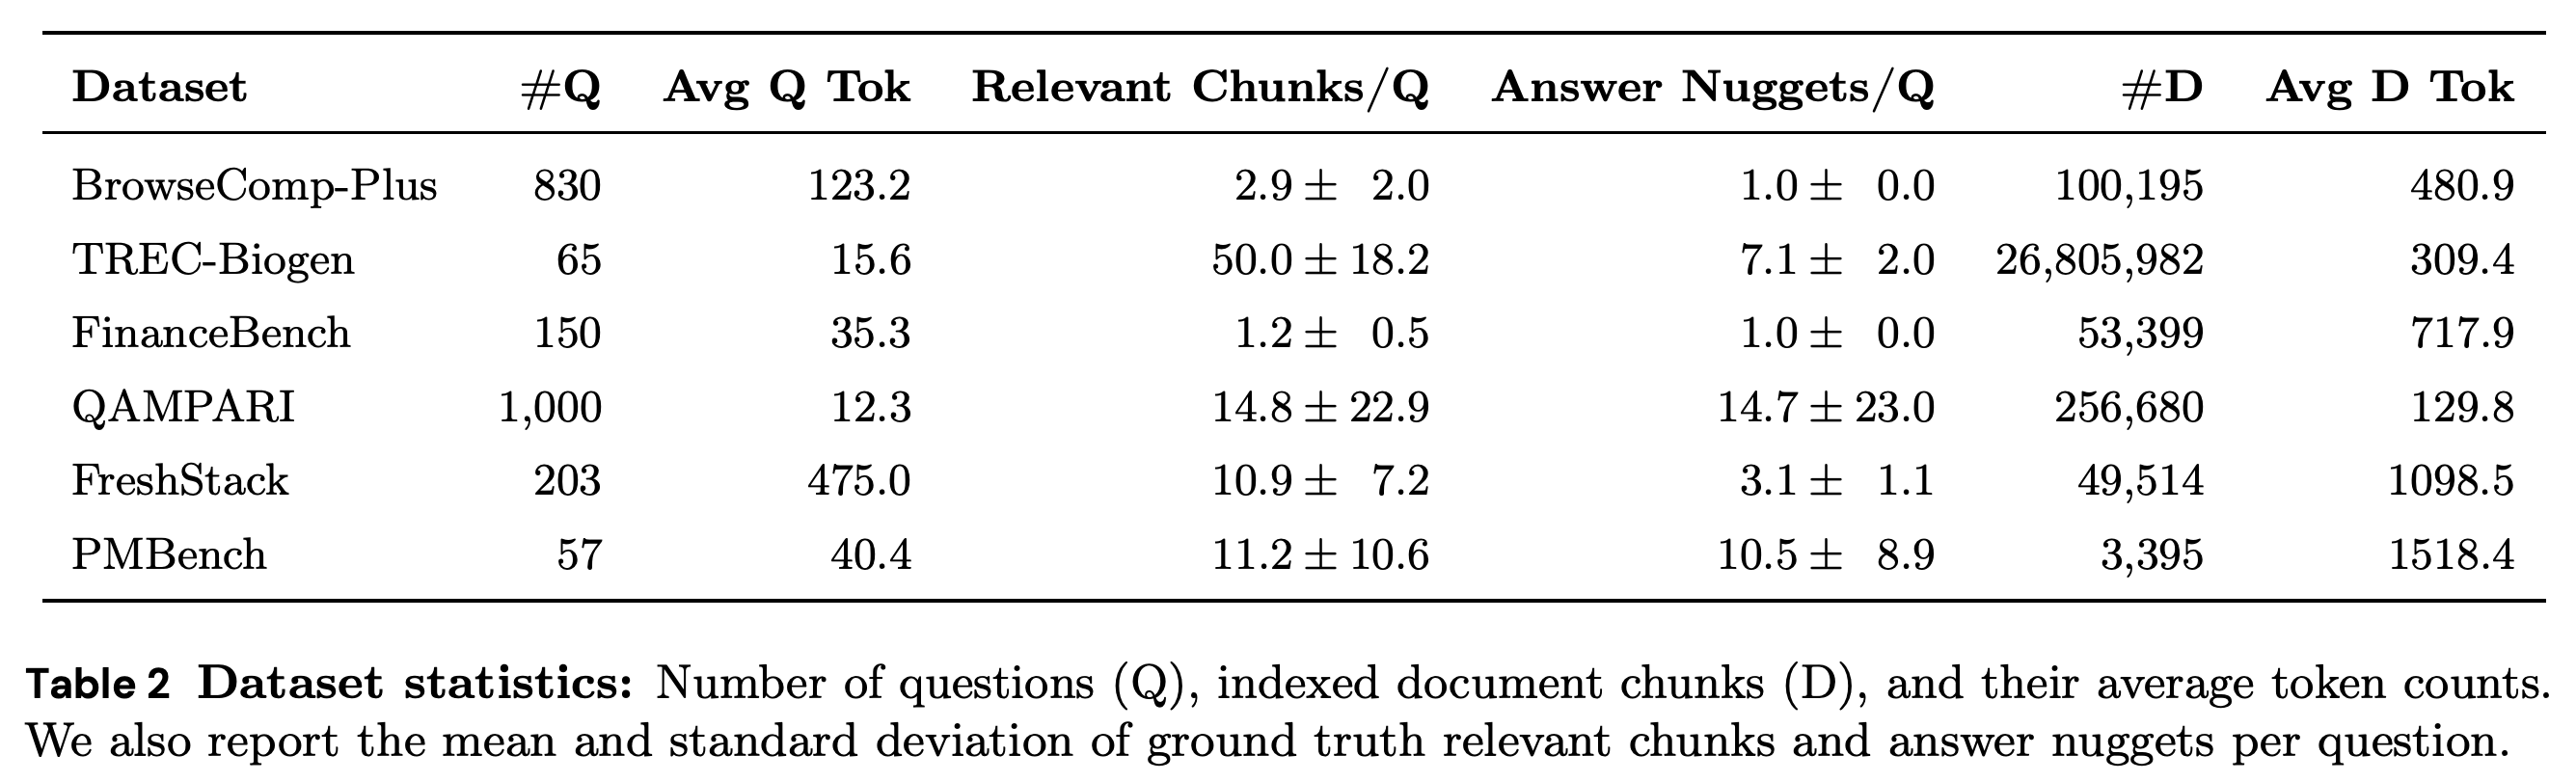
- PMBench indexes the first 2048 tokens per document. Table 2 shows corpus scales ranging from 3,395 PMBench chunks to 26,805,982 TREC-Biogen abstracts.
- The first 512 tokens cover 86.5% of BrowseComp-Plus gold evidence, restricting annotated evidence coverage without additional document-traversal tools. Closed corpora also avoid variability from live web content and search engines.
2.3 Evaluation
Evaluation uses nugget-based completion across all tasks. QAMPARI entities become separate nuggets; FreshStack and PMBench reference answers are decomposed into fixed facts; TREC-Biogen references are decomposed independently and consolidated; BrowseComp-Plus and FinanceBench each require one correct nugget.
- Table 2 reports 830 BrowseComp-Plus, 65 TREC-Biogen, 150 FinanceBench, 1,000 QAMPARI, 203 FreshStack, and 57 PMBench questions. The experiments later use a calibrated BrowseComp-Plus subset.
- The judge assesses whether answers support, partially support, or do not support reference facts. This measures reference-fact coverage, not a separate comprehensive audit of additional claims or citation validity.
Corpus size, chunk length, and answer multiplicity vary substantially. TREC-Biogen contains 26,805,982 indexed abstracts, while PMBench contains 3,395 chunks; QAMPARI and PMBench also require many answer nuggets, making single-fact accuracy an inadequate description of all tasks.
3 Agent Harness
The agent iteratively issues vector-search queries and generates an answer when it judges the evidence sufficient. Its own model compresses accumulated interaction history when a threshold is reached, and compression outputs receive outcome-based RL training alongside search queries and answers.
- Retrieval counts target comparable retrieved-token budgets and are capped at k = 20. BrowseComp-Plus uses Qwen3-8B embeddings; PMBench uses GTE-large; TREC-Biogen, QAMPARI, and FinanceBench use Qwen3-0.6B with k = 20; FreshStack uses Qwen3-0.6B with k = 10.
- Compression is not separately pretrained on summarization data. The general harness describes a token-count trigger, while the BrowseComp-Plus synthesis configuration specifies 150K characters.
4 Training a Knowledge Agent via Reinforcement Learning (KARL)
KARL training combines agentic synthesis of grounded tasks and trajectories, off-policy RL with OAPL, and multi-task optimization across complementary search behaviors. The synthesizer and solver are updated between iterations so that later offline data are generated by the latest policy.
4.1 Agentic Synthesis
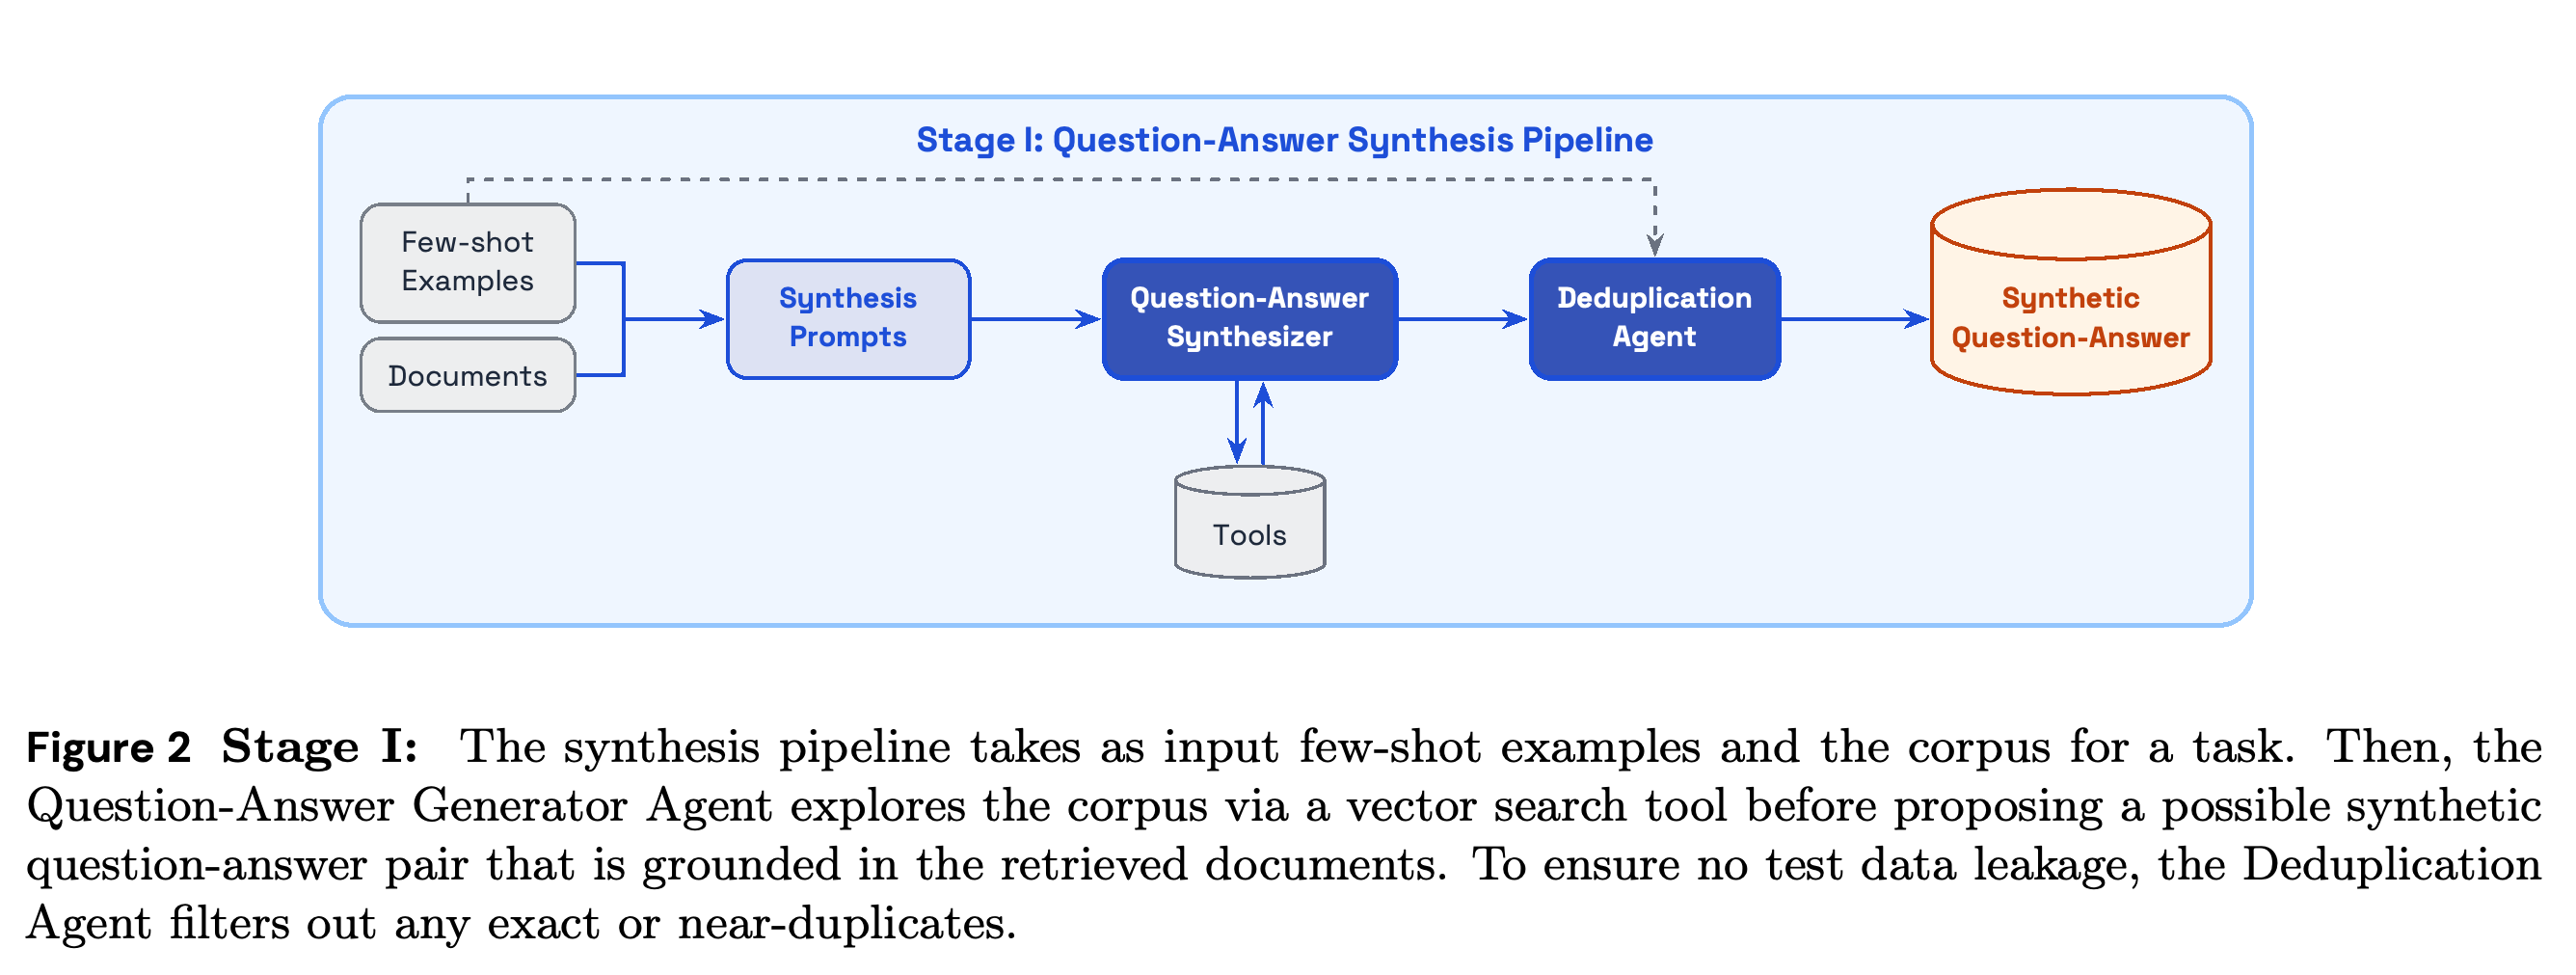
Stage I uses few-shot examples and corpus exploration to synthesize question–answer pairs grounded in retrieved documents, followed by exact and semantic deduplication. Stage II generates independent solutions, removes questions with uniformly successful or unsuccessful attempts, and includes a proposed quality judge for ambiguity or erroneous reference answers.
- Figure 2 distinguishes interactive corpus exploration from synthesis conditioned on a static document set.
- Figure 3 retains mixed-success rollout groups, supplying outcome variation for grouped advantage estimation.
- The general pipeline describes quality filtering as a standard stage, but Appendix D.3 reports its use only for BrowseComp-Plus Iter. 1 in the documented multi-task runs.
The synthesizer explores the corpus through tools before proposing a grounded task, then a deduplication agent screens overlap with seed examples. This can reduce exact and semantic duplication, but the diagram alone does not establish complete absence of evaluation leakage.
4.2 Post-training via Off-Policy RL
Optimal Advantage-based Policy Optimization with Lagged Inference policy (OAPL) regresses a policy/reference log-probability ratio onto the optimal advantage implied by KL-regularized RL. Its least-squares objective is min_π ∑_x ∑_{i=1}^G (β ln[π(y_i|x)/π_ref(y_i|x)] − [r(x,y_i) − V̂⋆(x)])², where V̂⋆(x) = β ln[(1/G)∑_{i=1}^G exp(r(x,y_i)/β)].
- The optimal policy has π⋆(y|x) ∝ π_ref(y|x) exp(r(x,y)/β). The value-estimation argument assumes a lower-bounded reference-policy probability of solving the prompt; in practice, β1 controls value-estimate smoothness and β2 controls the log-ratio term’s regularization strength.
- Only model-generated tokens contribute to rollout log-probabilities; prompts and tool outputs are masked. Compression boundaries split long trajectories into segments, including separate history-to-summary training pairs.
- Each segment inherits the full trajectory’s outcome reward and initial-prompt value estimate. Training replaces the reference policy and regenerates offline data between iterations, with at most 3 iterations in the experiments.
- The authors report stable large-MoE training without clipped importance weighting, off-policy data deletion, or router replay. Reusing offline rollouts can amortize generation across updates and hyperparameter runs, but the paper provides no matched online-GRPO experiment quantifying the efficiency advantage.
4.3 Multi-task RL Post Training
Multi-task RL combines BrowseComp-Plus deep search with TREC-Biogen wide search and approximately balances their total training-token contributions. An alternative trains separate RL experts and distills their trajectories into GLM 4.5 Air through supervised fine-tuning.
- Generalization is evaluated on four tasks excluded from KARL’s RL training, alongside performance on the two synthesis domains.
- The later comparison qualifies the claim that RL generalizes better than distillation: SFT has higher single-rollout OOD scores, whereas KARL achieves higher OOD scores with the tested parallel-thinking budget.
5 Scaling KARL via Test-time Compute
The paper scales test-time compute through parallel computation rather than extending sequential reasoning, motivated by wall-clock latency. It compares task-independent parallel thinking with task-specific Value-Guided Search (VGS), which requires a learned success predictor.
5.1 Parallel Thinking TTC
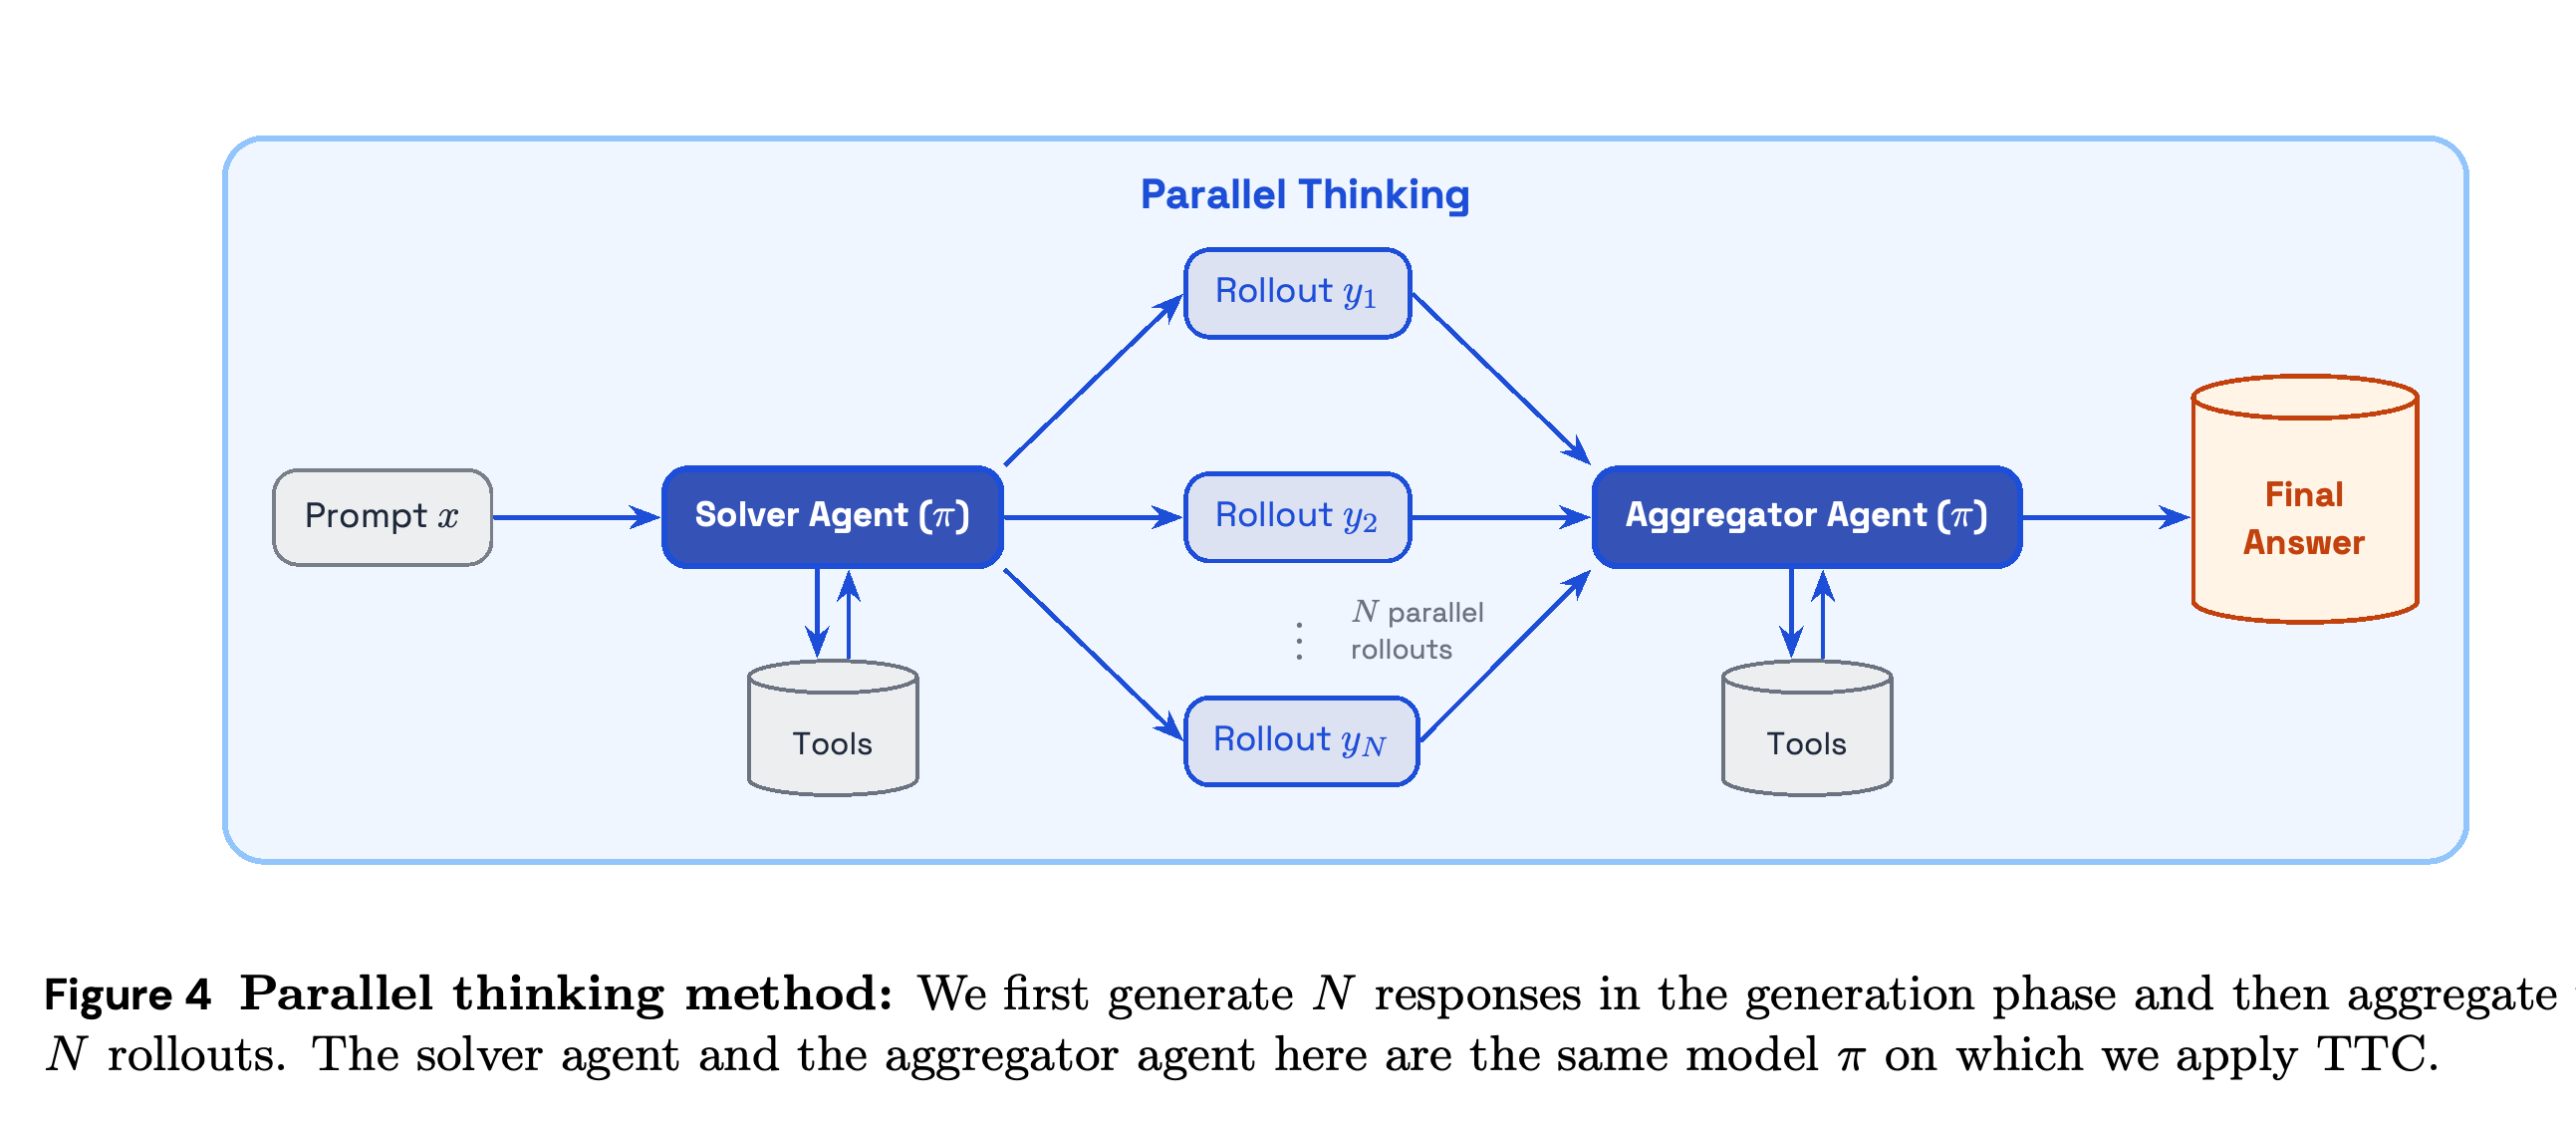
Parallel thinking generates N independent trajectories and passes their final answers to the same model for aggregation. Both solver and aggregator retain tool access, allowing the aggregator to retrieve additional evidence and synthesize a response rather than merely select a candidate.
- Figure 4 separates parallel solution generation from final aggregation. Feeding final answers rather than full histories limits aggregator context.
- On PMBench with 5 rollouts, the aggregator exceeds the best individual candidate’s score 23.7% of the time, demonstrating that aggregation can combine complementary facts.
Concurrent solver trajectories are followed by a tool-enabled aggregator using the same policy. Because the aggregator receives candidate answers and can search again, it can synthesize complementary content rather than only select the most frequent answer.
5.2 Reward-based TTC via Value-Guided Search
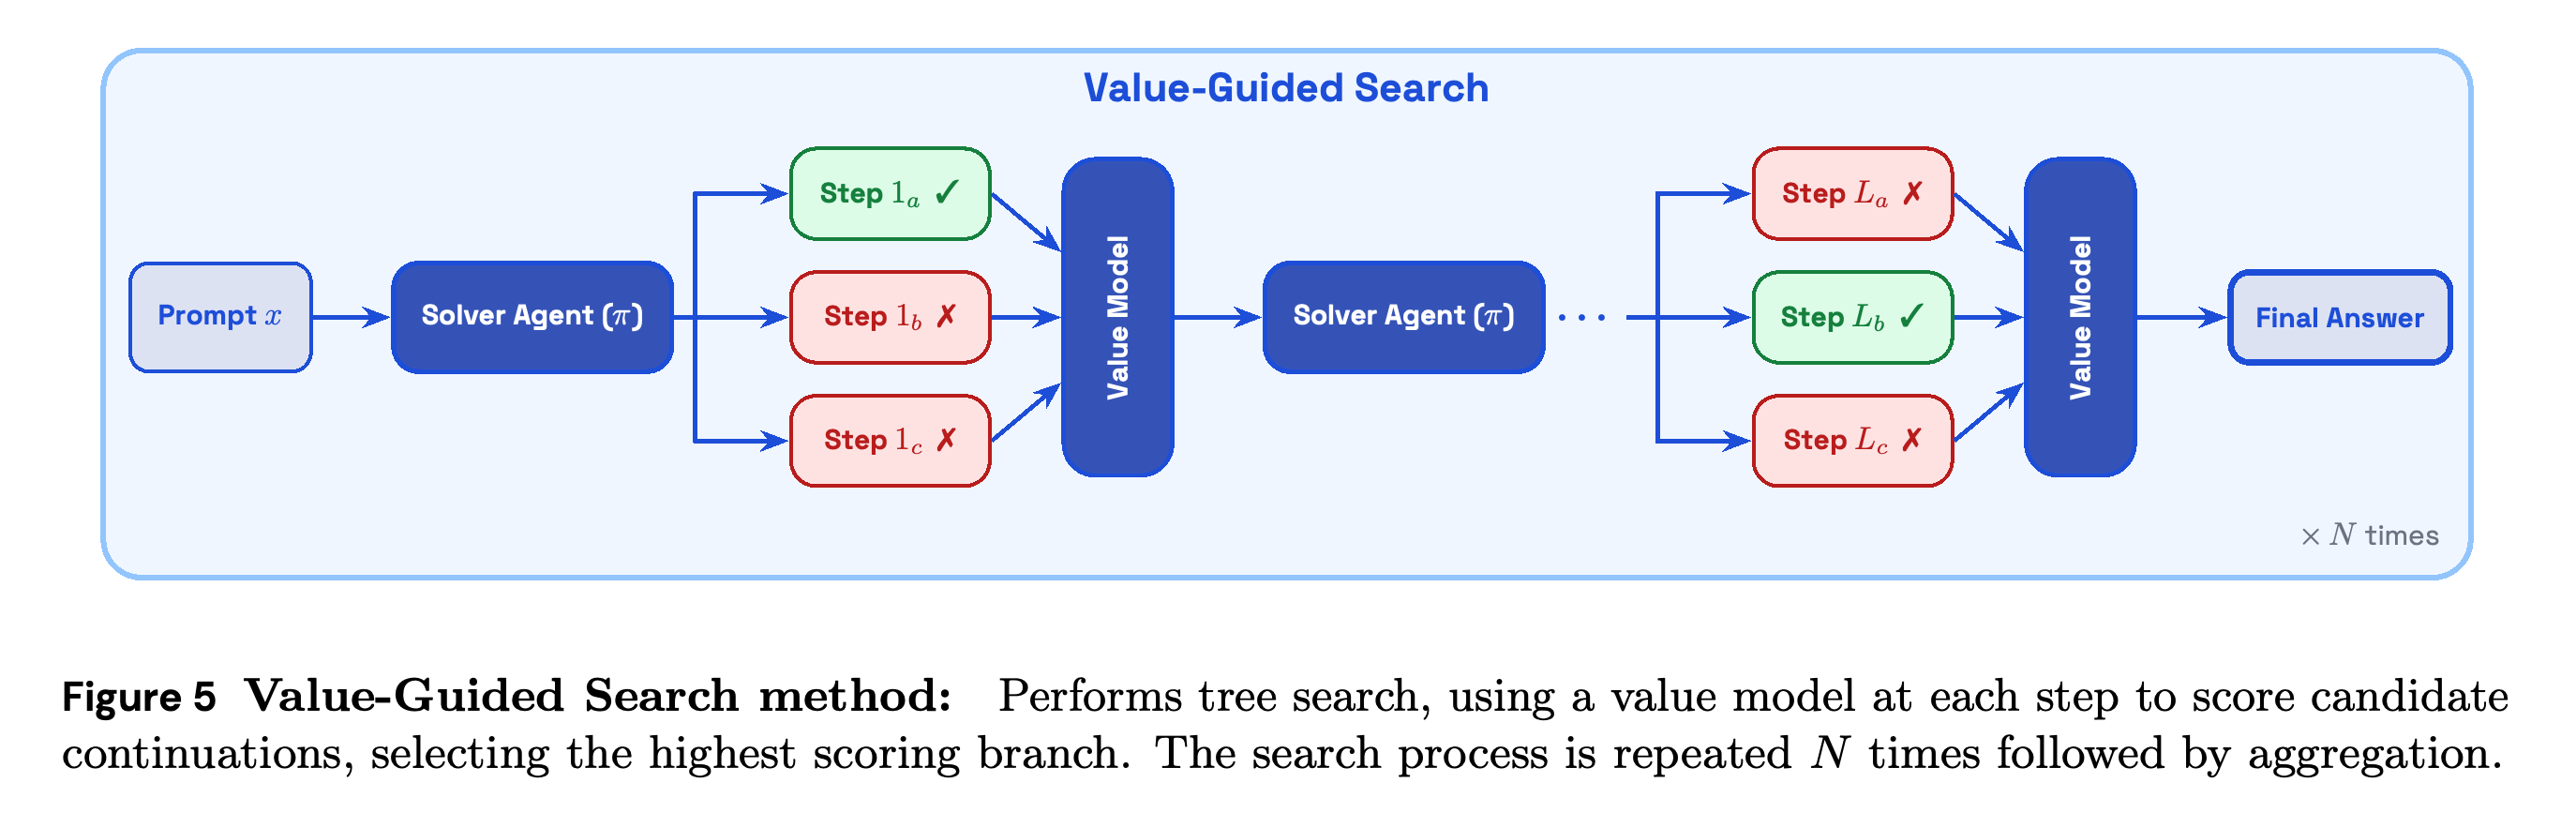
VGS trains a token-level value model to predict eventual binary success from partial trajectories using cross-entropy loss and a mask over policy-generated tokens. The experiments use Qwen3-4B-Thinking-2507 as the value model.
- At every assistant step, including queries, summaries, and answers, the policy generates k candidates and continues from the candidate with the highest predicted success probability.
- Figure 5 illustrates the selection loop. Experiments fix k = 2, run N search processes in parallel, and compare majority voting, weighted majority voting, and Best-of-N.
- Voting requires answers that can be mapped to discrete equivalence classes, limiting its direct applicability to open-ended reports. Best-of-N instead selects the highest-scoring individual response.
A separate value model selects among candidate continuations at each assistant step. Although the schematic draws three candidates, the experiments use two per step and repeat the process N times before final aggregation.
6 Agent Infrastructure
The infrastructure supports high-volume offline trajectory collection and a shared agent environment across synthesis, evaluation, and inference. Its main components are embedded vector search and the internal aroll rollout framework.
6.1 Scaling Vector Search
Corpora are embedded and indexed offline, cached in shared storage, and loaded into an in-process columnar vector database by each worker. Eliminating client–server network I/O yields reported throughput exceeding 500 queries per second per host during offline generation.
6.2 Agent Harness Implementation
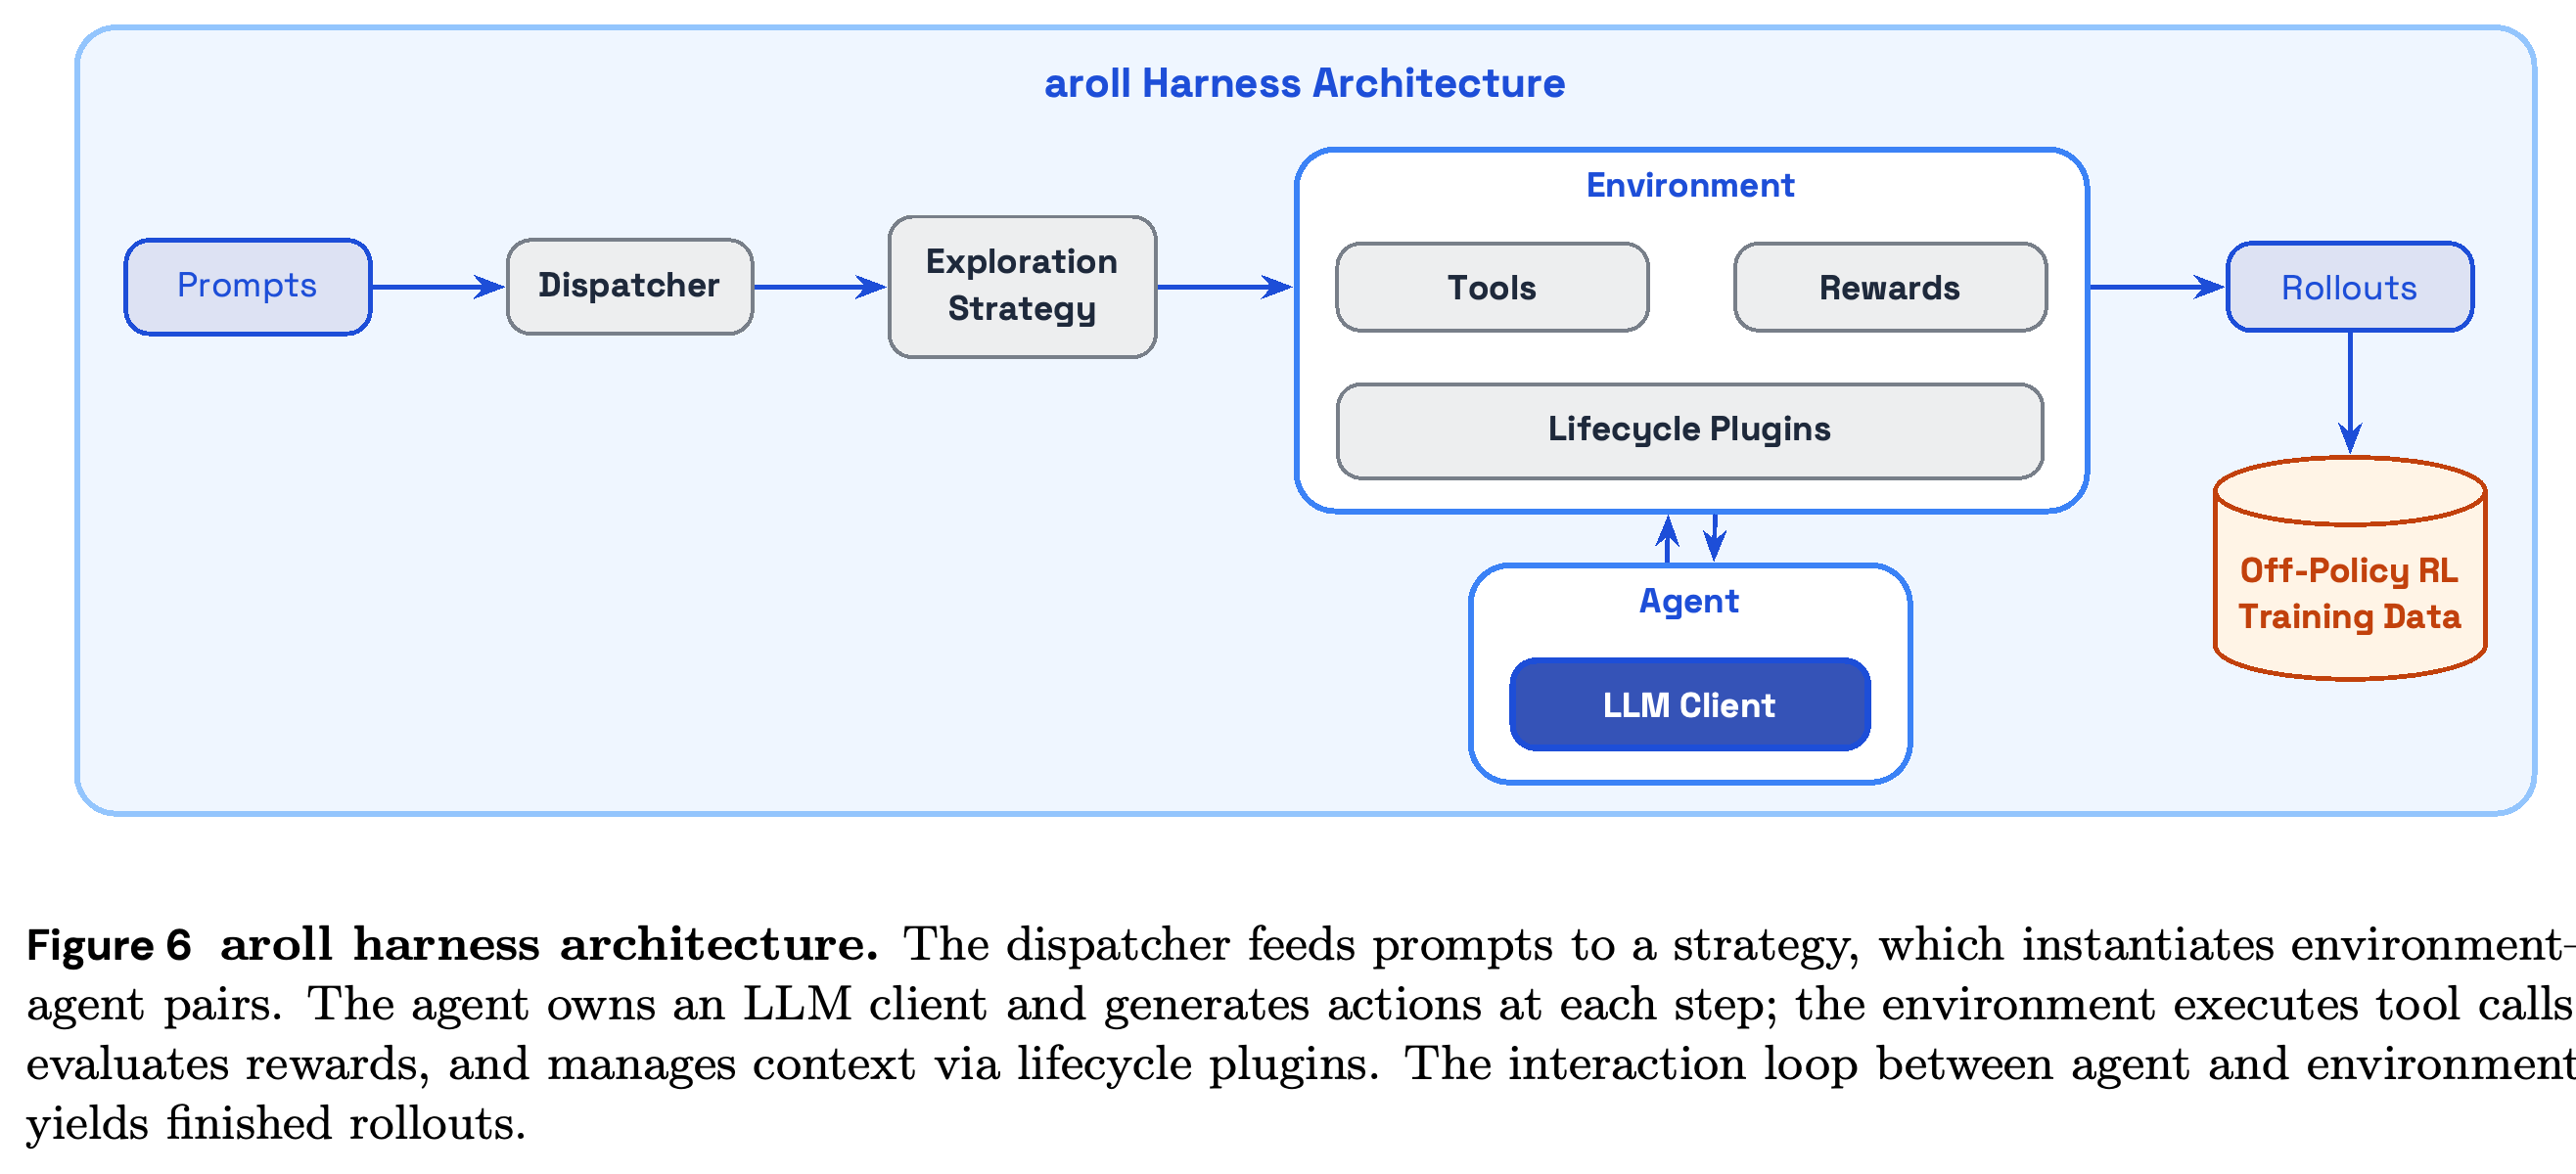
aroll separates prompt dispatch, exploration strategy, environment execution, agent generation, tools, and composable rewards. Lifecycle plugins implement compression, step budgets, and tool gating without changing the core interaction loop.
- Figure 6 shows environment–agent pairs producing completed rollouts for off-policy training.
- Parallel thinking changes the strategy layer; VGS changes the agent layer; compression changes the plugin configuration. Shared interfaces reduce harness differences between collection and serving, without eliminating every possible source of distribution shift.
Orchestration, generation, tool execution, rewards, and lifecycle logic are separated behind shared interfaces. Parallel thinking, VGS, and compression can therefore be changed at different layers while reusing the rollout execution pipeline.
7.1 Evaluation and Training Set
The experiments cover data synthesis, post-training, test-time scaling, and transfer across KARLBench. RL training uses BrowseComp-Plus and TREC-Biogen, while FreshStack, FinanceBench, QAMPARI, and PMBench are held out; BrowseComp-Plus evaluation uses 230 calibrated questions from the original 830, with the remaining 600 seeding synthesis.
- The authors report a ±1 score difference between the calibrated subset and full BrowseComp-Plus dataset.
- The split separates BrowseComp-Plus seed examples from evaluation questions. TREC-Biogen synthesis instead draws seed examples from its evaluation set and uses deduplication to remove equivalent synthetic questions.
7.2 Training Data Synthesis
At each RL iteration, the current policy serves as both question–answer synthesizer and solver, starting from GLM 4.5 Air. Each retained task is paired with eight solution attempts for difficulty filtering and grouped off-policy advantage estimation.
7.2.1 TREC-Biogen Data Synthesis.
TREC-Biogen synthesis samples four seed examples, explores for up to fifty steps with k = 20, and proposes eight questions with nuggetized answers and citations. Exact deduplication is followed by similarity retrieval using Qwen3-8B-Embedding and gpt-4o-mini paraphrase judgments.
- Each task receives eight solver rollouts with the same fifty-step maximum. Pass-rate filtering binarizes nugget scores at 0.6 and 0.7 for the two multi-task iterations, and at 0.6, 0.75, and 0.9 for the three TREC-Biogen expert iterations.
- The main text retrieves the top-20 synthetic questions for each evaluation question, whereas Figure 32 describes retrieving the top-20 validation questions for each synthetic question. These directions are not equivalent when candidate lists are truncated.
- This section states that gpt-5-mini performs quality filtering, but Appendix D.3 explicitly states that no Quality Filter was applied for TREC-Biogen. The PDF does not consistently specify its actual use.
7.2.2 BrowseComp-Plus Data Synthesis
BrowseComp-Plus synthesis starts from ten seed documents and four examples from the 600-question validation set, explores up to sixty steps with k = 5, and proposes eight candidate tasks. Document seeding reportedly increases document coverage by 25%.
- The main text removes exact validation-answer matches, then retrieves top-10 similar synthetic questions for each validation question using Qwen3-0.6B-Embedding and gpt-4o-mini judgments. Figure 33 instead describes answer-based retrieval of validation examples for each generated pair, leaving the retrieval representation and direction unclear.
- Solver generation uses eight attempts, k = 20, a 200-step maximum, and context compression at 150K characters. Uniformly correct or incorrect groups are discarded.
- The main text describes gpt-4o-mini quality filtering generally; Appendix D.3 specifies its use only in Iter. 1, not Iter. 2.
7.3 Training Experiments
Unless otherwise stated, KARL denotes GLM 4.5 Air after 2 multi-task OAPL iterations. Table 3 reports 1,218 BrowseComp-Plus and 6,270 TREC-Biogen prompts in Iter. 1, followed by 1,336 and 11,371 respectively in Iter. 2.
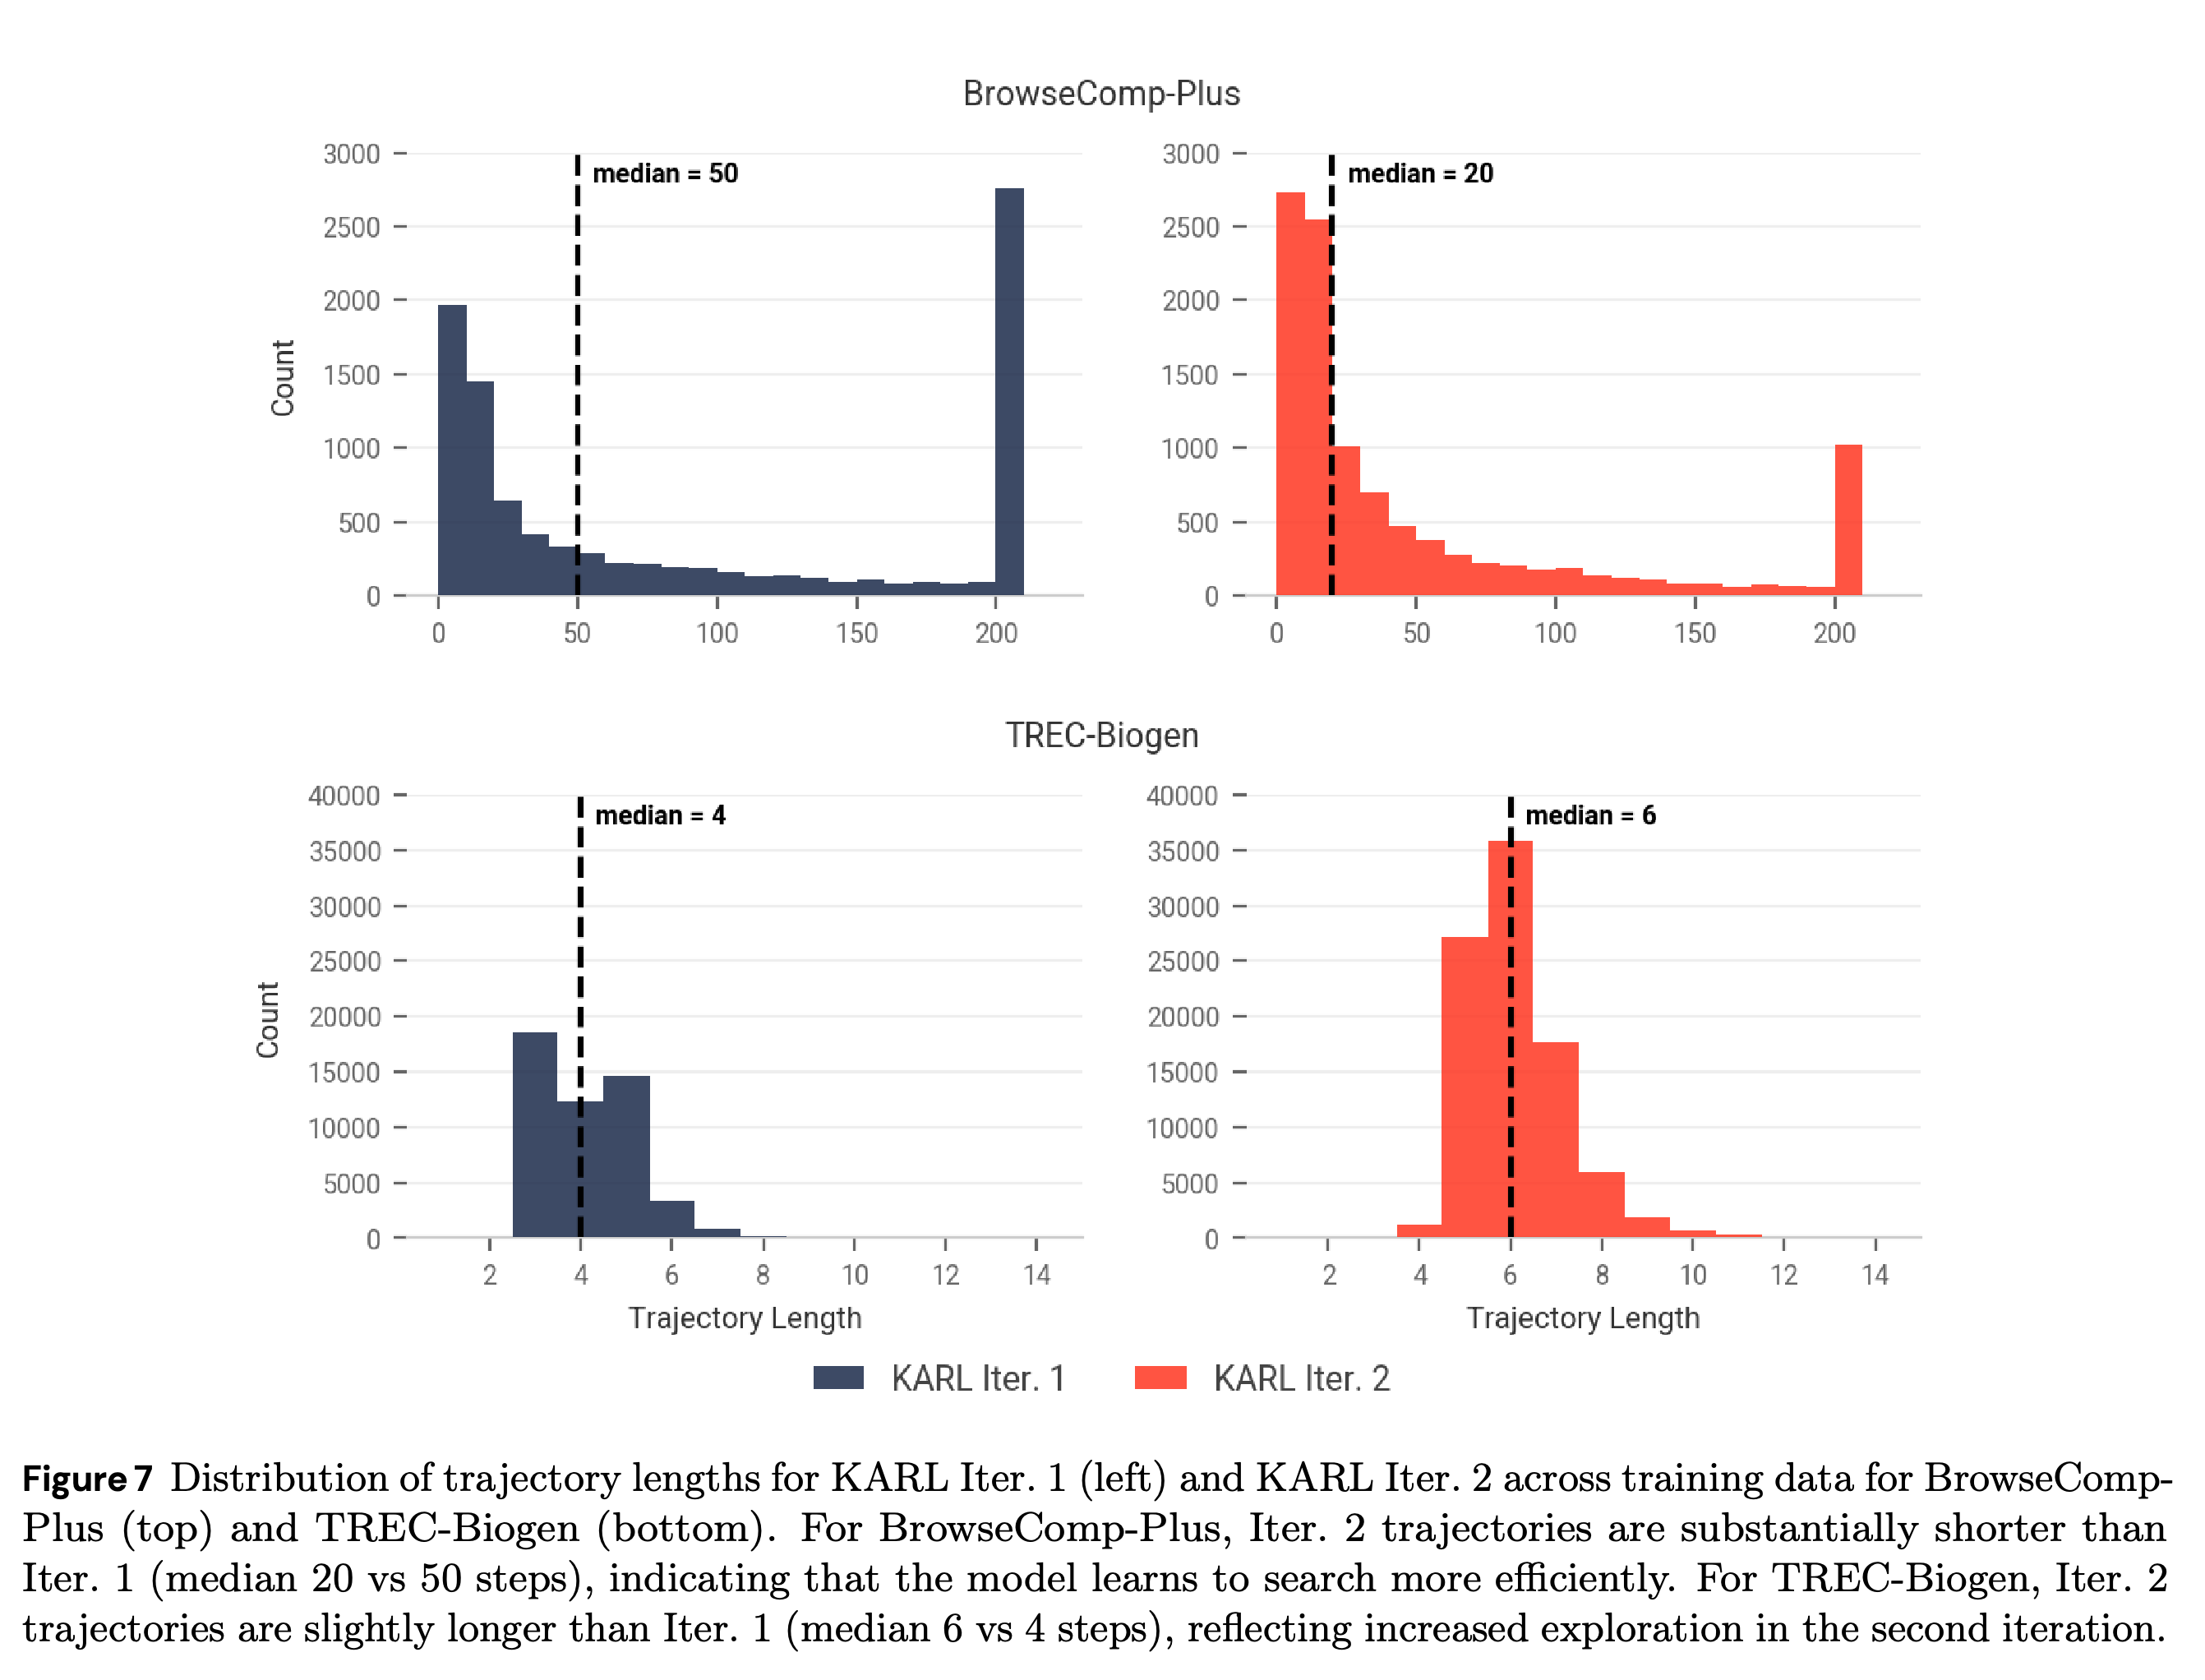
- More TREC-Biogen prompts compensate for its shorter trajectories when balancing training tokens.
- Figure 7 shows BrowseComp-Plus median trajectory length falling from 50 to 20 steps, while TREC-Biogen increases from 4 to 6. The BrowseComp-Plus distribution has a reduced, but still visible, spike at the 200-step budget.
- These are distributions of regenerated training data, not paired trajectories on an unchanged question set, so synthesis and filtering changes also affect the comparison.
TREC-Biogen supplies more prompts to compensate for its shorter trajectories when balancing training-token contributions. The counts describe retained training prompts, not the initial synthesis pool.

BrowseComp-Plus median length falls from 50 to 20 steps, while TREC-Biogen rises from 4 to 6. The later BrowseComp-Plus distribution still has a budget-limit spike; because the training questions are regenerated, the distributions reflect both policy and data-pipeline changes.
7.3.1 Main Results
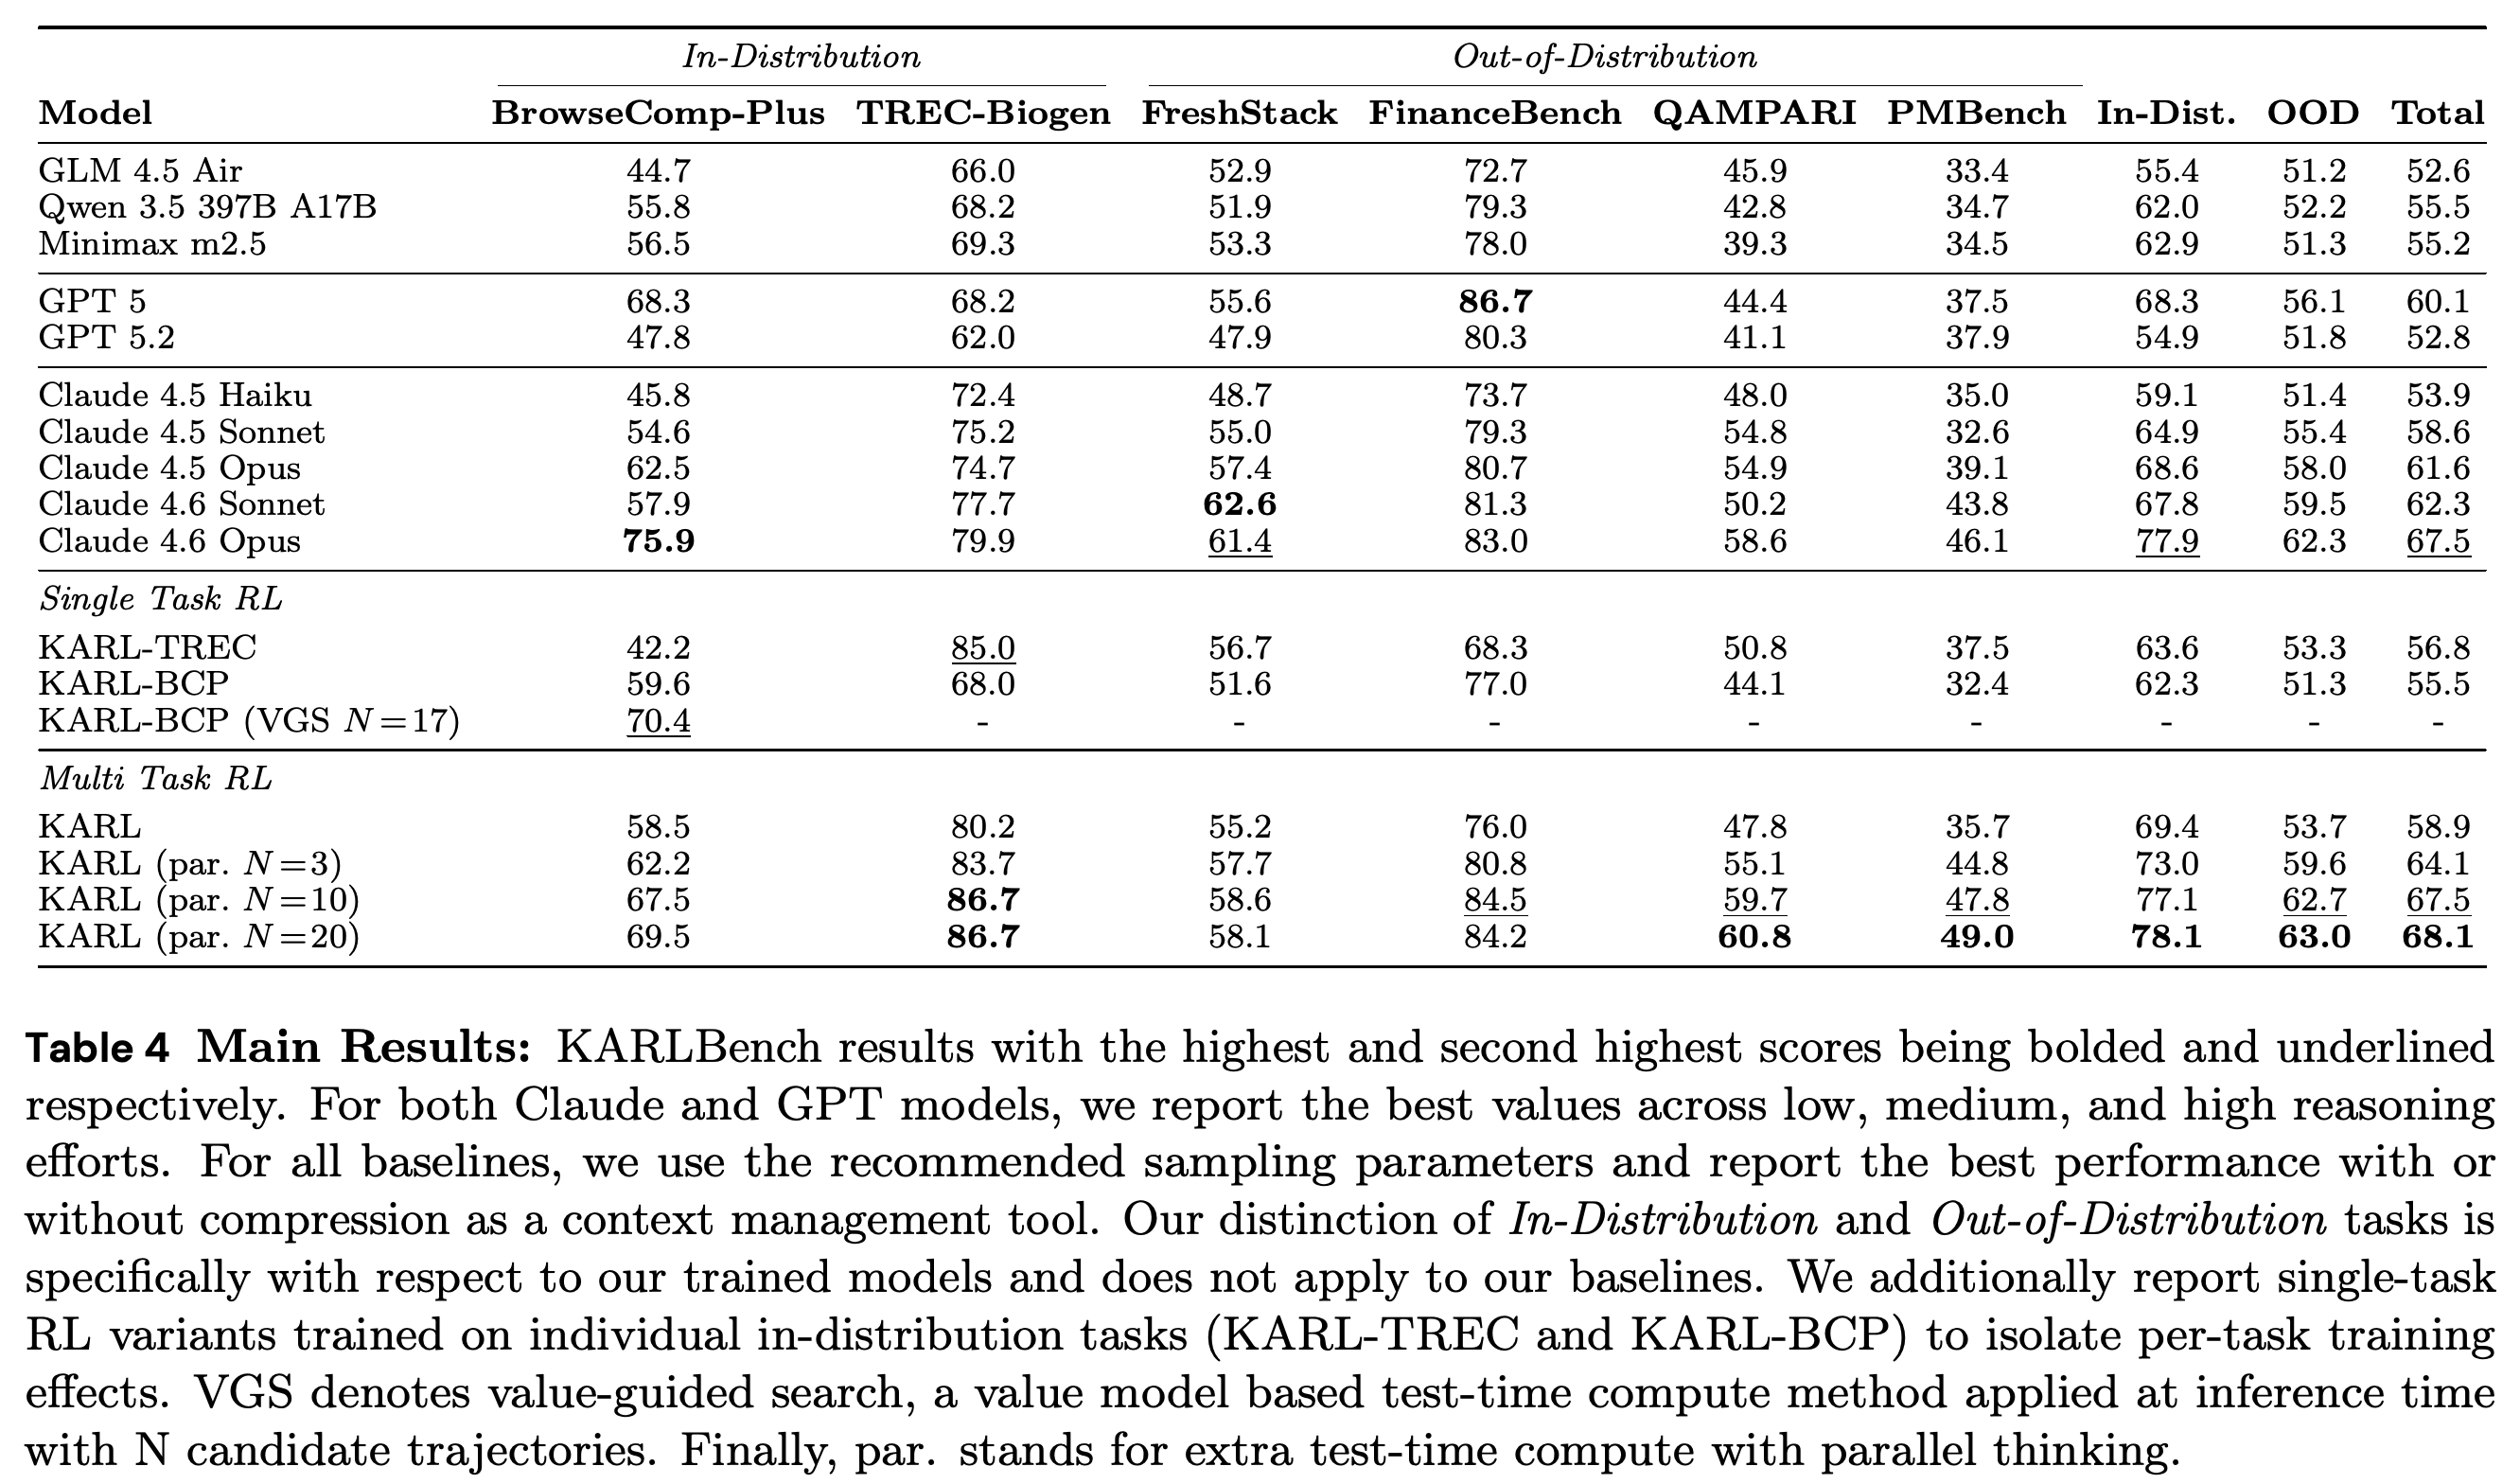
Table 4 reports KARL at 58.9 overall, compared with 52.6 for GLM 4.5 Air and 58.6 for Claude 4.5 Sonnet. With parallel thinking, KARL reaches 64.1 at N = 3, 67.5 at N = 10, and 68.1 at N = 20; Claude 4.6 Opus scores 67.5.
- KARL’s single-rollout scores are 58.5 on BrowseComp-Plus, 80.2 on TREC-Biogen, 55.2 on FreshStack, 76.0 on FinanceBench, 47.8 on QAMPARI, and 35.7 on PMBench.
- At N = 10, the corresponding scores are 67.5, 86.7, 58.6, 84.5, 59.7, and 47.8, with an OOD average of 62.7 versus Claude 4.6 Opus’s 62.3. Matching the overall score does not imply matching each task.
- Single-task experts reach 85.0 on TREC-Biogen and 59.6 on BrowseComp-Plus. KARL-TREC drops to 42.2 on BrowseComp-Plus, while KARL-BCP reaches 68.0 on TREC-Biogen versus the base model’s 66.0; transfer is therefore asymmetric rather than uniformly absent.
- Claude and GPT results select the best reasoning effort among low, medium, and high; baselines also select their better compression configuration. OOD means exclusion from KARL’s RL training, not exclusion from baseline pretraining.
The table separates baseline models, single-task experts, multi-task KARL, and inference-time scaling. KARL’s overall 58.9 rises to 67.5 with ten parallel rollouts and 68.1 with twenty, but it does not lead every individual task and the OOD designation applies specifically to KARL training.
7.3.2 Cost and Latency
The paper reports KARL below $0.10 per query without parallel thinking and approximately 33% lower query cost than Claude Opus 4.6 at matched overall quality with 10 parallel trajectories. It reports approximately 47% lower latency at that matched-quality setting.
- Costs are estimated from recorded input/output tokens and prices from artificialanalysis.ai, using 4 generations per prompt. They do not measure total infrastructure expenditure or training cost.
- Open models are served with vLLM on an 8 GPU H200 node. The primary latency metric measures time to the first answer token, substituting full end-to-end time for budget-exhausted or context-truncated trajectories.
- Appendix B samples 5 prompts per benchmark and collects 30 measured trajectories per prompt after 3 warm-up trajectories, across 3 splits at concurrency 1. The latency figures include task-level variation and confidence intervals over evaluation means.
- Appendix Figures 21–22 report mean effective latency of 14,615 ms for KARL versus 13,758 ms for GLM 4.5 Air. KARL therefore has favorable quality-adjusted latency, not uniformly lower latency than its base model; Figure 1 also does not clearly corroborate the prose claim of lower cost than the base.
7.3.3 Multi-Expert Distillation vs. Multi-Task RL
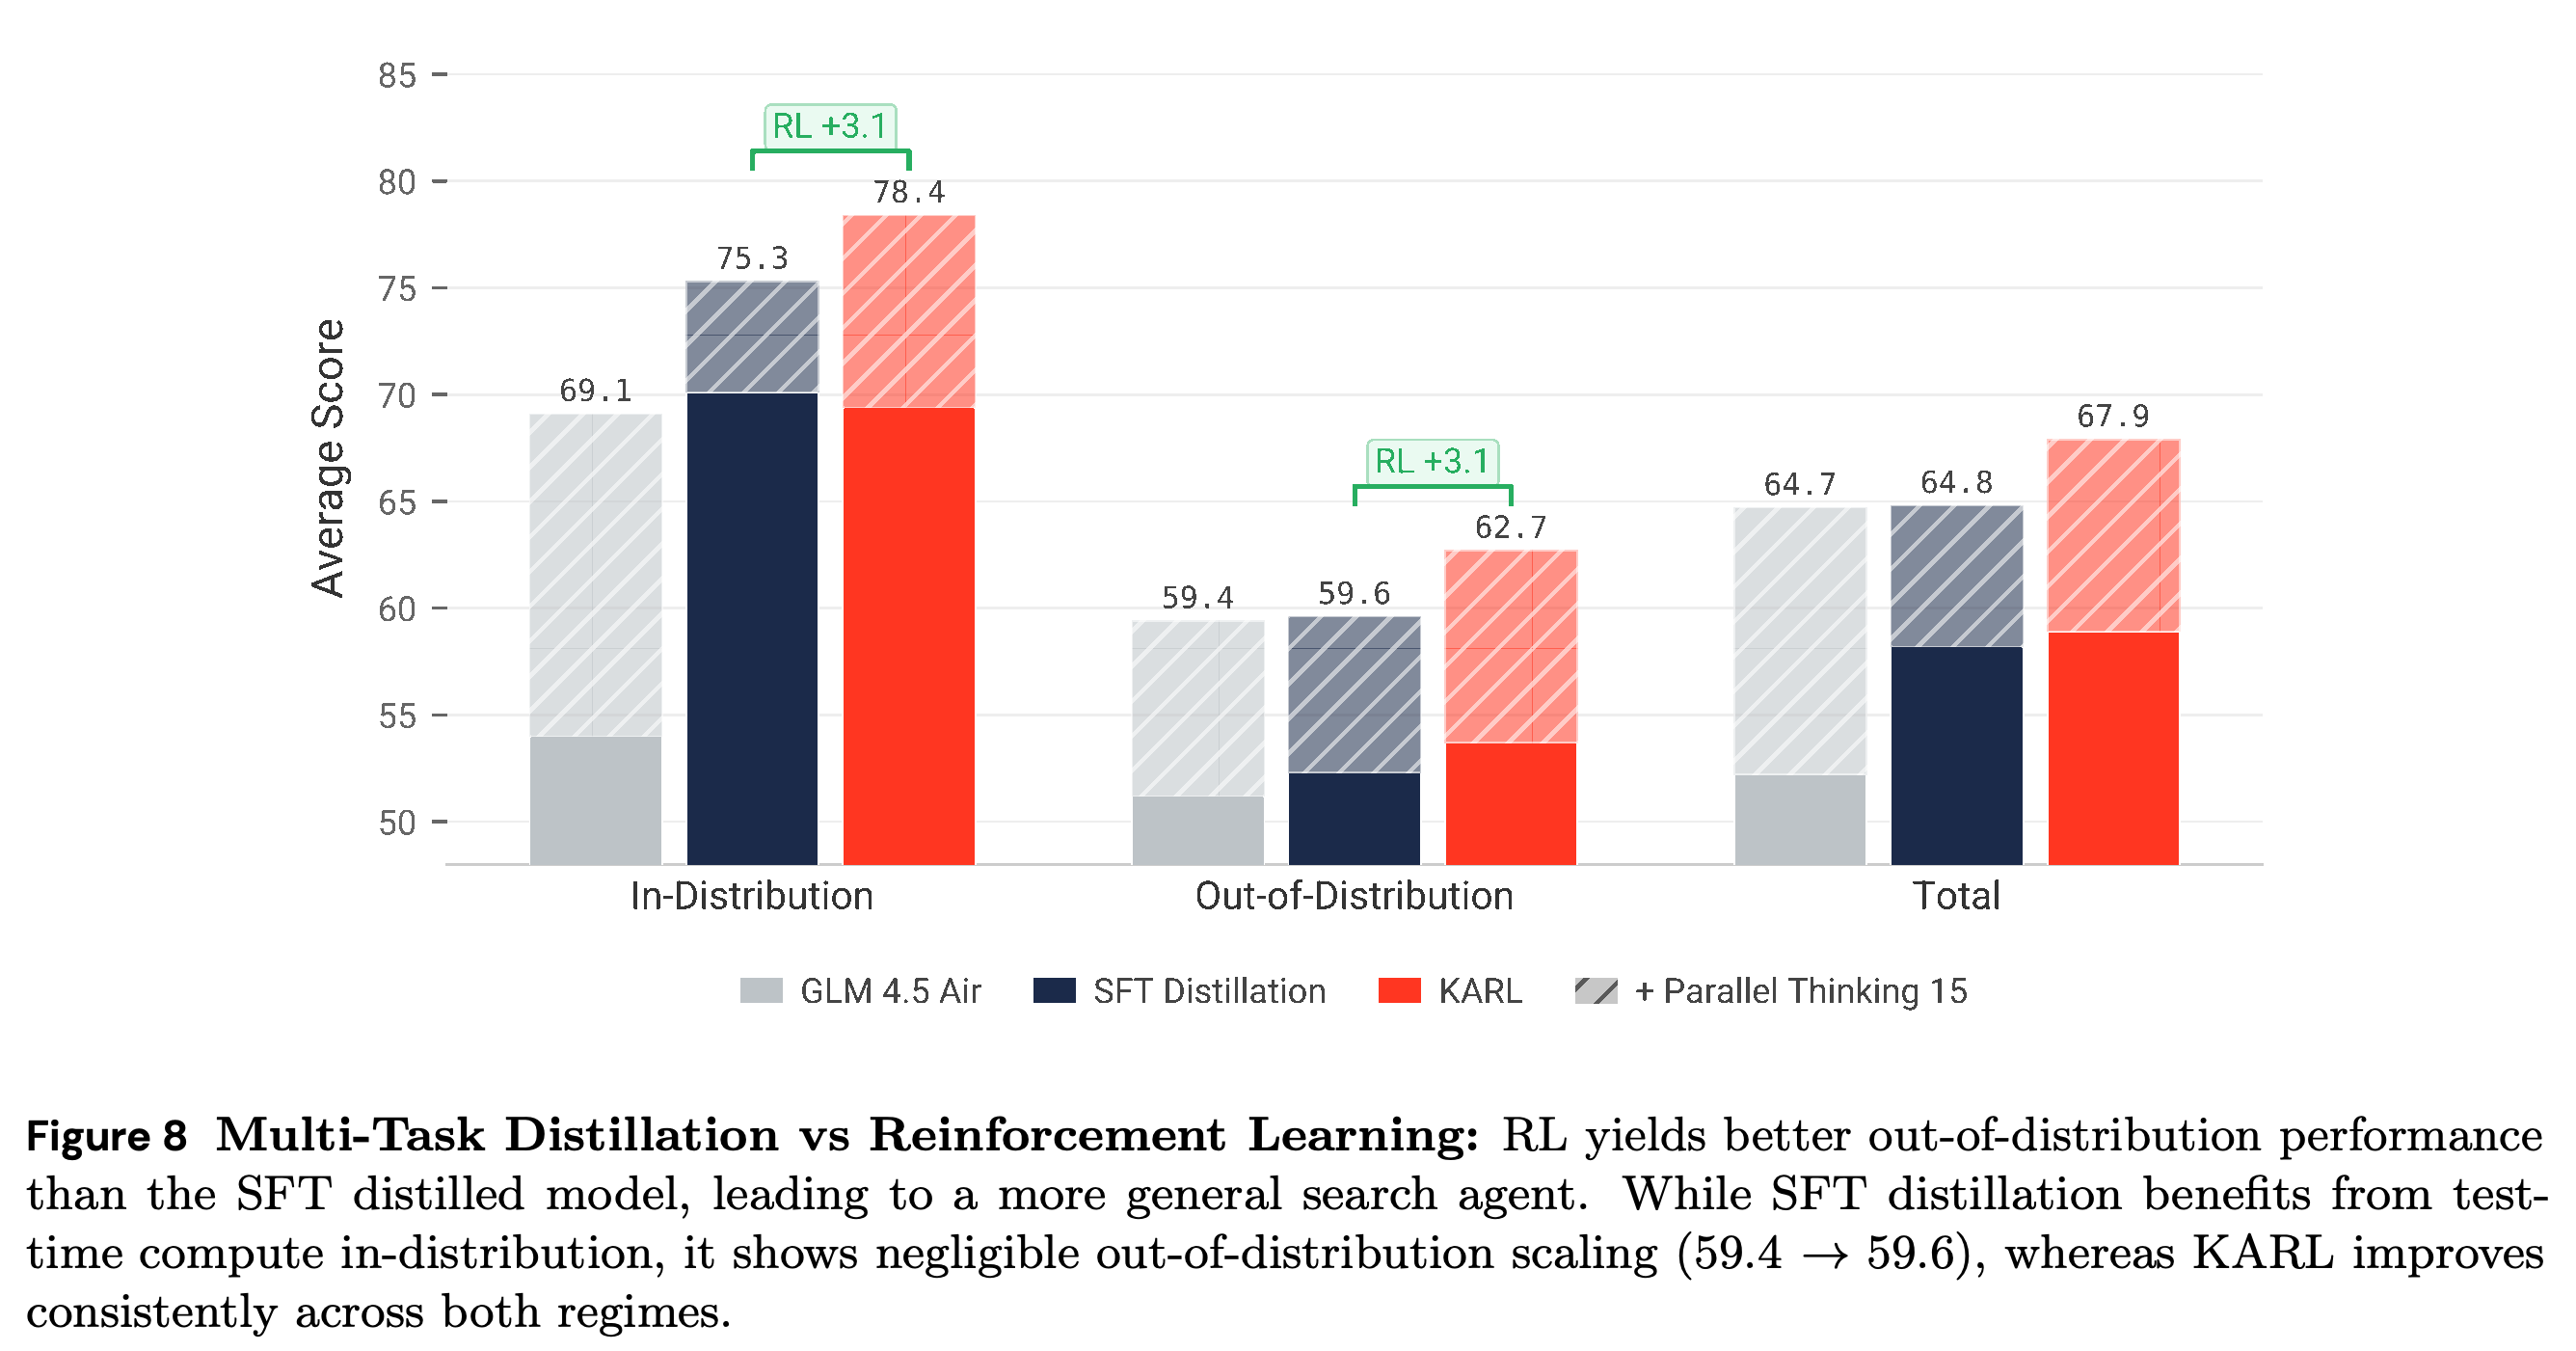
The SFT alternative distills 8 to 16 expert rollouts per prompt into GLM 4.5 Air. Figure 8 reports SFT OOD performance of 59.4 without parallel thinking and 59.6 with 15 parallel trajectories, whereas KARL reaches 62.7 at the same parallel budget.
- Without parallel thinking, SFT’s reported total 64.7 and OOD 59.4 exceed KARL’s 58.9 and 53.7. The evidence favors RL’s parallel-scaling behavior, not unconditional superiority over distillation.
- At the parallel setting, KARL scores 78.4 in-distribution and 67.9 overall, compared with SFT’s 75.3 and 64.8. Its OOD advantage is 3.1 points.
- Figure 8’s reported SFT total of 64.7 does not equal the six-task mean implied by its 69.1 in-distribution and 59.4 OOD averages. The PDF does not explain this aggregate discrepancy.
SFT has higher single-rollout OOD performance, but changes only from 59.4 to 59.6 with parallel thinking; KARL reaches 62.7 at that setting. This supports a scaling advantage for RL. The displayed SFT total of 64.7 is inconsistent with the six-task mean implied by its in-distribution and OOD averages.
7.3.4 Multi-Iteration Training
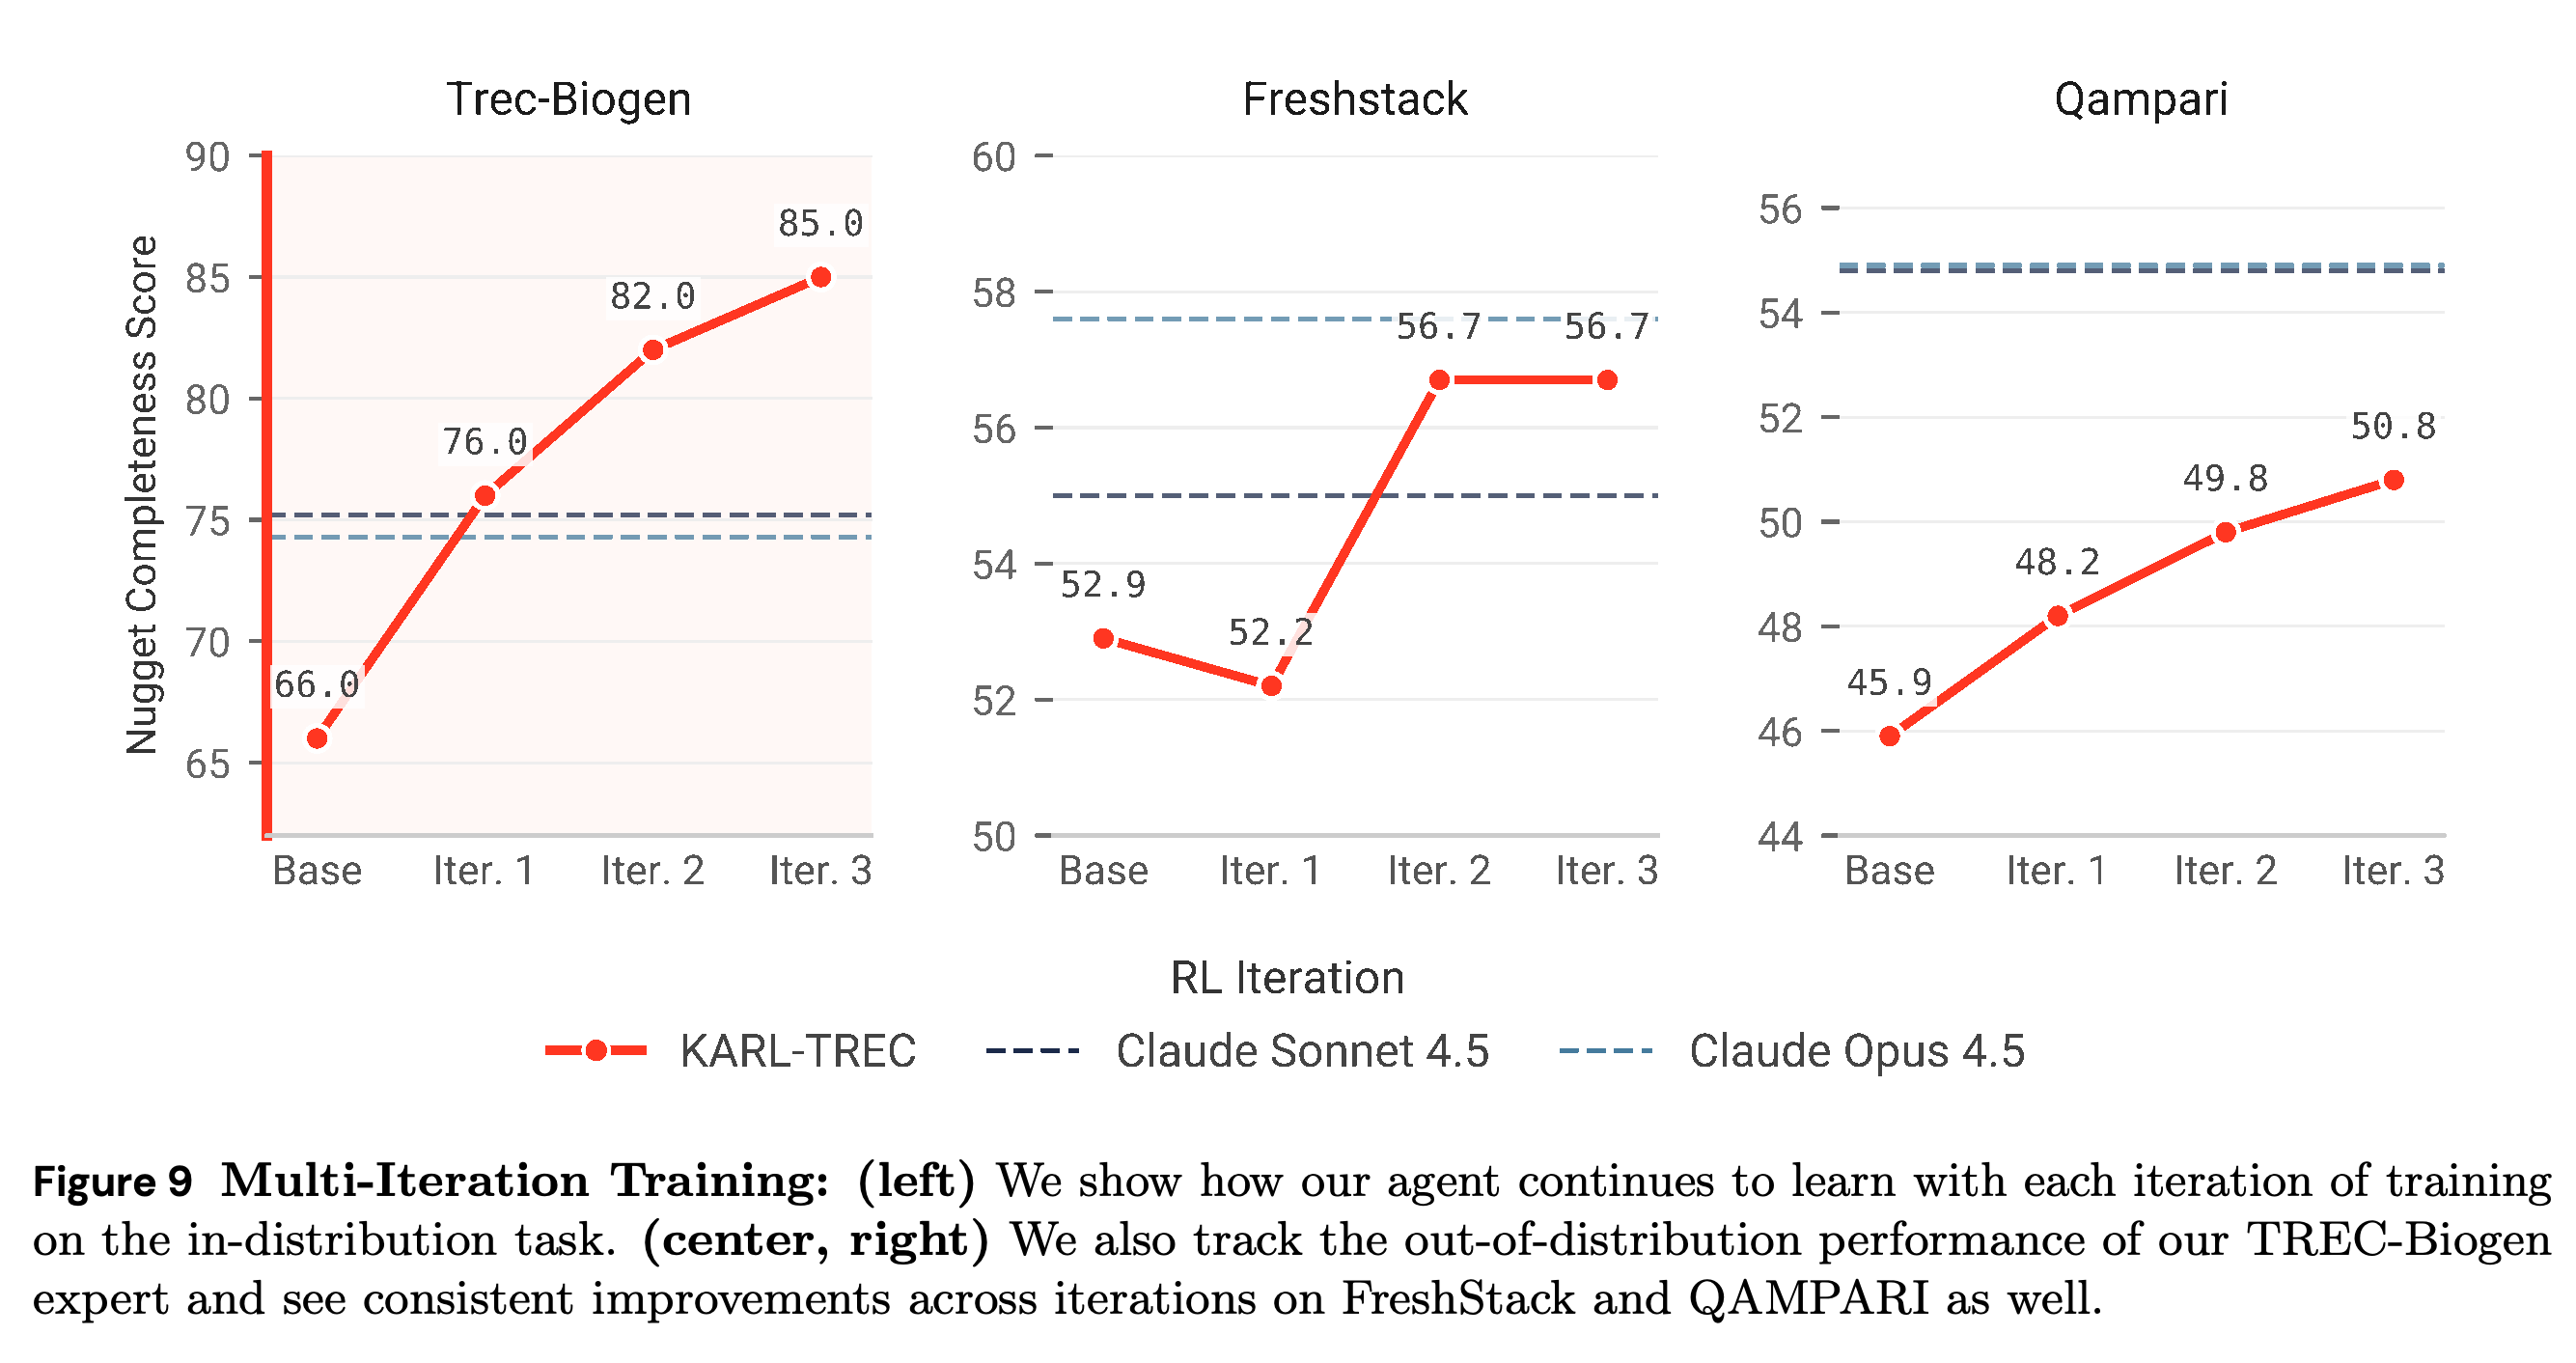
KARL-TREC provides a three-iteration case study of iterative offline training. Figure 9 reports TREC-Biogen scores of 66.0, 76.0, 82.0, and 85.0 from the base model through Iter. 3.
- QAMPARI rises from 45.9 to 48.2, 49.8, and 50.8. FreshStack initially drops from 52.9 to 52.2, then reaches 56.7 in Iter. 2 and remains there in Iter. 3.
- The results show transfer to selected held-out tasks, but neither monotonic improvement on every task nor continued gains beyond the tested iterations.
TREC-Biogen and QAMPARI improve each iteration. FreshStack initially drops from 52.9 to 52.2 and later plateaus at 56.7, so the curves do not support uniformly monotonic transfer across tasks.
7.3.5 RL Generalizes beyond Sharpening
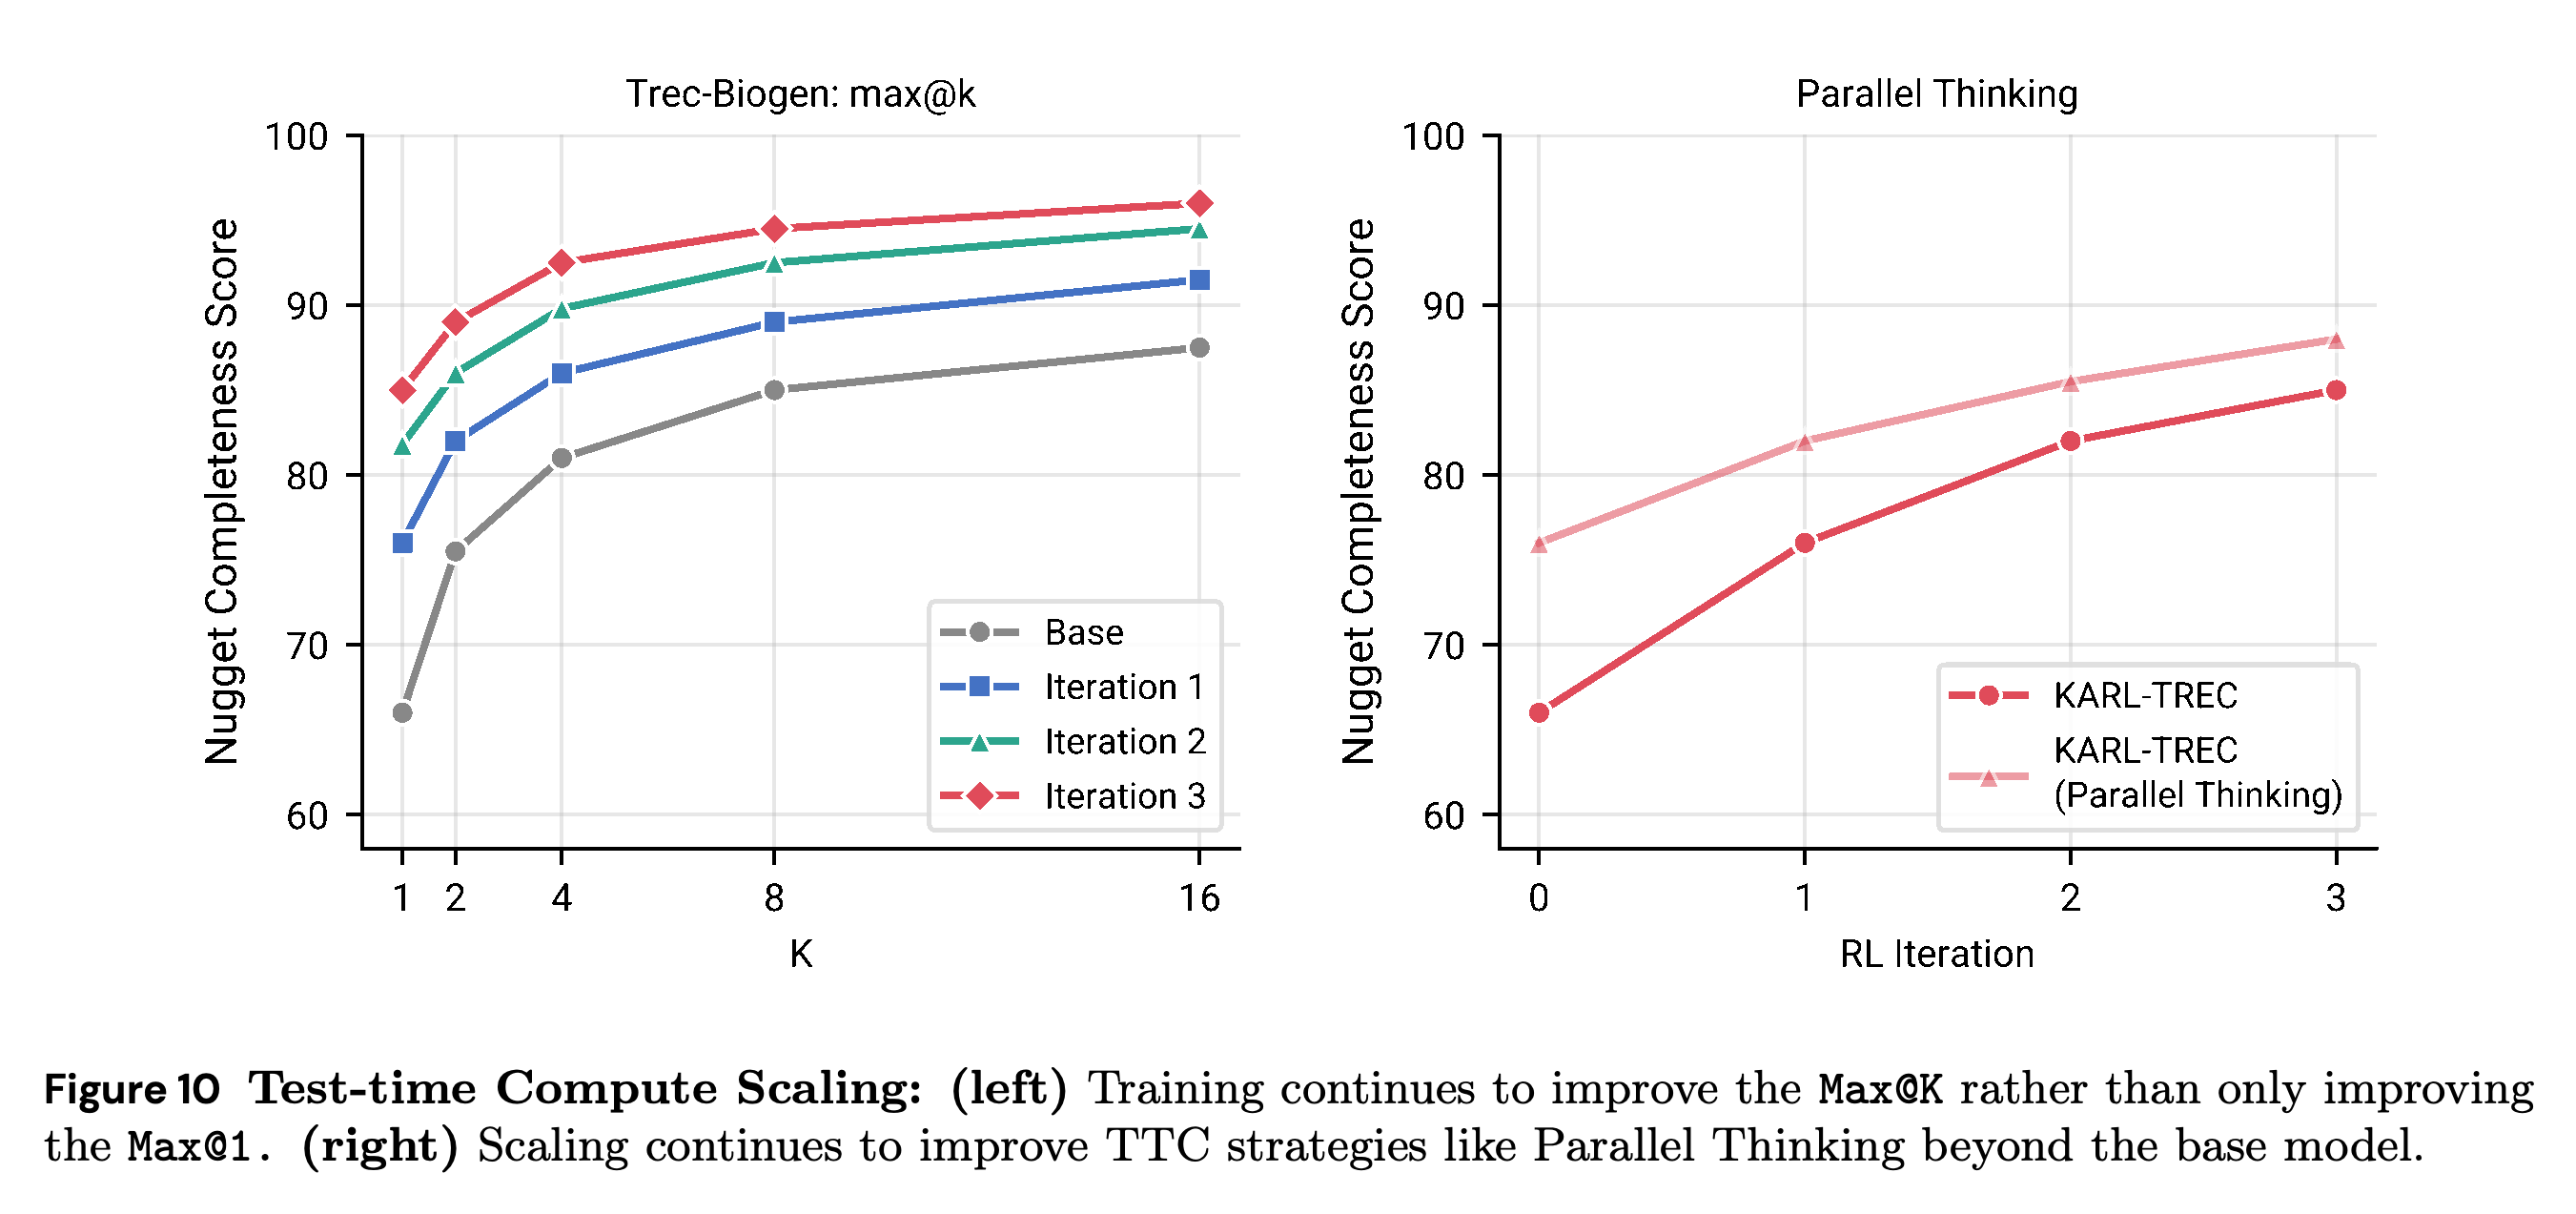
Figure 10 shows TREC-Biogen max@k improving across k = 1, 2, 4, 8, and 16 with successive RL iterations. After three iterations, max@1 approximately matches the base model’s max@8, and max@2 exceeds its max@16, supporting increased observed coverage at the tested sampling budgets.
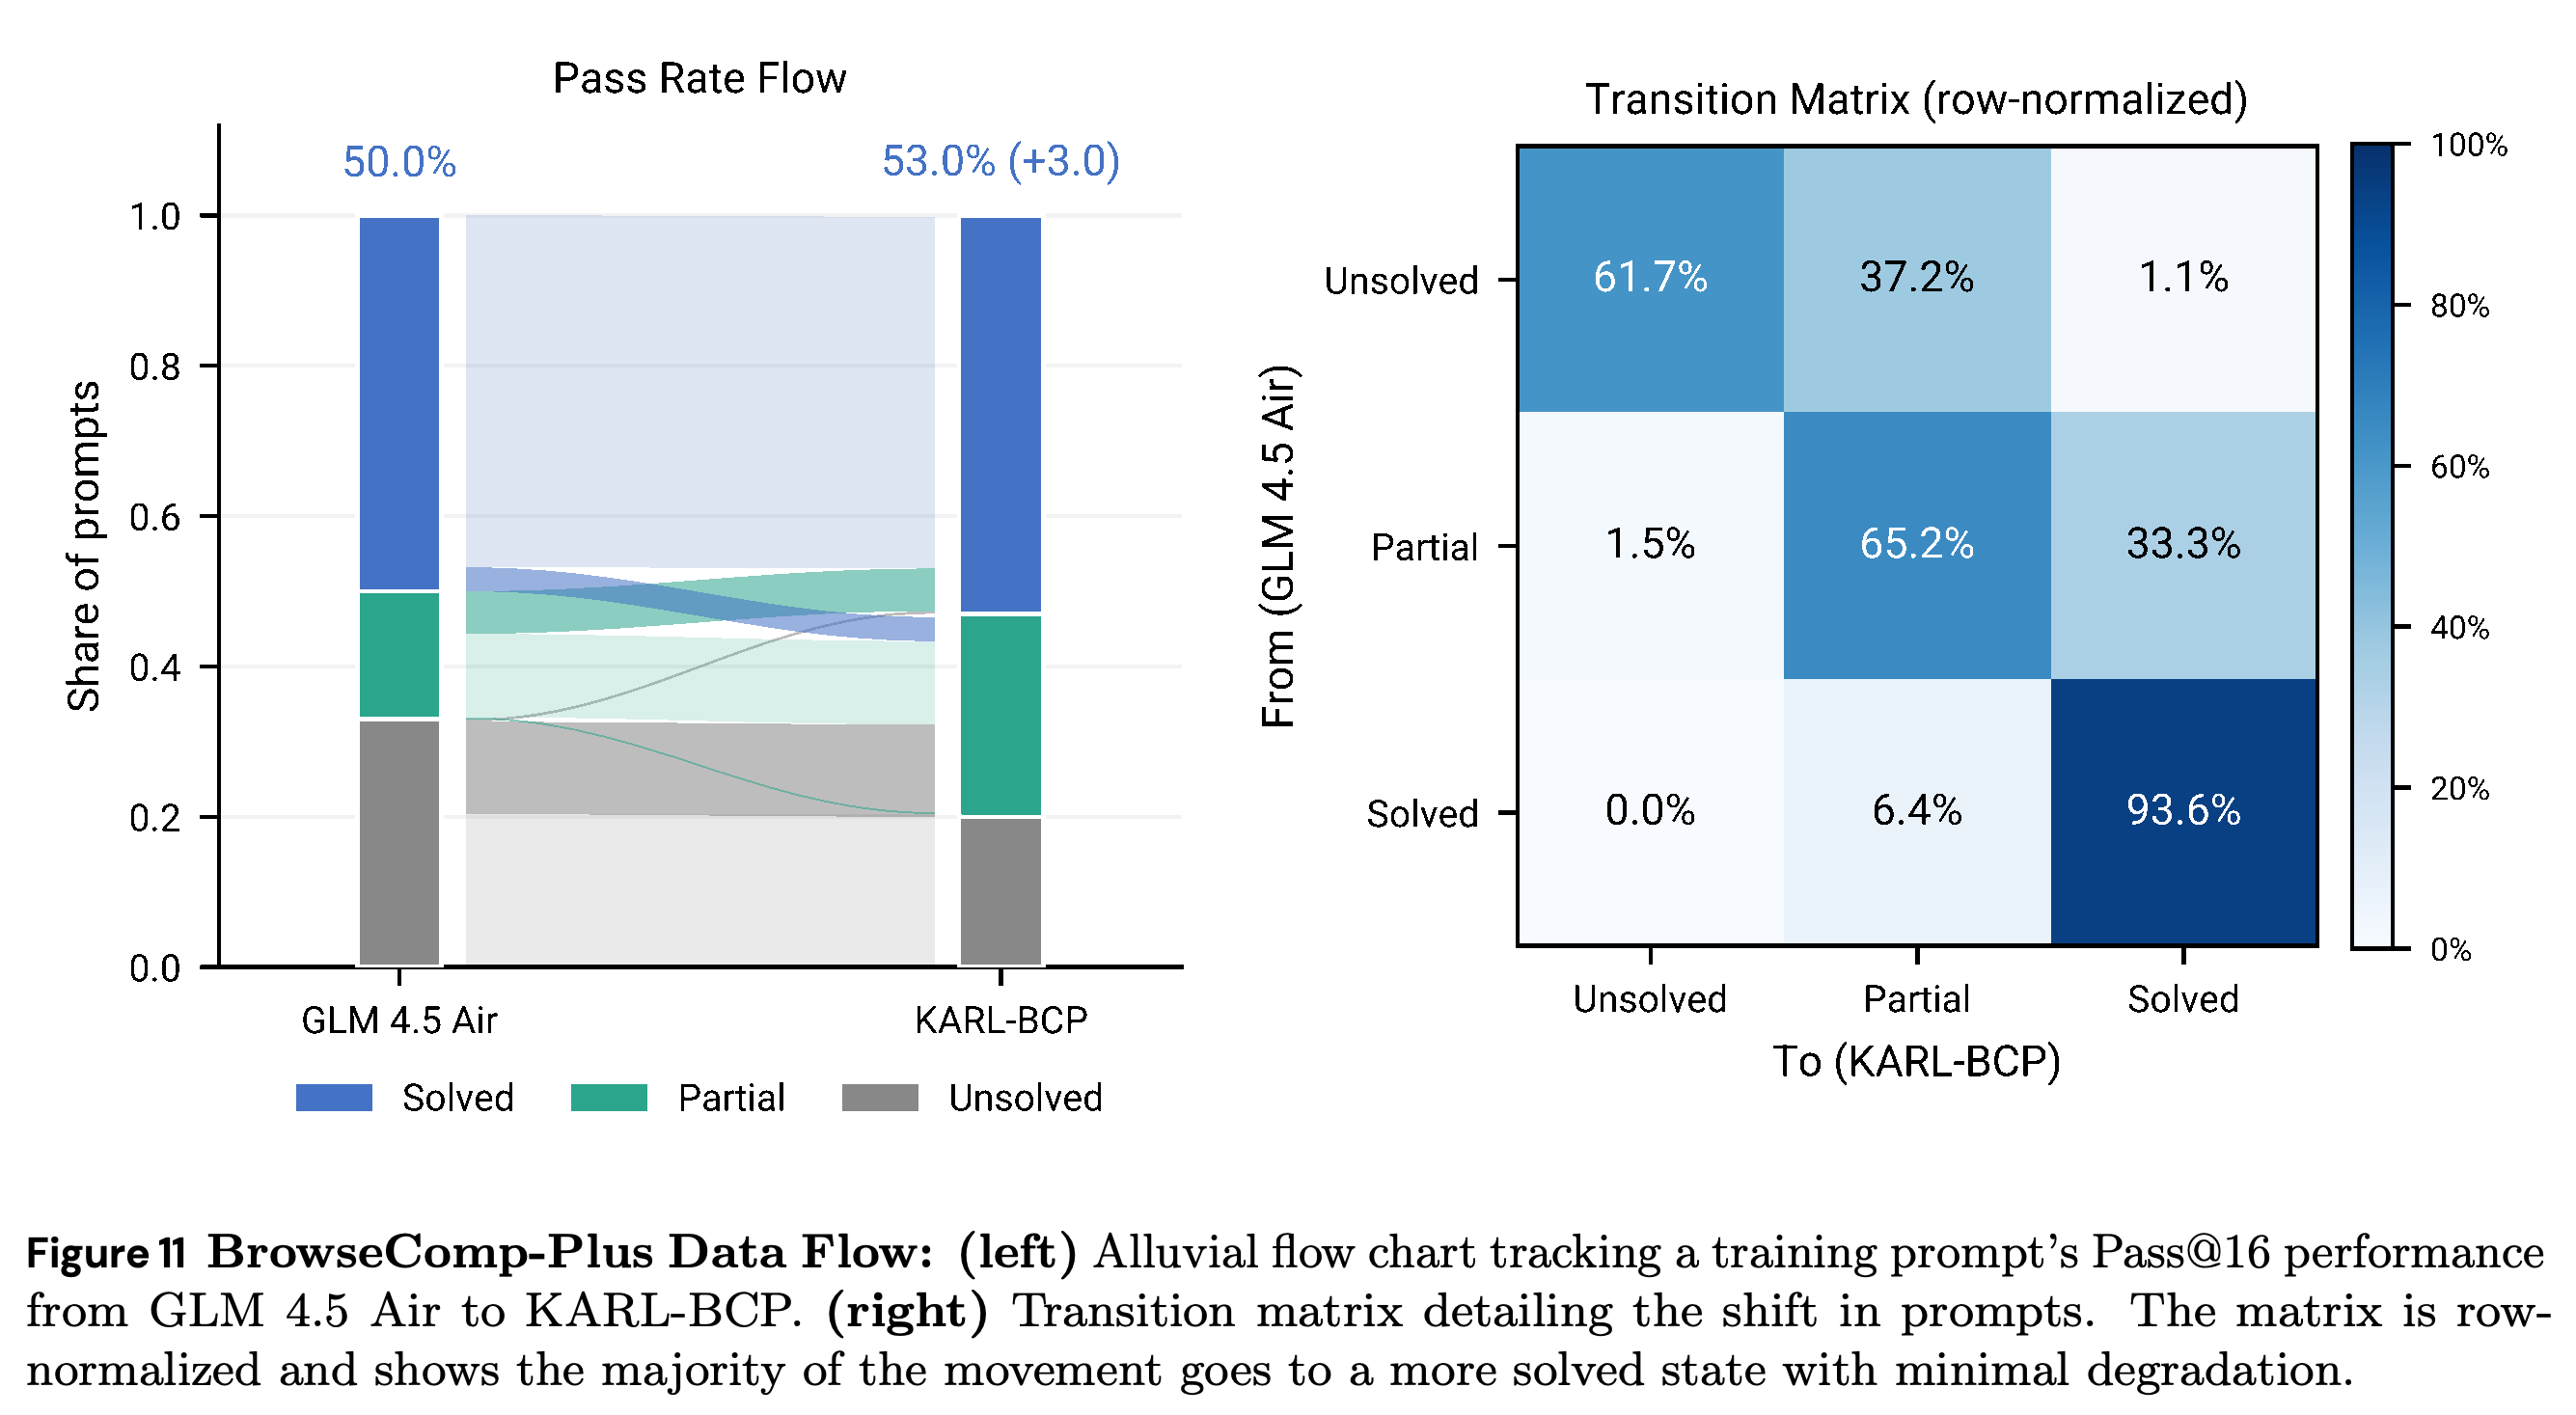
- Figure 11 tracks synthetic BrowseComp-Plus prompts using 16-attempt success categories: 33.3% of Partial prompts become Solved, and 37.2% of Unsolved prompts become Partial.
- Only 6.4% of Solved prompts become Partial and 0.0% become Unsolved. The paper states that Solved and Unsolved groups were excluded from optimization, making their transitions evidence of transfer beyond directly trained prompts.
- Finite-sample failure does not prove zero base-policy probability of a correct solution. These findings do not establish a definitive separation from every form of distribution sharpening.
The max@k curves rise across all tested sampling budgets, and parallel aggregation improves with training. These are gains in sampled maximum nugget-completion scores, not proof that correct responses had zero probability under the base policy.
The row-normalized matrix shows 37.2% of previously Unsolved prompts becoming Partial and 33.3% of Partial prompts becoming Solved. Improvements in groups excluded from optimization support transfer, while the finite 16-attempt categories remain sampling-dependent.
7.3.6 Training Ablations: Search Environment Generalization
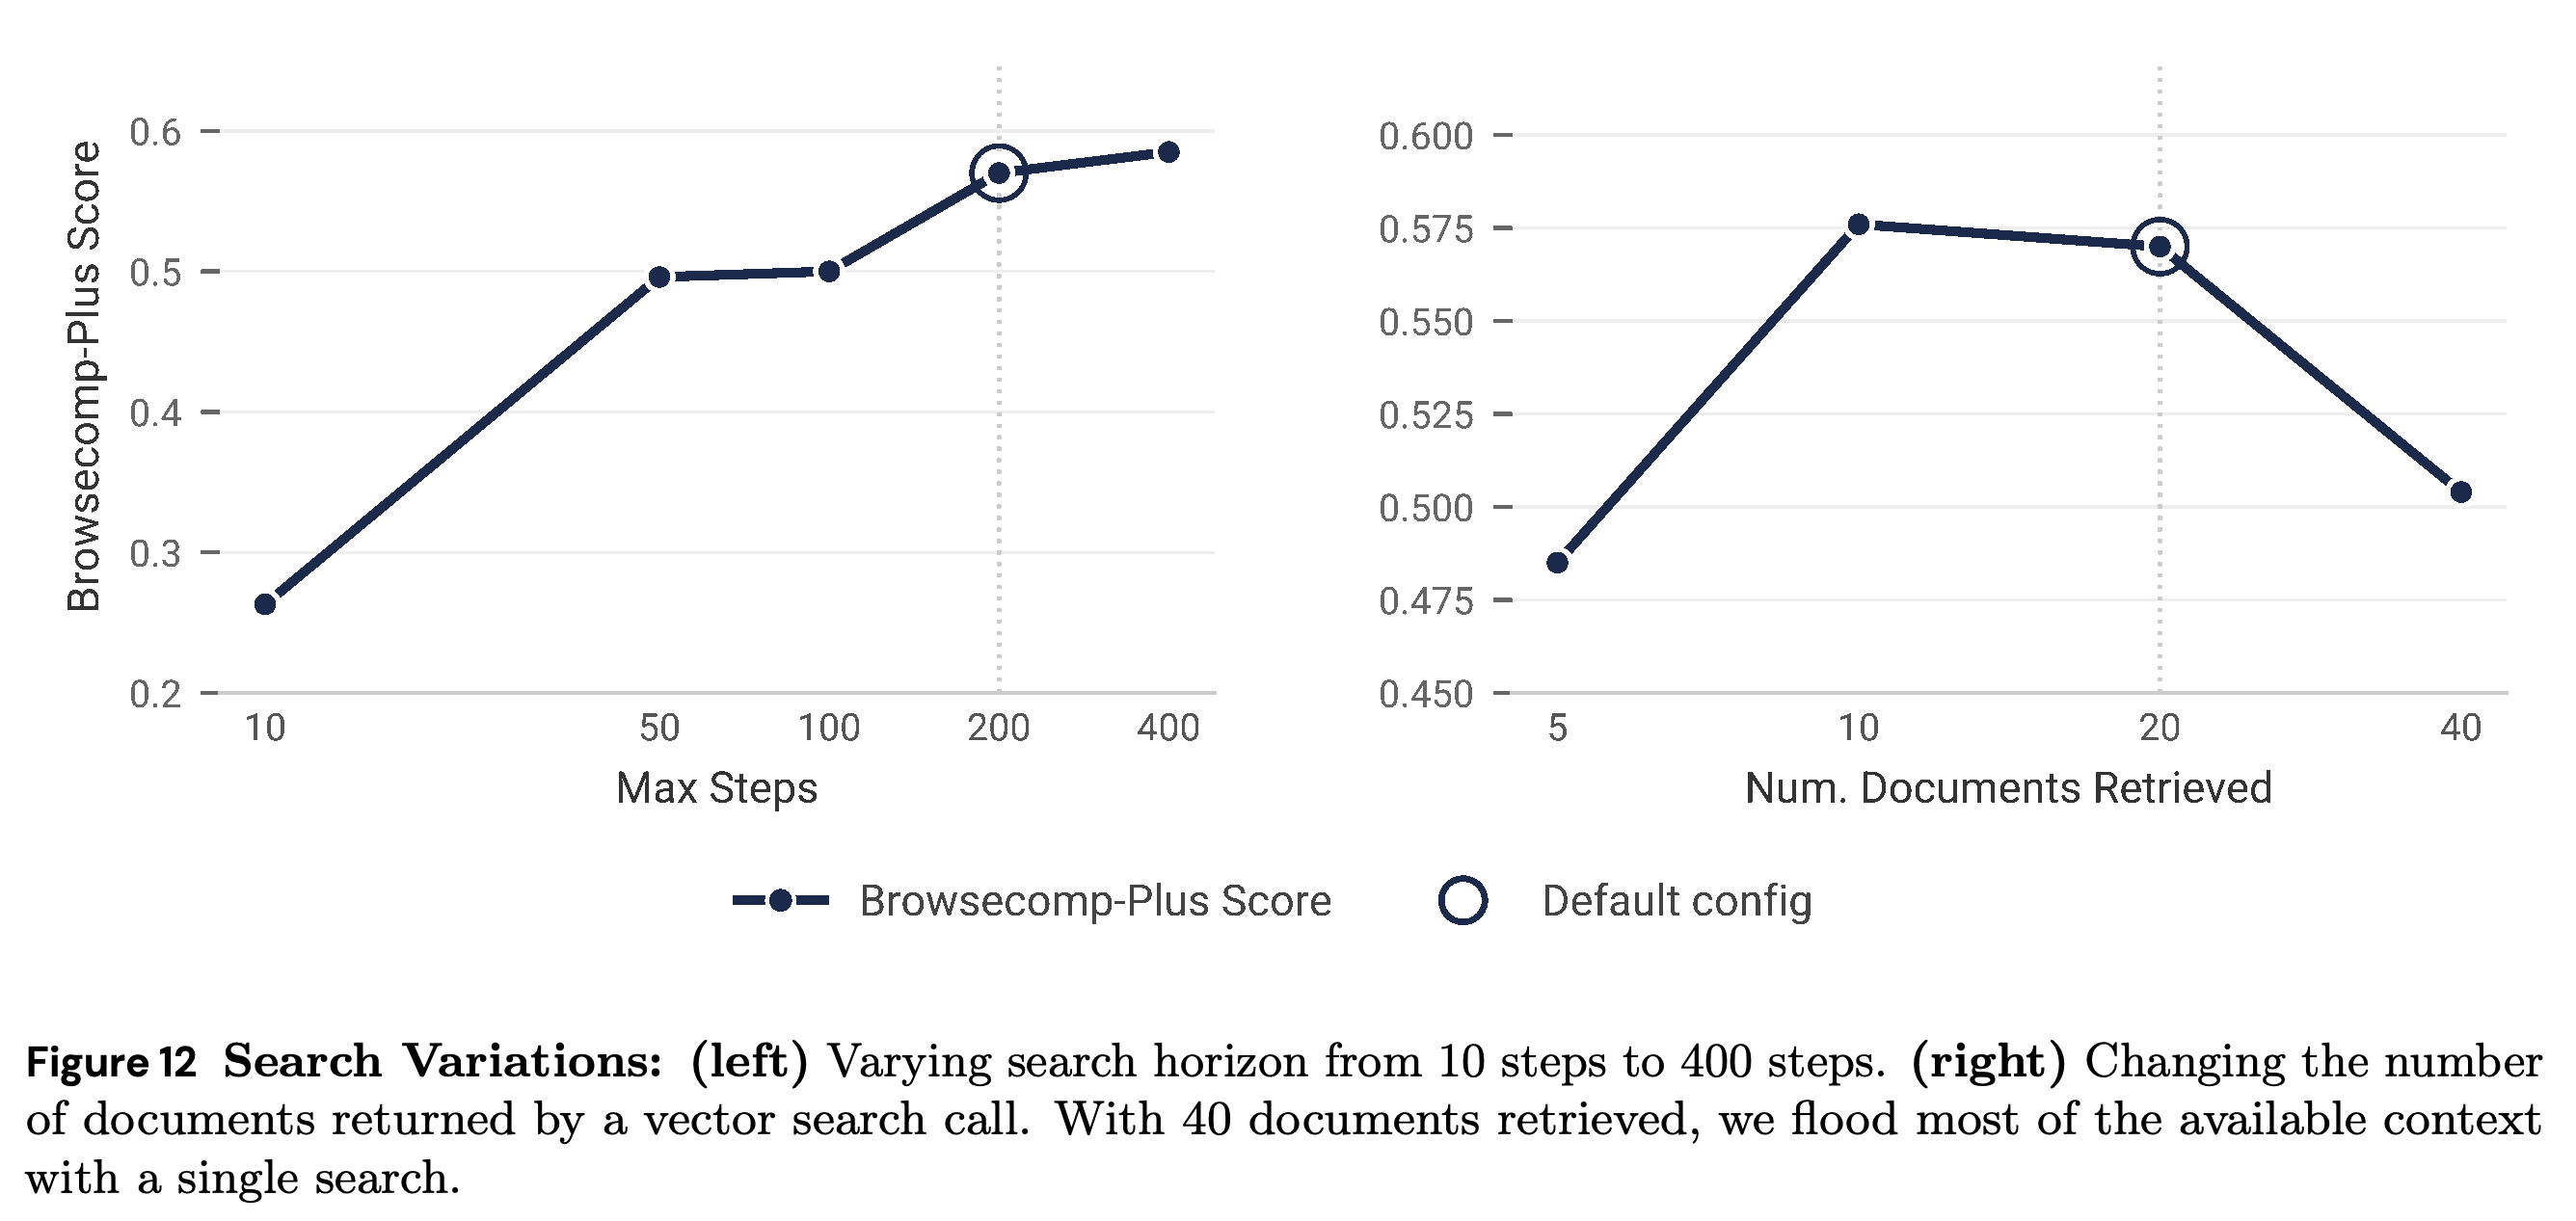
KARL-BCP performance improves as the step budget grows from 10 to 200 and largely plateaus through 400. Figure 12 shows similar performance with 10 to 20 retrieved documents but degradation at 40, which the authors attribute to retrieval crowding out multi-step reasoning context.
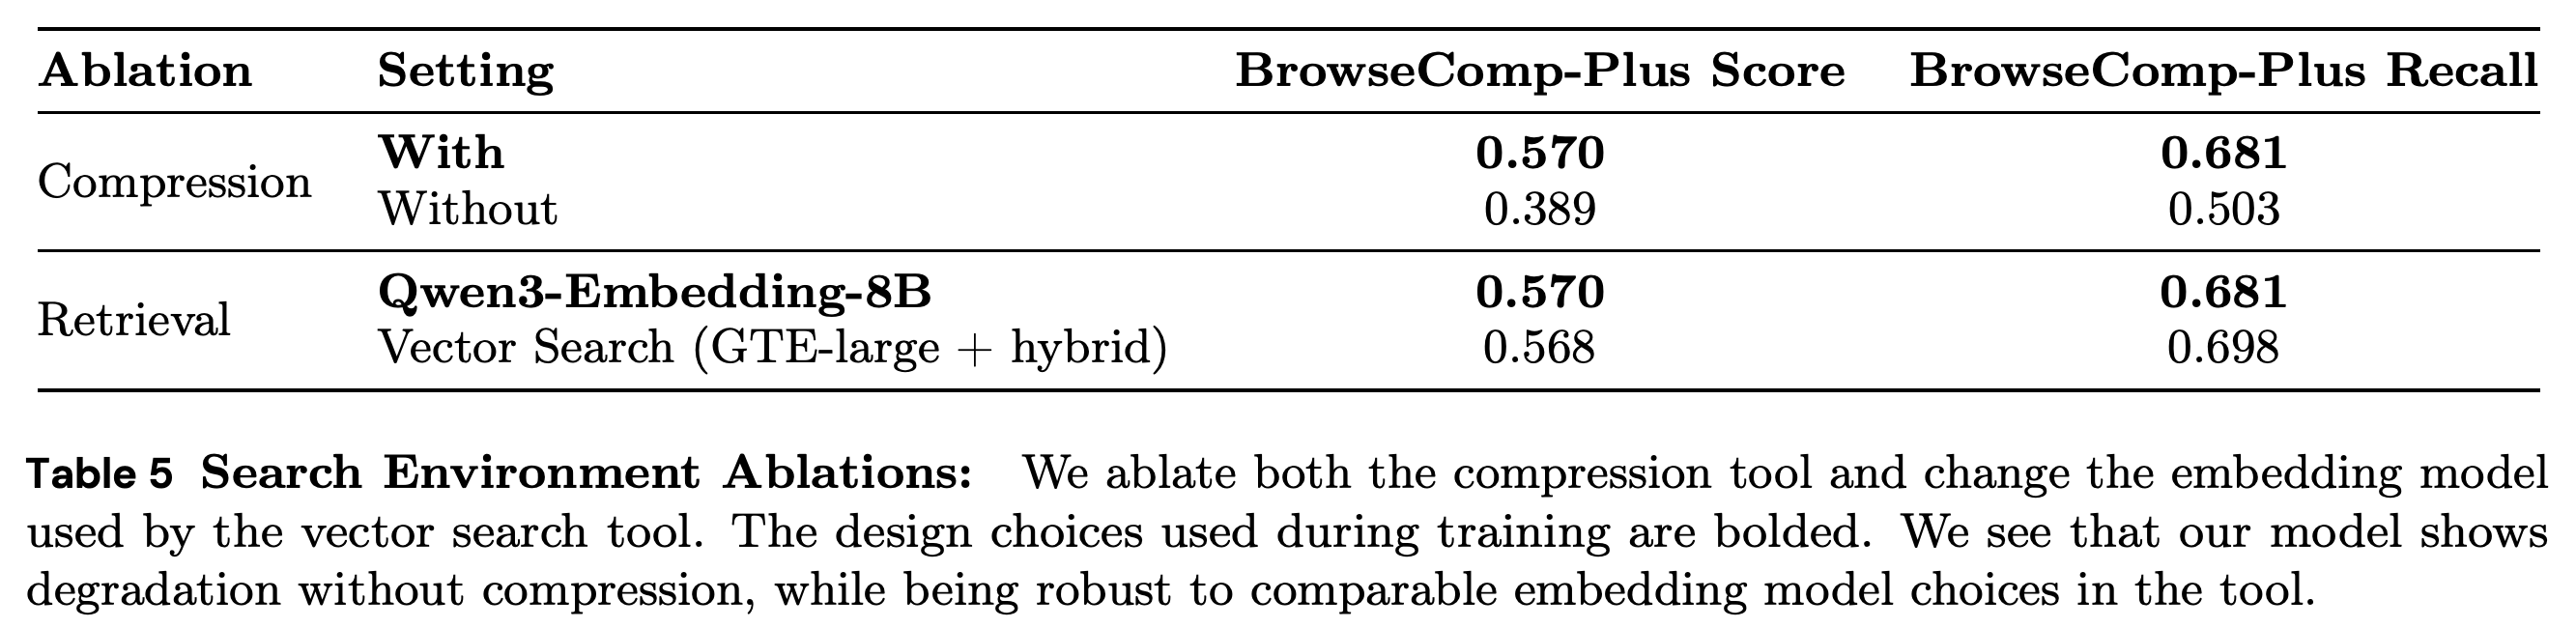
- Table 5 reports accuracy falling from 0.570 to 0.389 and recall from 0.681 to 0.503 without compression. Replacing Qwen3-Embedding-8B with GTE-large plus hybrid retrieval preserves accuracy at 0.568, with recall 0.698.
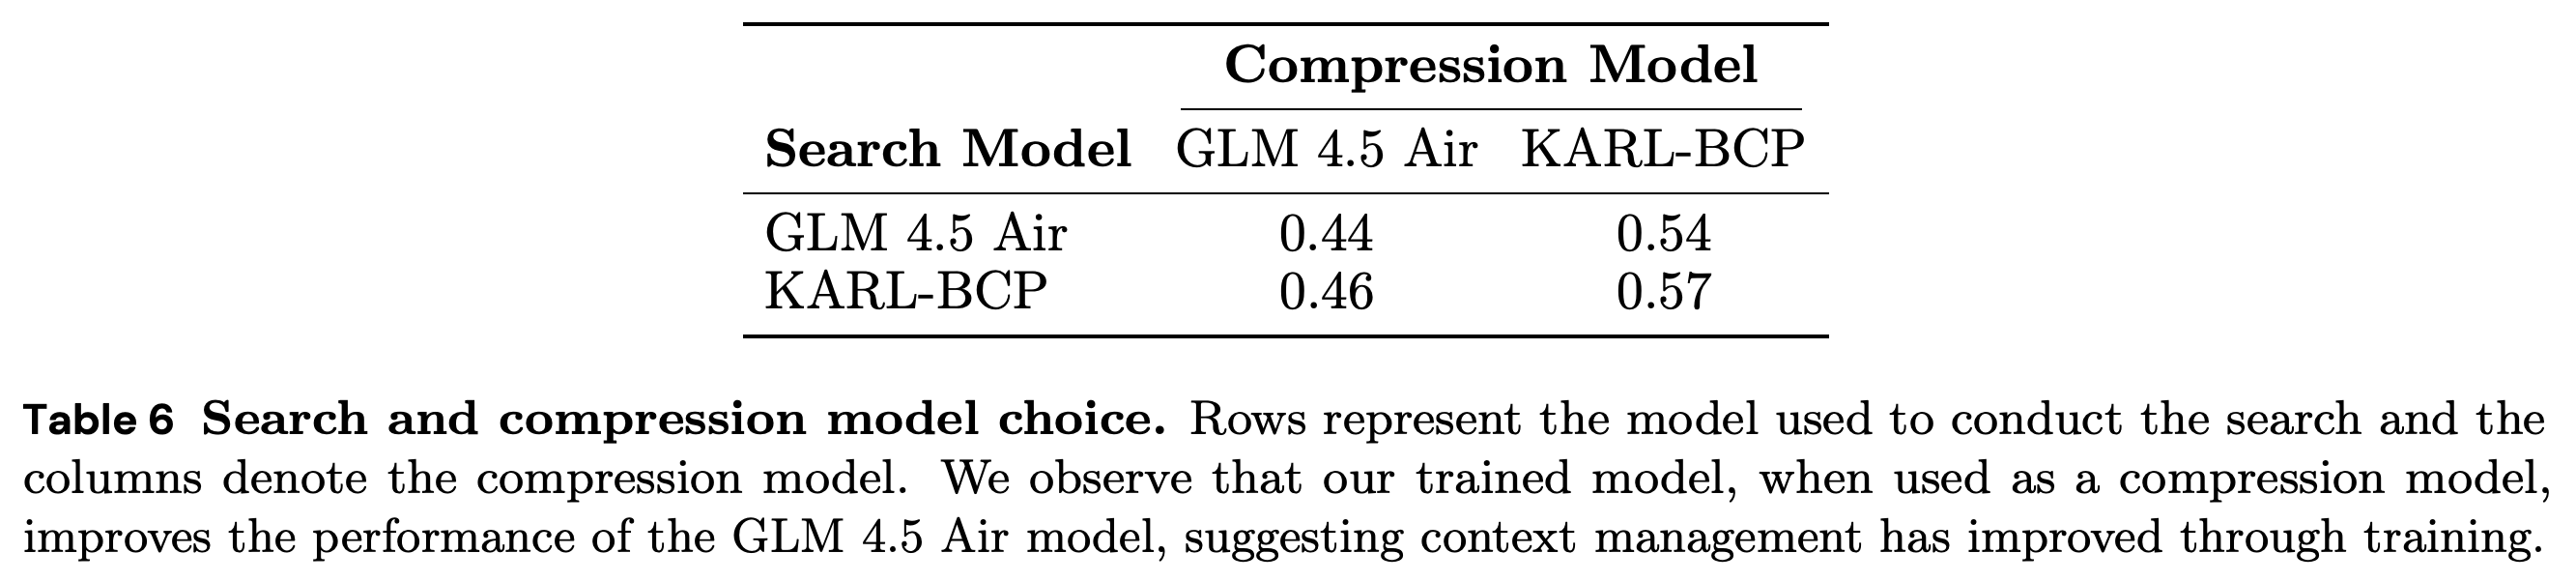
- Table 6 separates search and compression roles: replacing the base compressor with KARL-BCP raises base-search accuracy from 0.44 to 0.54 and KARL-BCP-search accuracy from 0.46 to 0.57.
- The cross-role experiment isolates improved compression as a contributor to task success. A single comparable retriever substitution supports limited environment robustness, not retriever-independent performance.
Removing compression lowers both accuracy and annotated-document recall. Substituting a comparable GTE-large hybrid retriever preserves accuracy, demonstrating robustness to this substitution rather than to arbitrary retrieval systems.
Larger search budgets help up to approximately 200 steps, with limited further gain through 400. Retrieving 40 documents per call lowers performance relative to 10 or 20, consistent with a trade-off between immediate evidence volume and space for multi-step reasoning.
Holding the search model fixed isolates the compressor’s contribution: KARL-BCP compression raises accuracy for both base and trained search models. The gain from changing only the compressor provides direct evidence that learned context management contributes to final task success.
7.4 Test-Time Compute Experiments
The test-time experiments distinguish Majority Voting (MV), Weighted Majority Voting (WMV), Best-of-N (BoN), and generative aggregation. MV counts answers equally, WMV weights votes by a learned score, and BoN returns the highest-scoring candidate; generative aggregation can combine complementary content into a new response.
- MV and WMV require discrete answer equivalence classes. Generative aggregation is used for open-ended responses where candidate answers cannot be grouped naturally.
7.4.1 Parallel Thinking
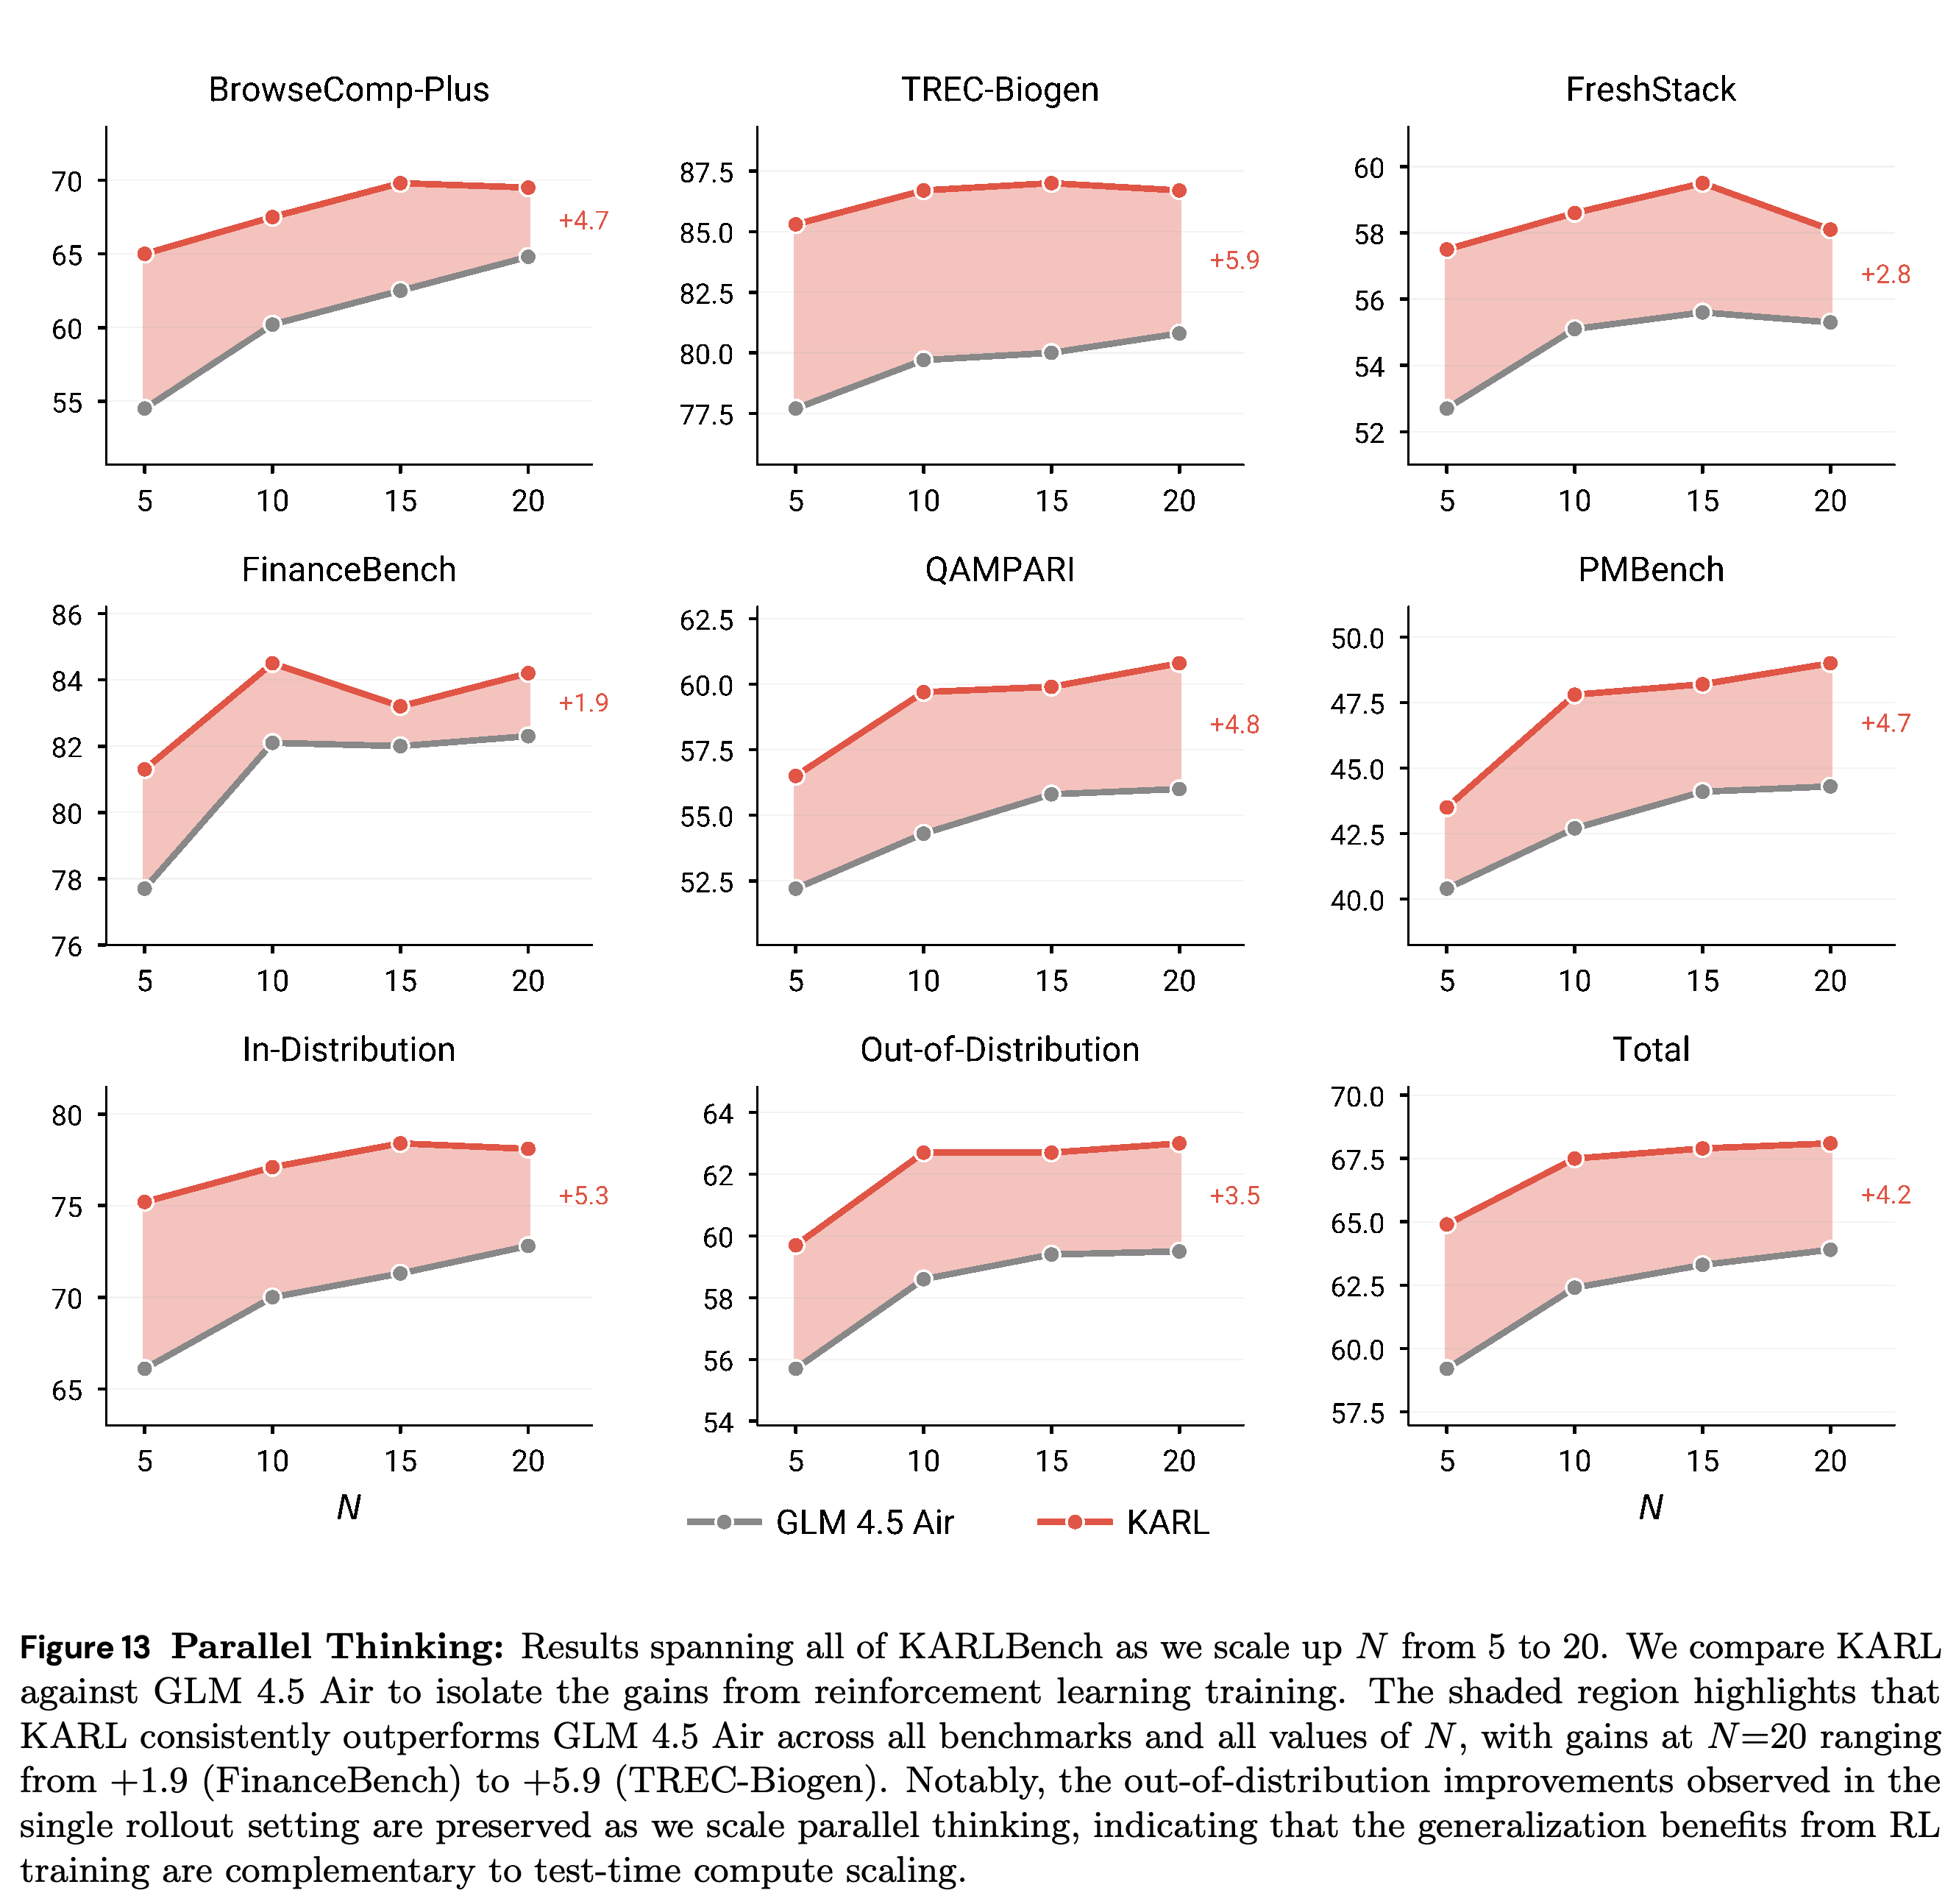
Figure 13 compares KARL and GLM 4.5 Air as parallel thinking scales from N = 5 to N = 20. KARL remains ahead across all six tasks and tested budgets, with a total advantage of +4.2 at N = 20.
- The N = 20 task advantages range from +1.9 on FinanceBench to +5.9 on TREC-Biogen. Returns diminish beyond N = 15, and some task curves decline, so scaling is not uniformly monotonic.
- The authors propose candidate-quality saturation and growing aggregator context as explanations, but do not independently test these mechanisms.
- Table 7 reports mean aggregation LLM turns of 3.7, 1.5, 1.3, 1.6, 2.0, and 2.1 at N = 10 for BrowseComp-Plus, TREC-Biogen, FreshStack, FinanceBench, QAMPARI, and PMBench respectively. Their reported aggregation rollout token lengths are 32156, 9641, 14678, 15105, 8128, and 20444.
KARL stays above GLM 4.5 Air at every tested parallel budget on all six tasks. Several task curves flatten or decline at larger budgets, showing that RL and parallel thinking can be complementary without guaranteeing monotonic scaling.
Aggregation adds few LLM turns, with BrowseComp-Plus highest at 3.7 on average. The reported token lengths remain substantial and task-dependent, so a low turn count should not be interpreted as negligible aggregation cost.

7.4.2 Value-Guided Search (VGS)
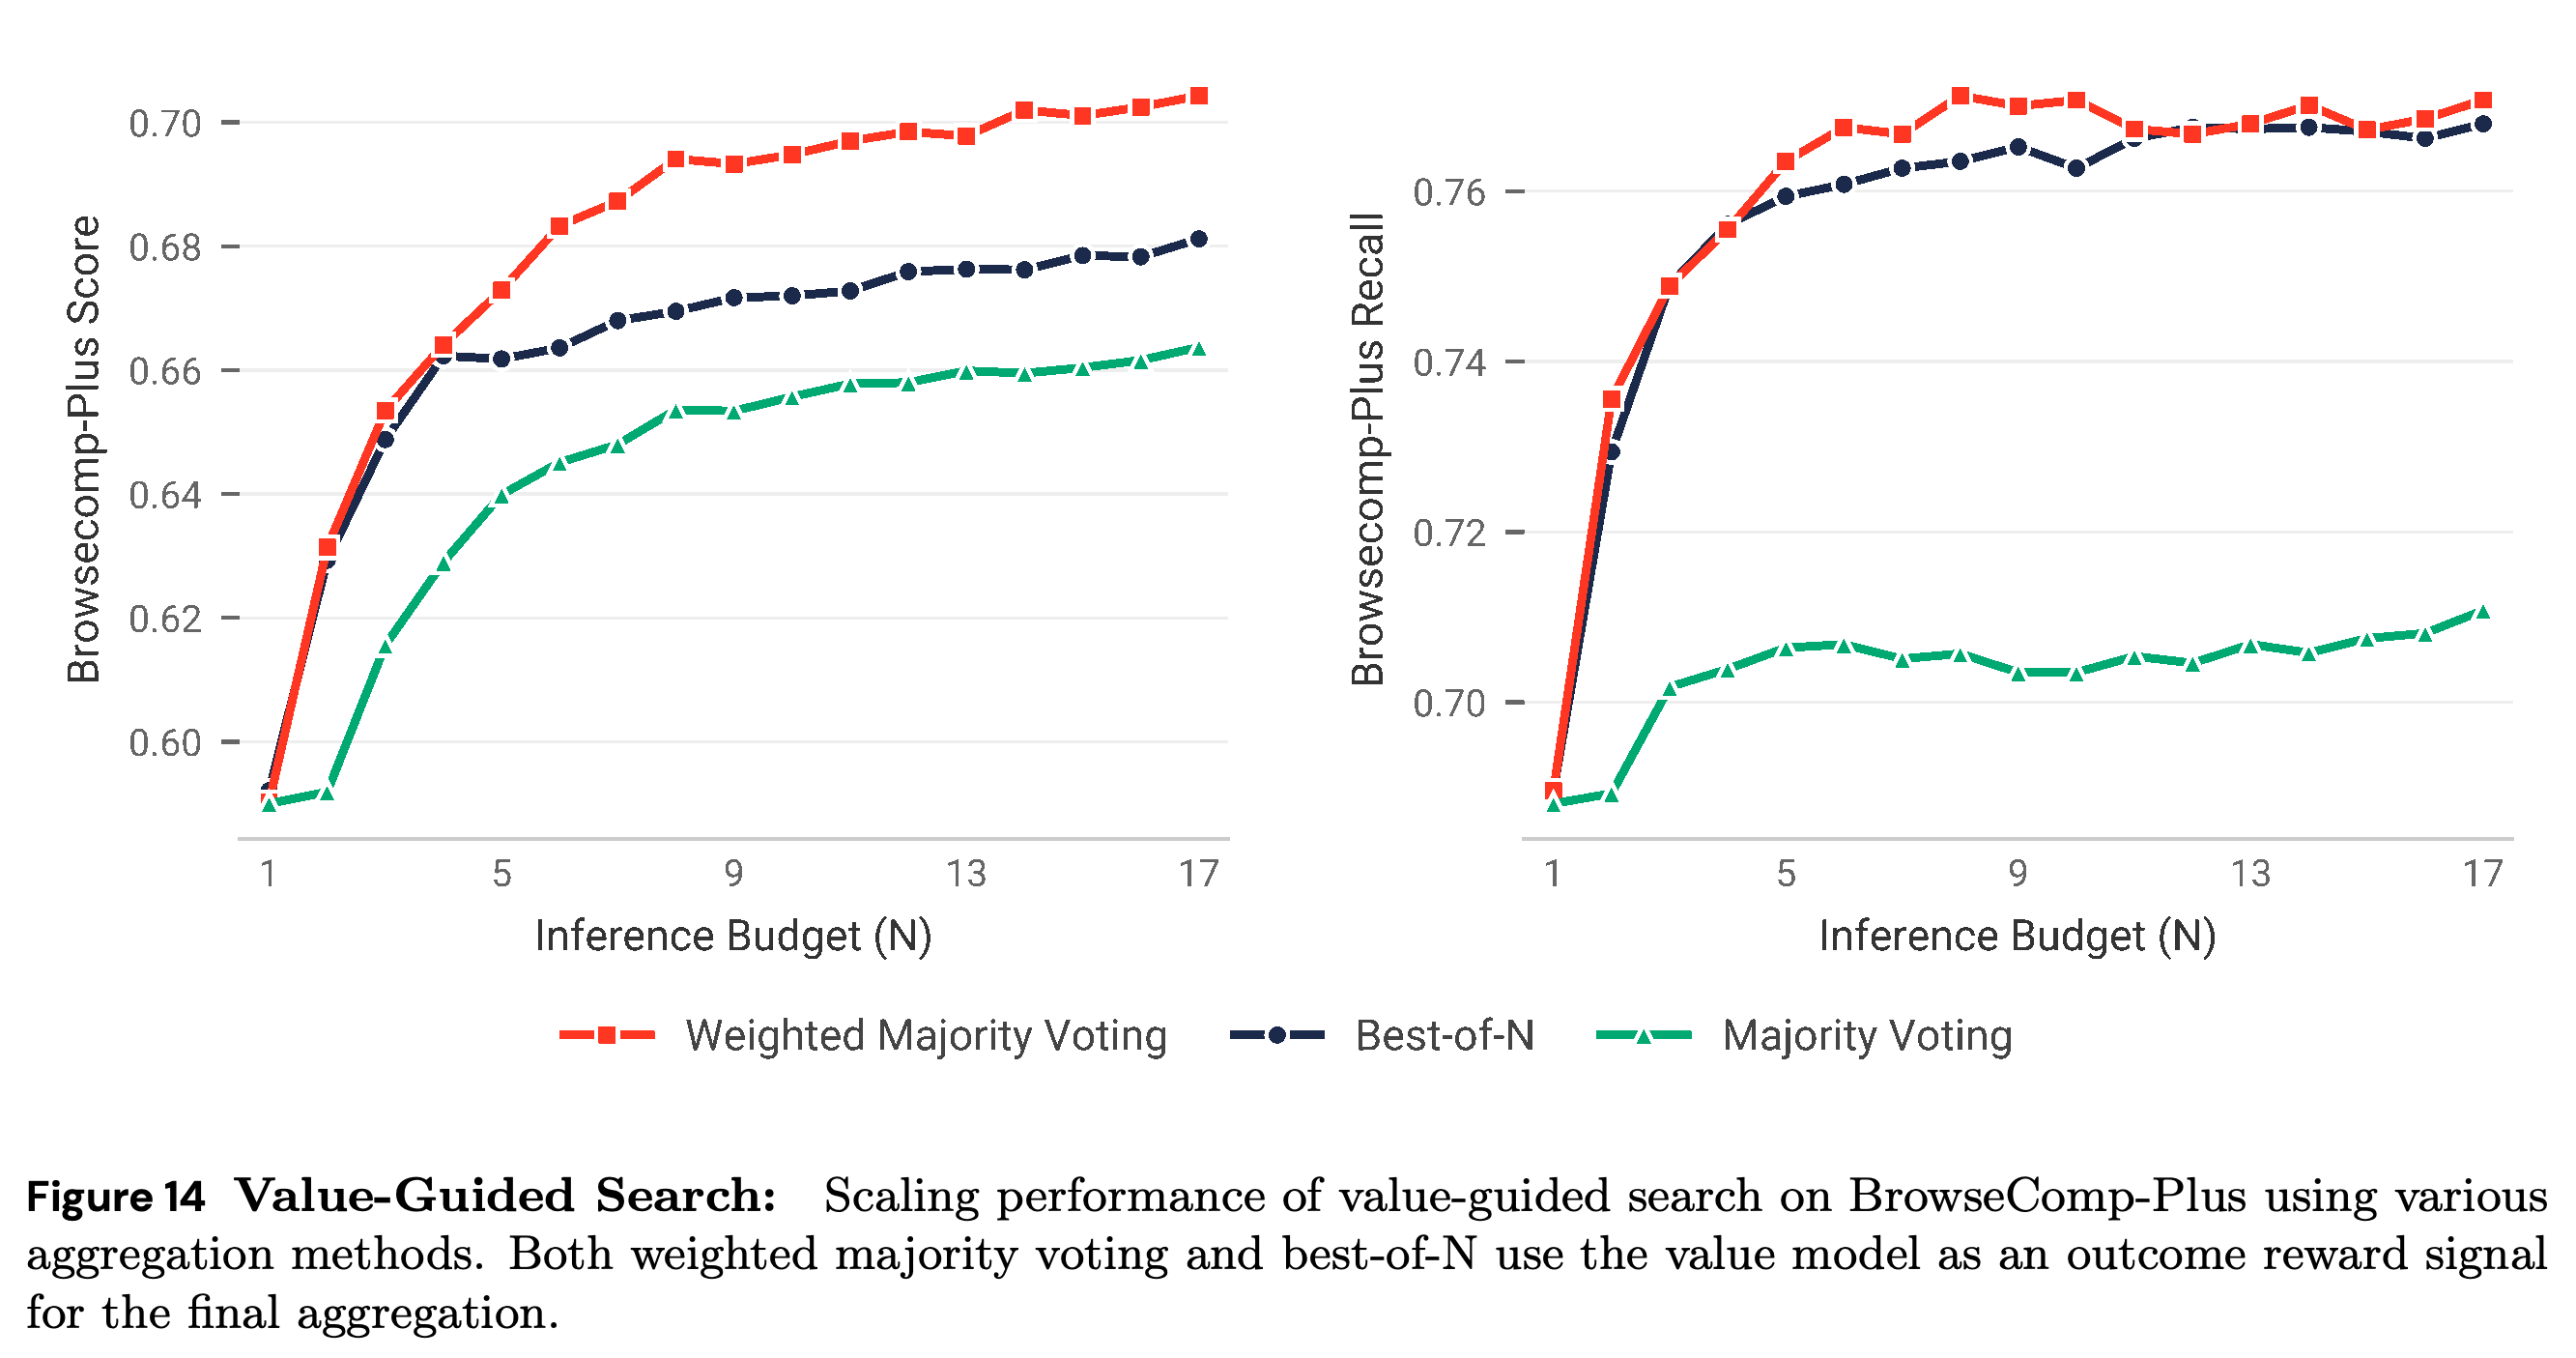
VGS is evaluated on KARL-BCP with branch size two and increasing numbers of parallel search processes. Figure 14 shows WMV achieving the highest answer accuracy, reaching 70.4 on BrowseComp-Plus at N = 17.
- WMV and BoN also yield higher selected-output document recall than unweighted MV, despite the value model being trained on answer success rather than recall. This comparison does not isolate the effect of step-level VGS against an otherwise identical no-VGS policy.
- The result uses a BrowseComp-Plus expert and a task-specific value model. Transfer of that value model across all six KARLBench regimes is not evaluated.
Weighted majority voting reaches the highest answer accuracy, 70.4 at N = 17. WMV and BoN select outputs with higher document recall than unweighted MV, although the value model was trained on answer success; all compared strategies operate within the VGS experiment.
8.1 Quantitative Behavioral Analysis
The paper examines RL’s impact through quantitative trajectory measurements and qualitative case studies. The quantitative analysis relates trajectory length, search diversity, retrieval status, and answer accuracy on synthetic data and evaluation questions to changes in evidence acquisition and stopping behavior.
8.1.1 Quantitative Analysis on Synthetic Data
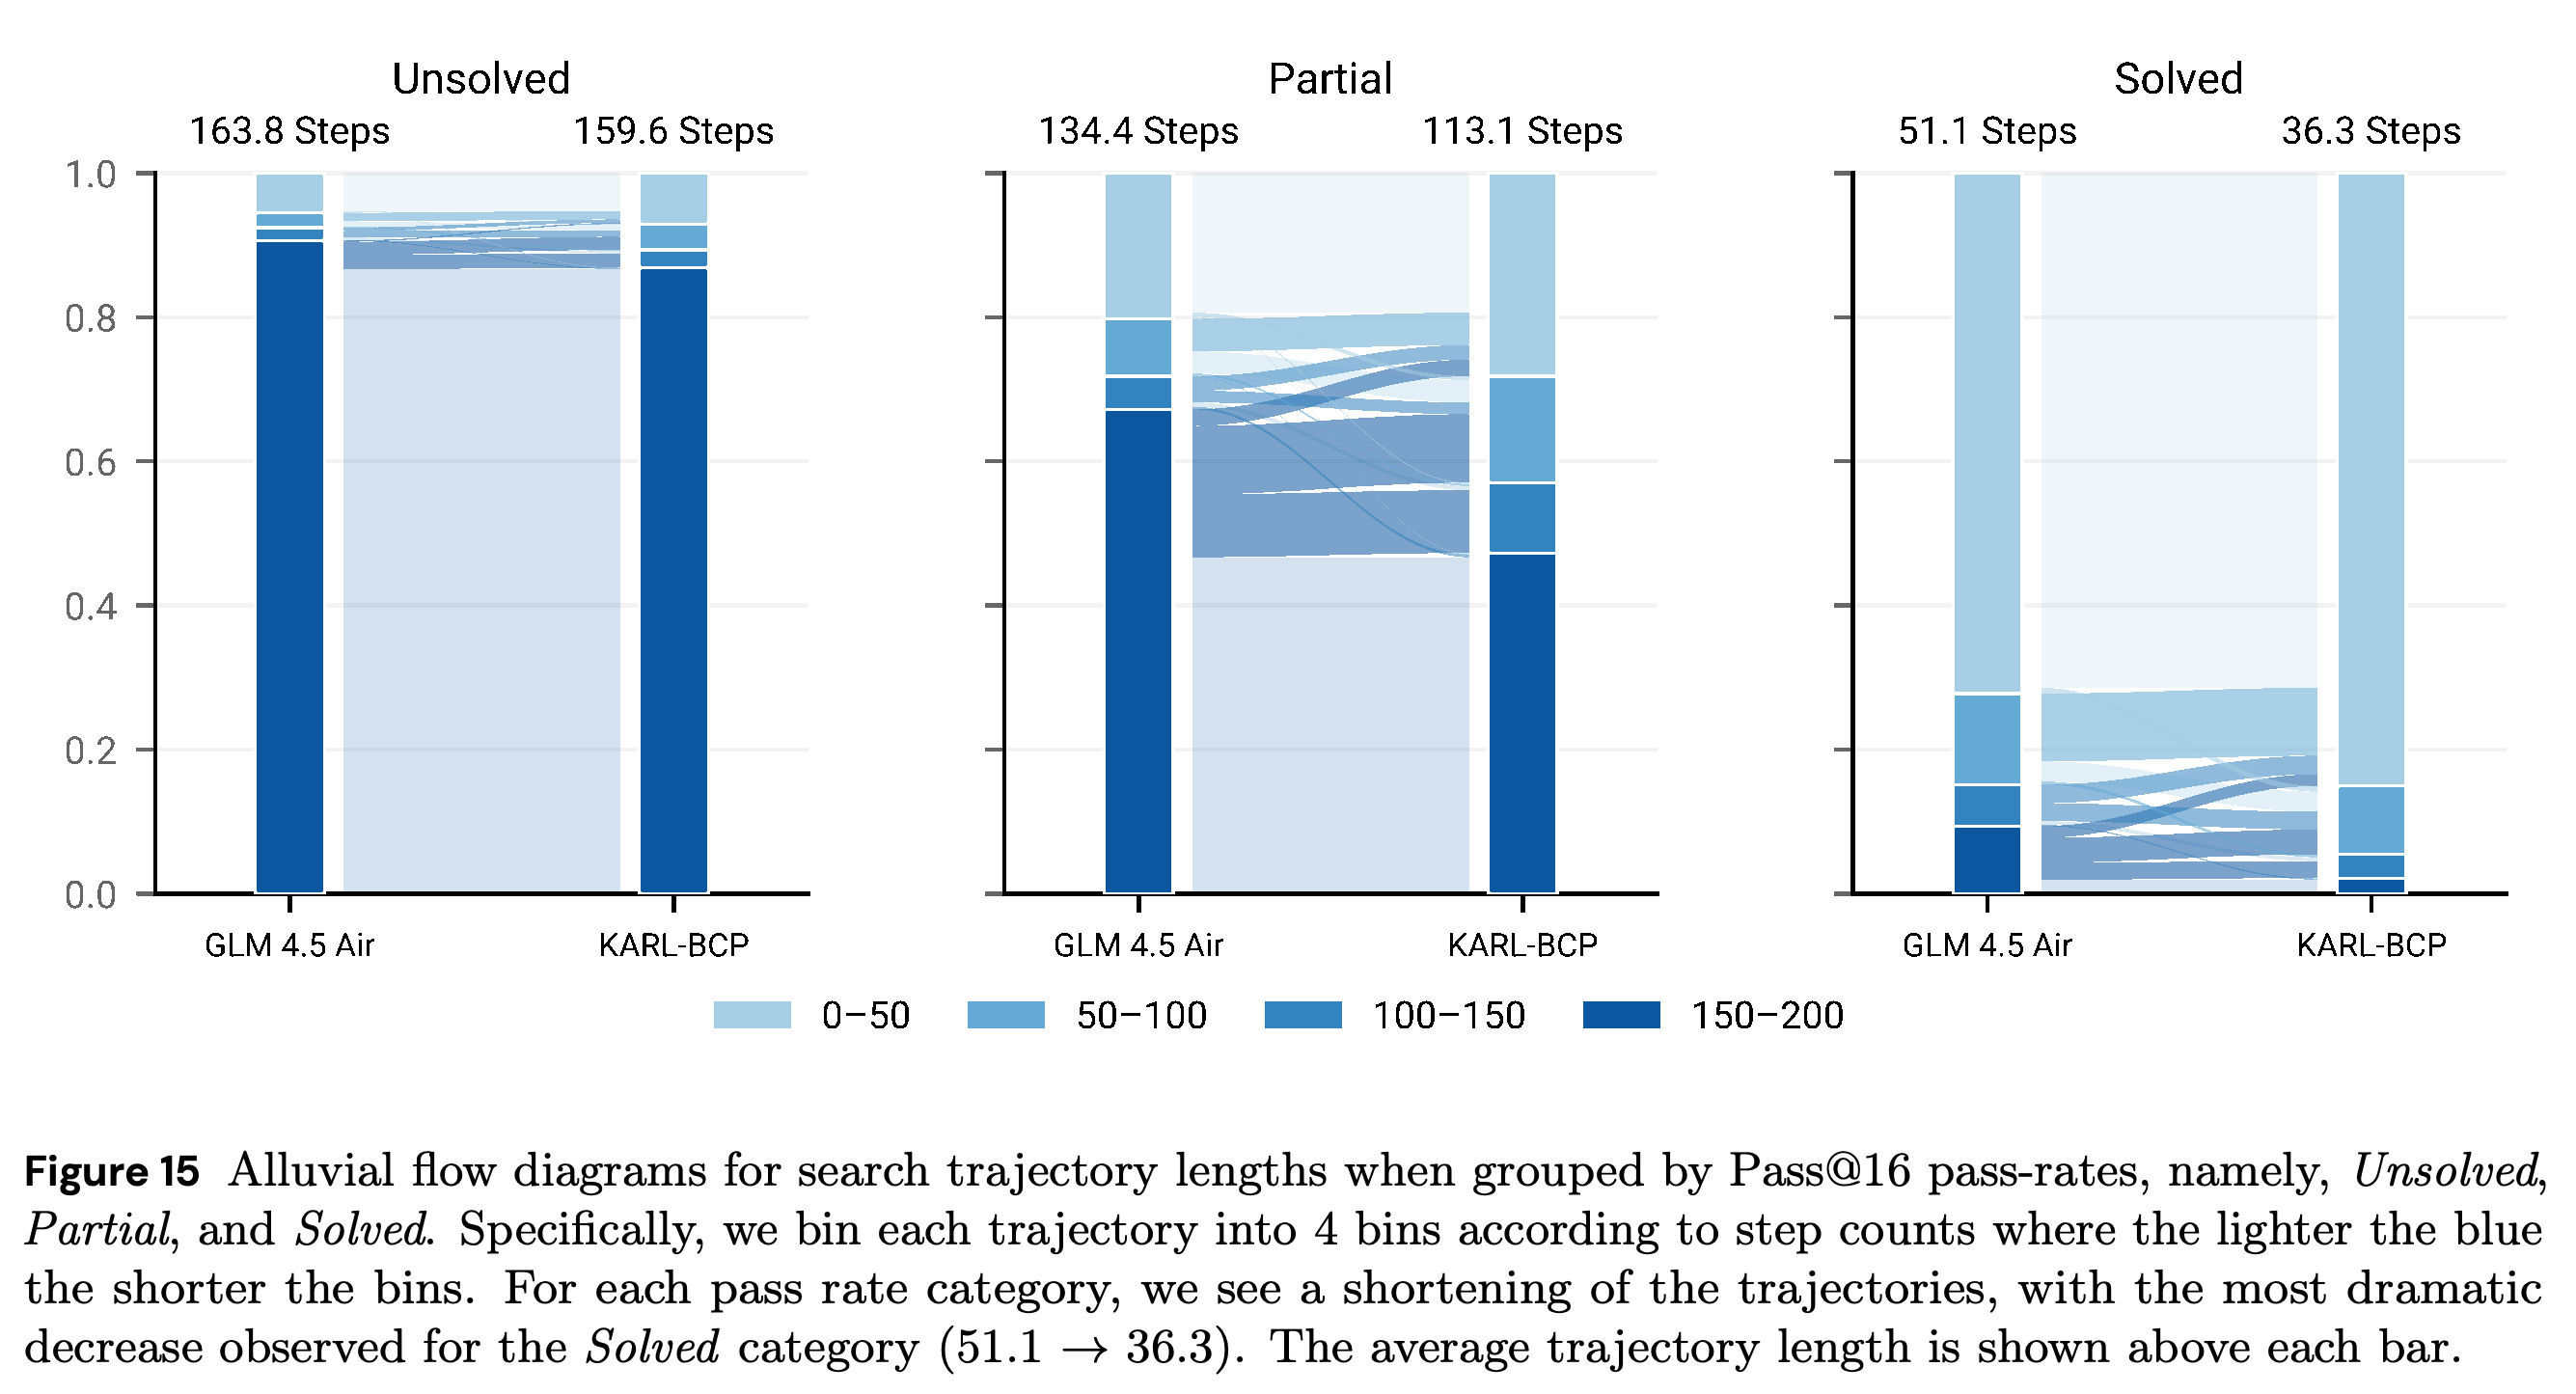
Figure 15 shows KARL-BCP shortening synthetic trajectories across Unsolved, Partial, and Solved groups: mean lengths change from 163.8 to 159.6, 134.4 to 113.1, and 51.1 to 36.3 steps respectively. The largest reduction occurs on already Solved questions excluded from training.
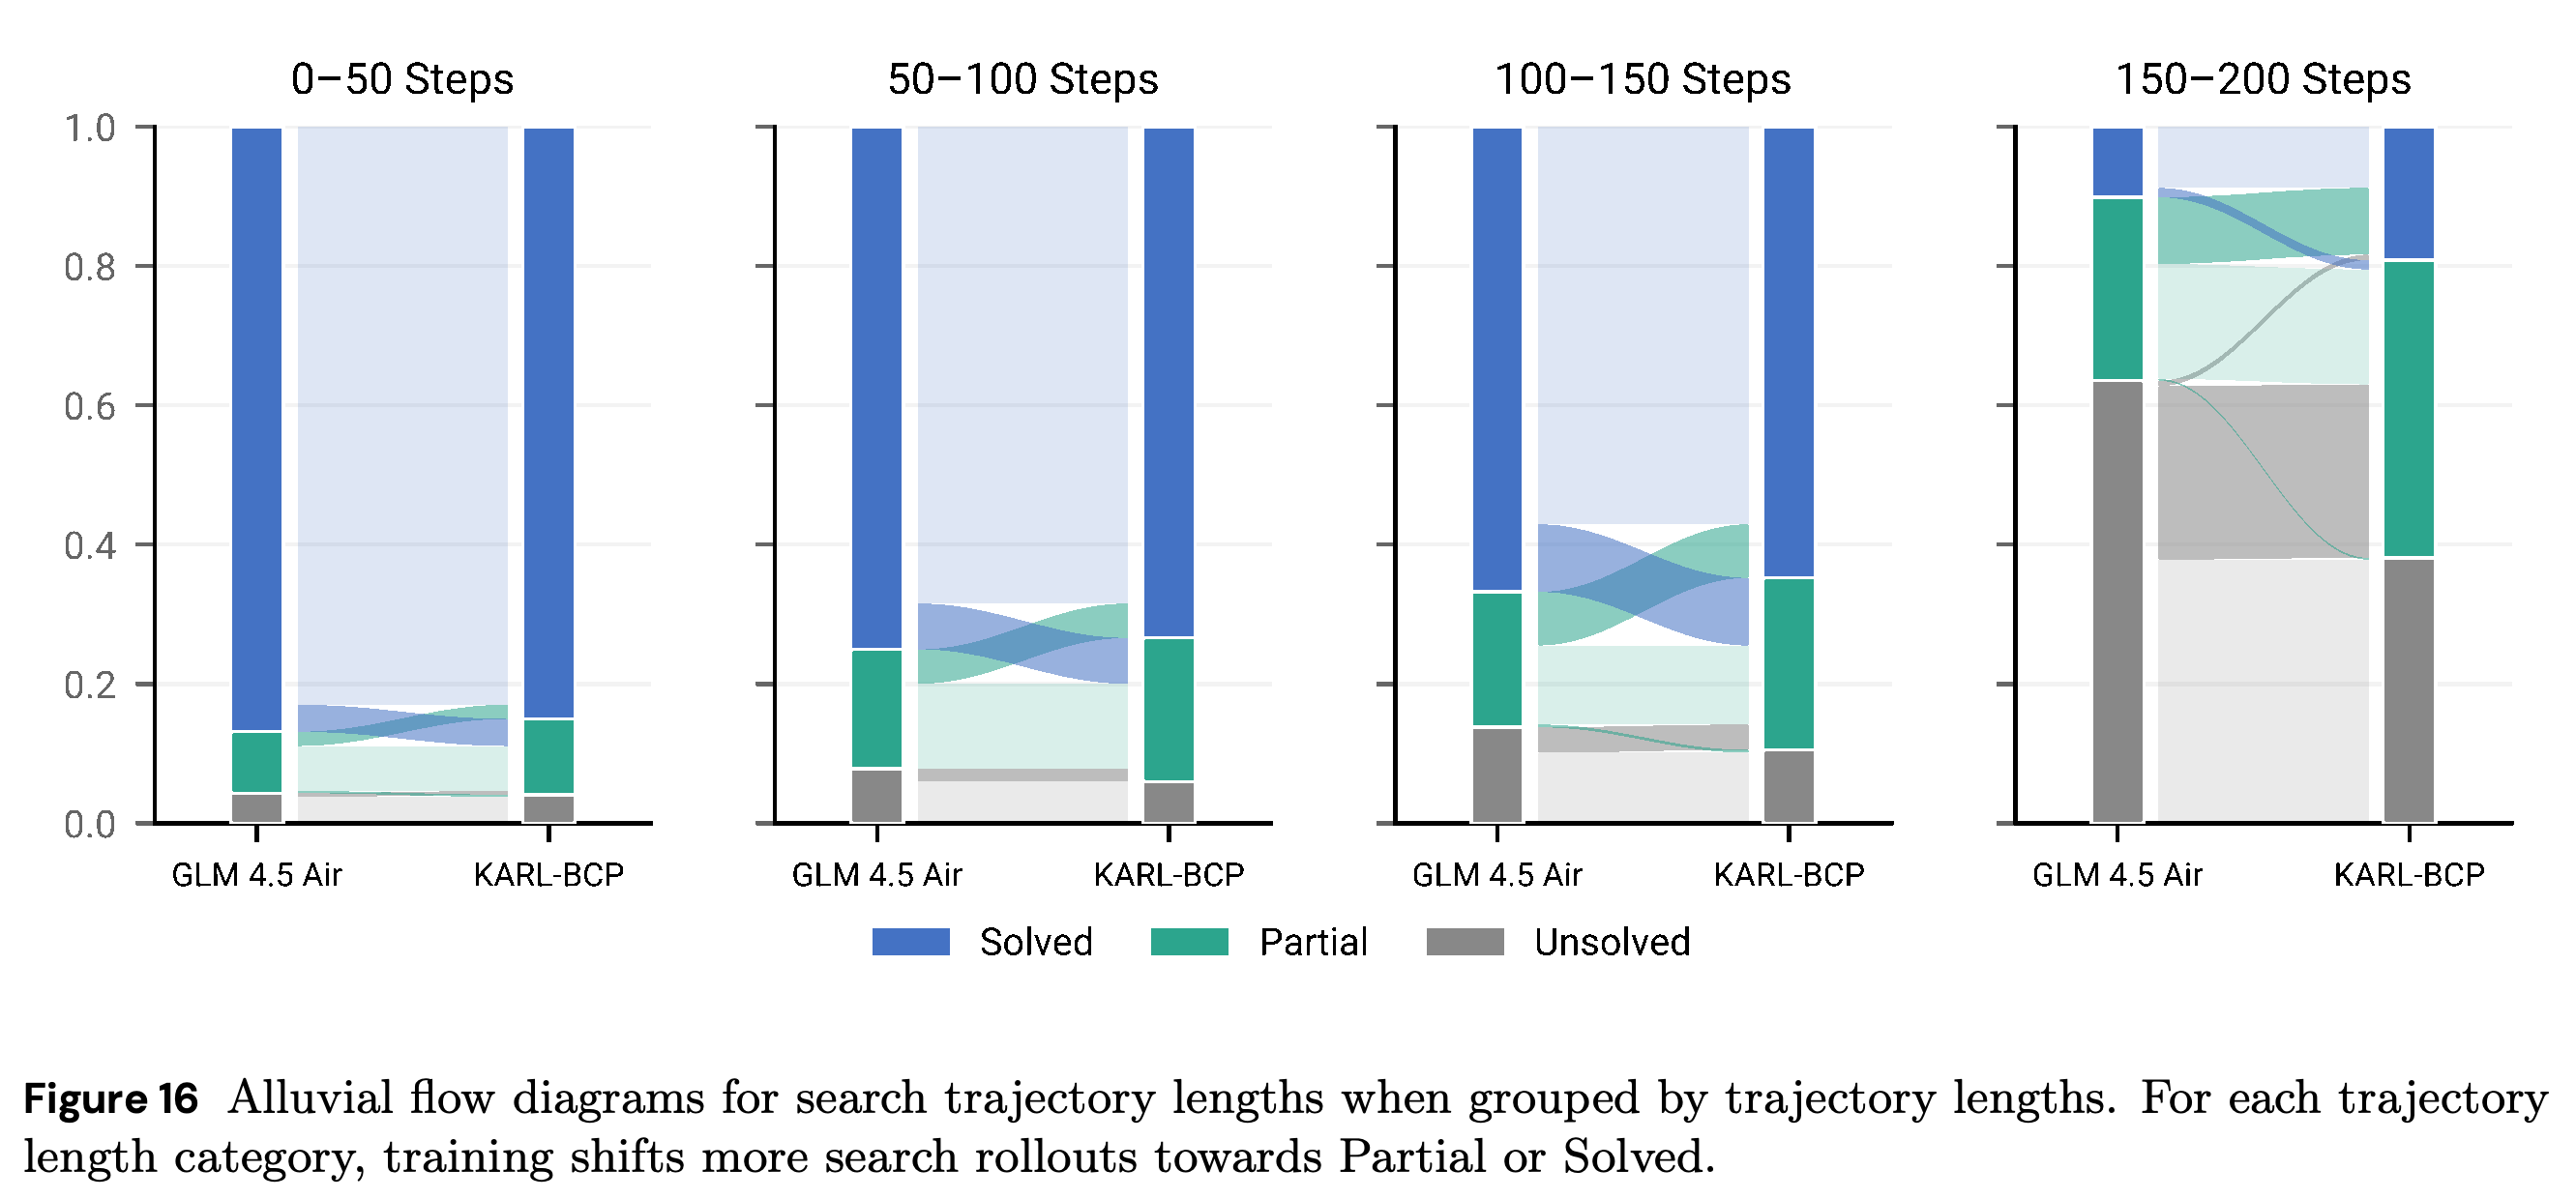
- Figure 16 groups prompts by the base model’s average length across 16 attempts using 0–50, 50–100, 100–150, and 150–200-step bins.
- The longest bin has the largest unsolved fraction. The paper reports more than 20% of previously unsolved questions becoming partially solved and about 10% of partially solved questions becoming fully solved in this bin.
- Shorter trajectories are not intrinsically better: the later numerical-reasoning failure shows that premature termination can also reduce search length.
Mean trajectories shorten in every success category, most strongly for already Solved prompts excluded from optimization. The much smaller reduction for Unsolved prompts does not itself indicate improved reasoning or successful termination.
Questions with the longest base-model trajectories have the largest unsolved fraction and substantial movement toward partial success after training. Grouping by the base model’s trajectory length links these transitions to difficult search cases, but does not independently identify their cause.
8.1.2 Quantitative Analysis on Evaluation Sets
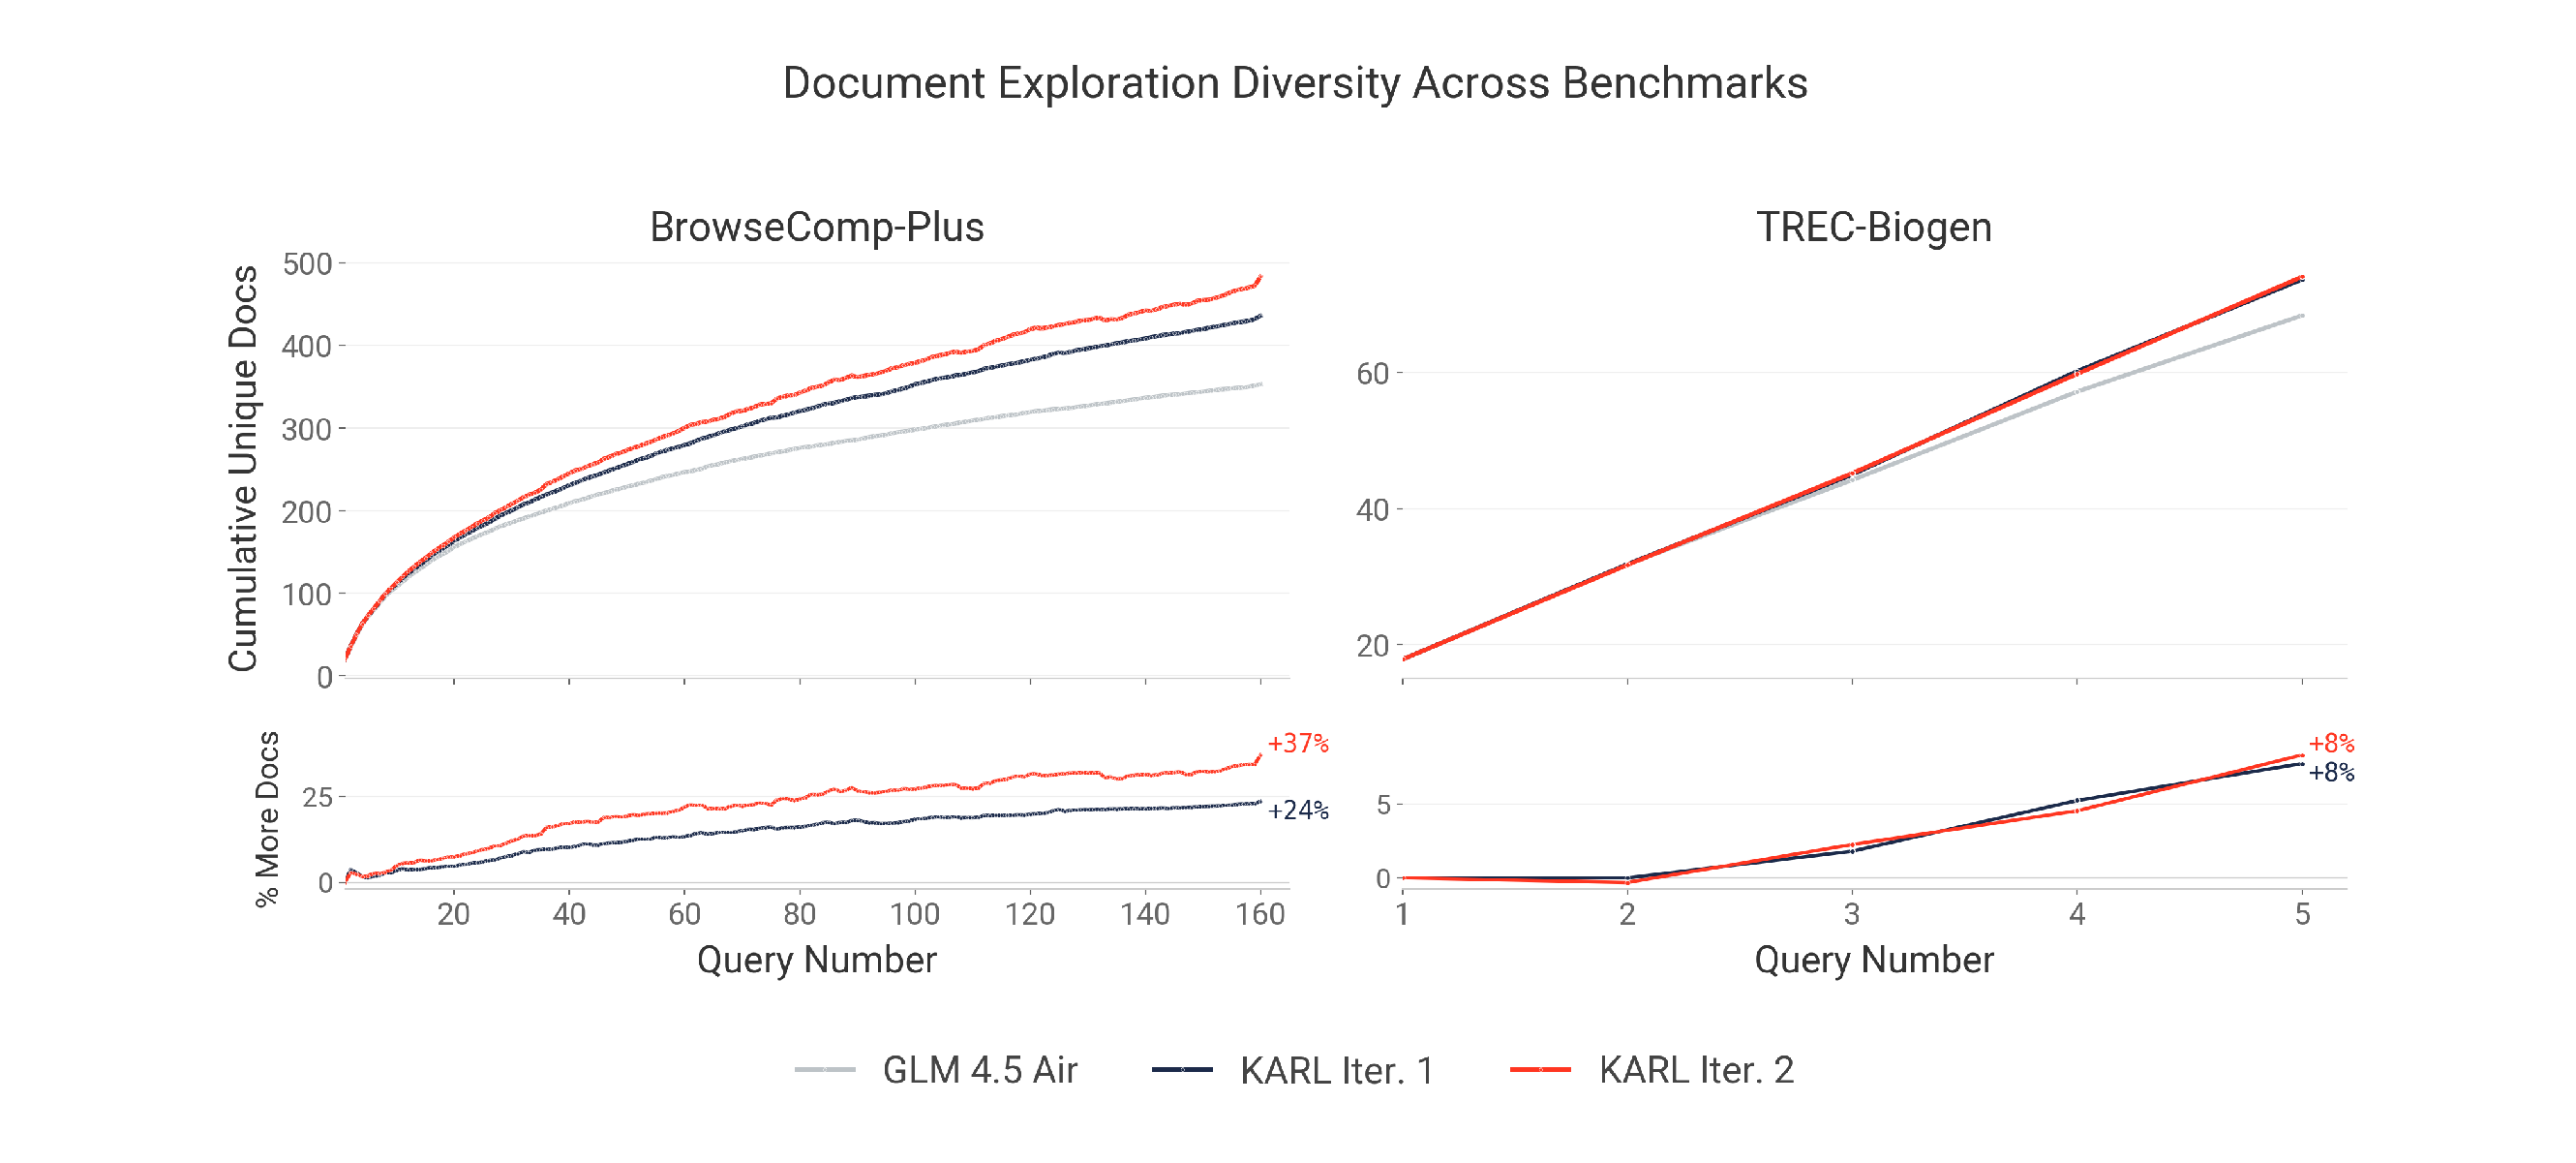
Evaluation-set analysis uses two rollouts per question for GLM 4.5 Air and both KARL iterations. Figure 17 reports 37% more unique retrieved documents on BrowseComp-Plus and 8% more on TREC-Biogen after two iterations, with query counts capped at 160 and 5 respectively.
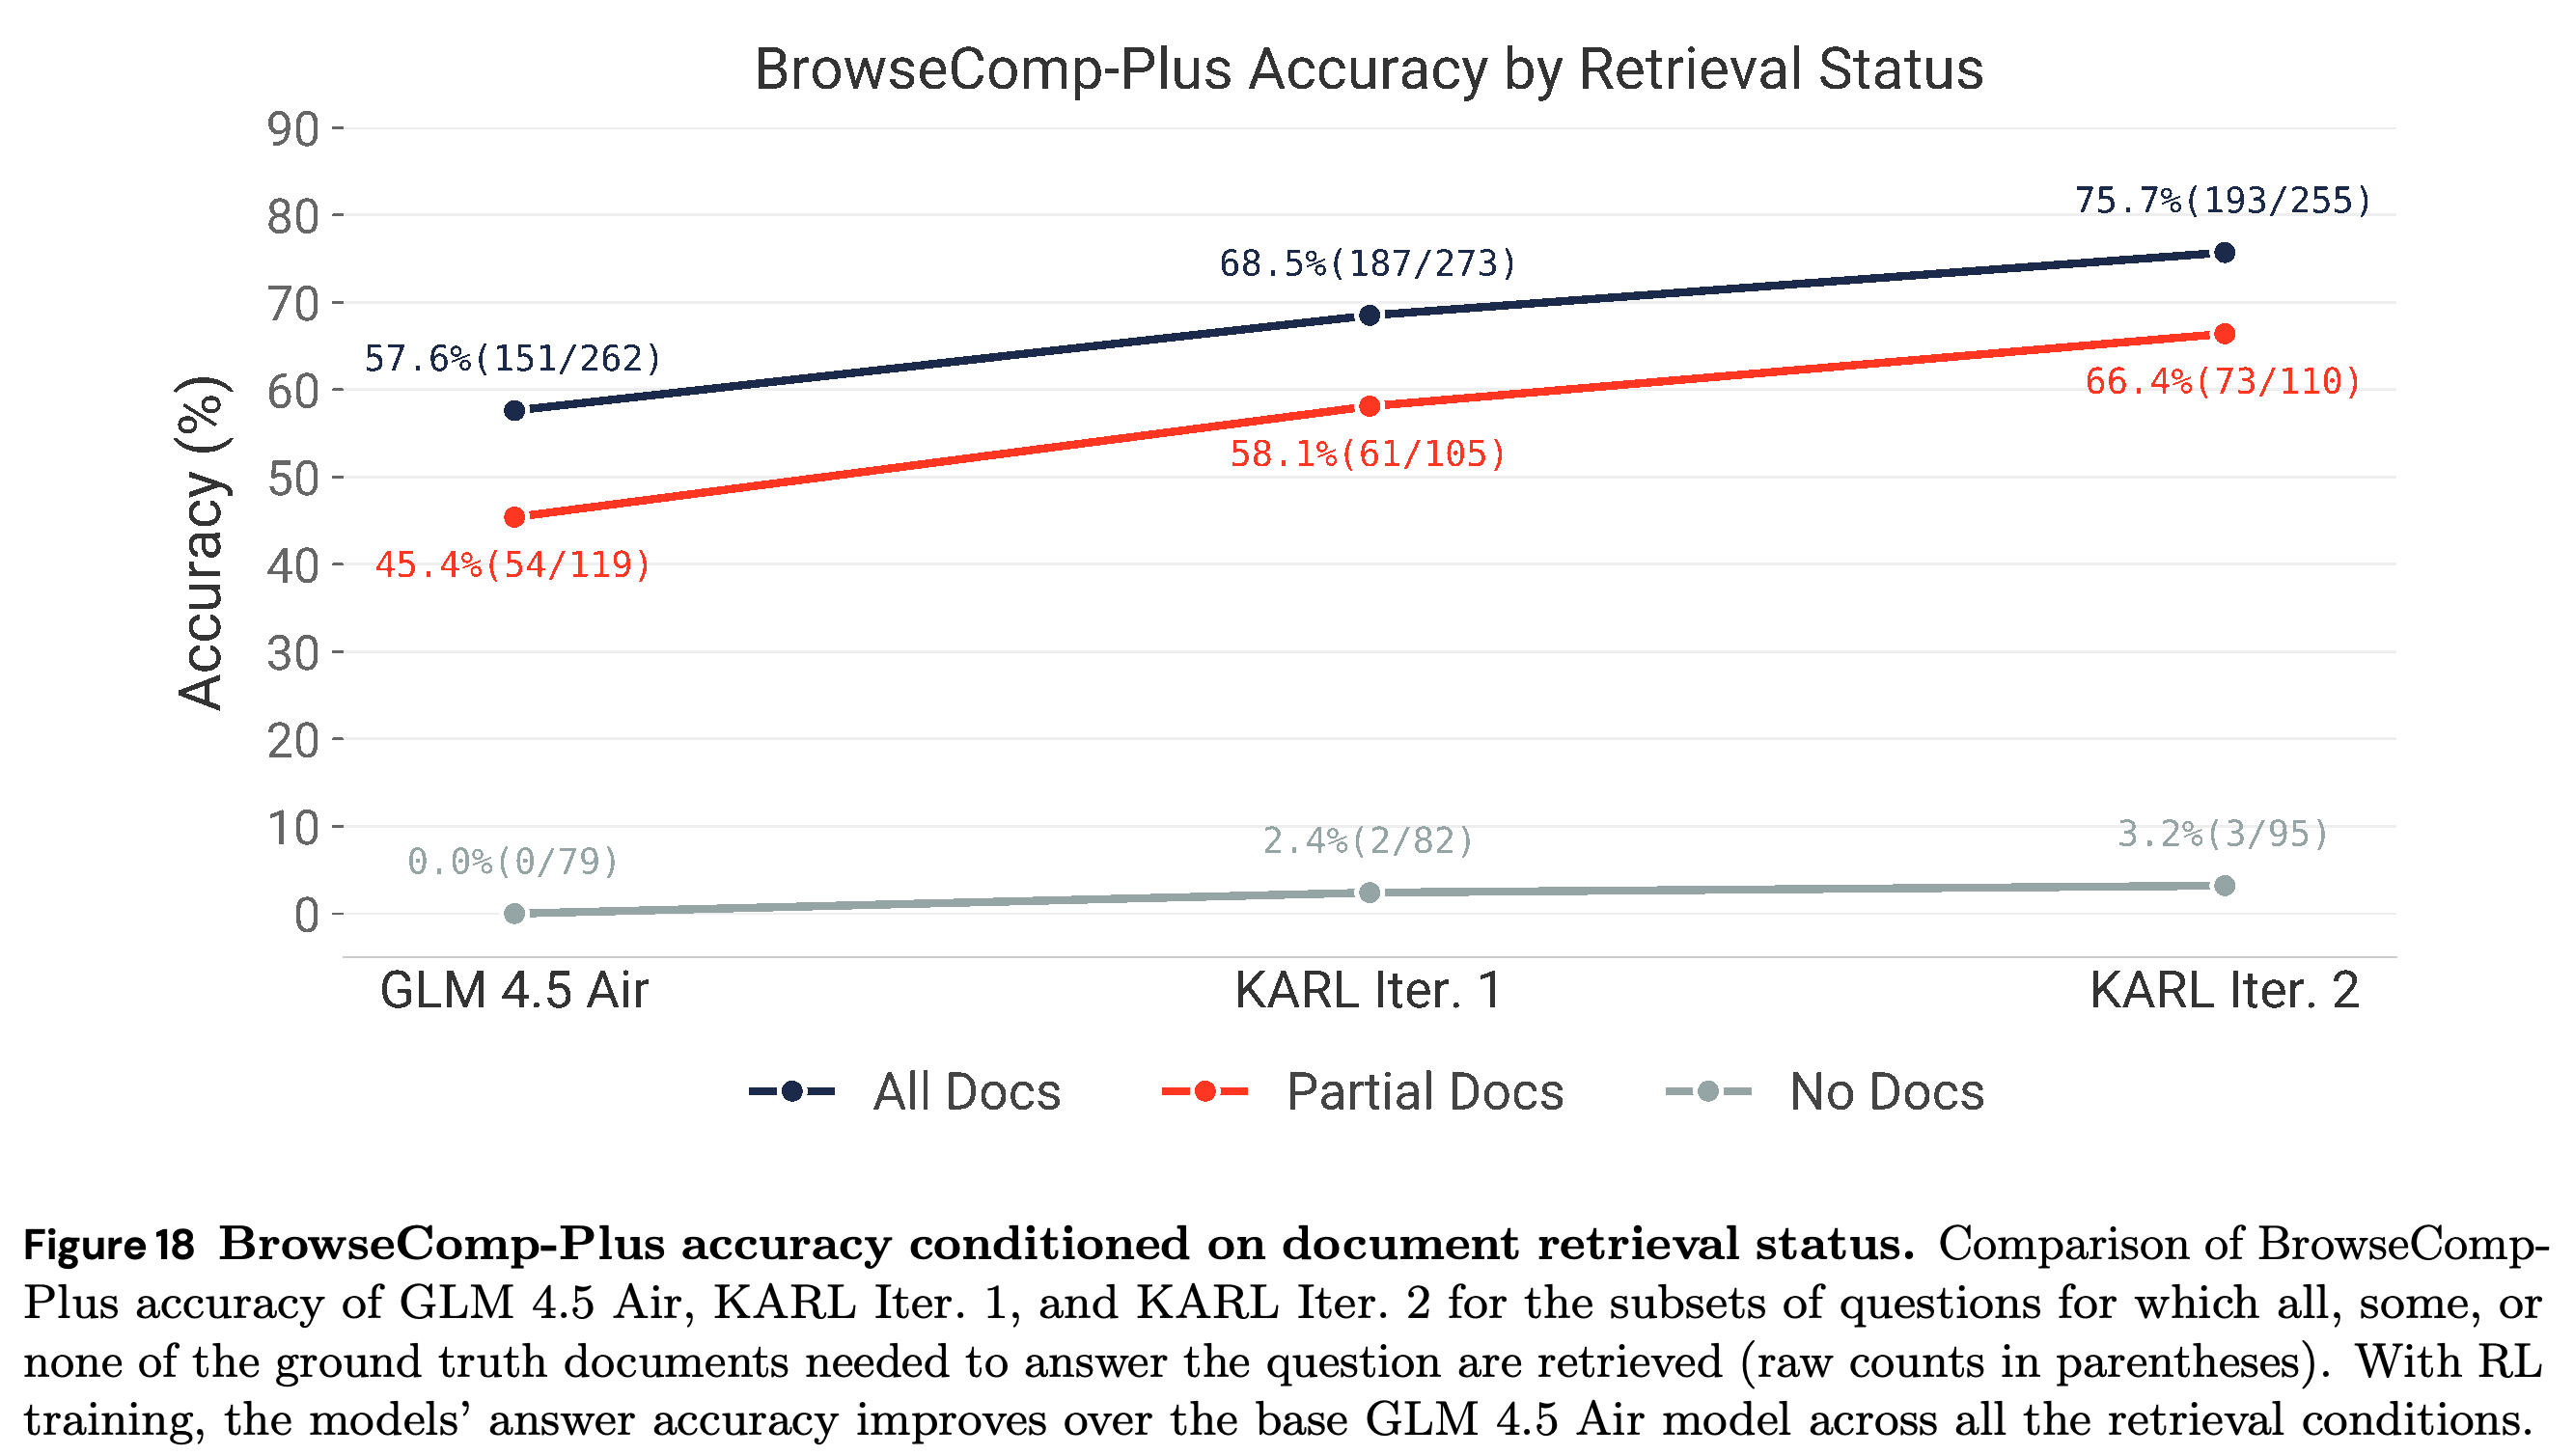
- Figure 18 reports accuracy with full annotated-document retrieval increasing from 57.6% to 68.5% to 75.7%, and partial-retrieval accuracy from 45.4% to 58.1% to 66.4%. These groups contain different rollouts for each model, so they are not controlled comparisons on identical instances.
- Small success rates without annotated gold documents—0.0%, 2.4%, and 3.2%—are attributed by manual inspection to relevant sources absent from the annotations, rather than necessarily unsupported answering.
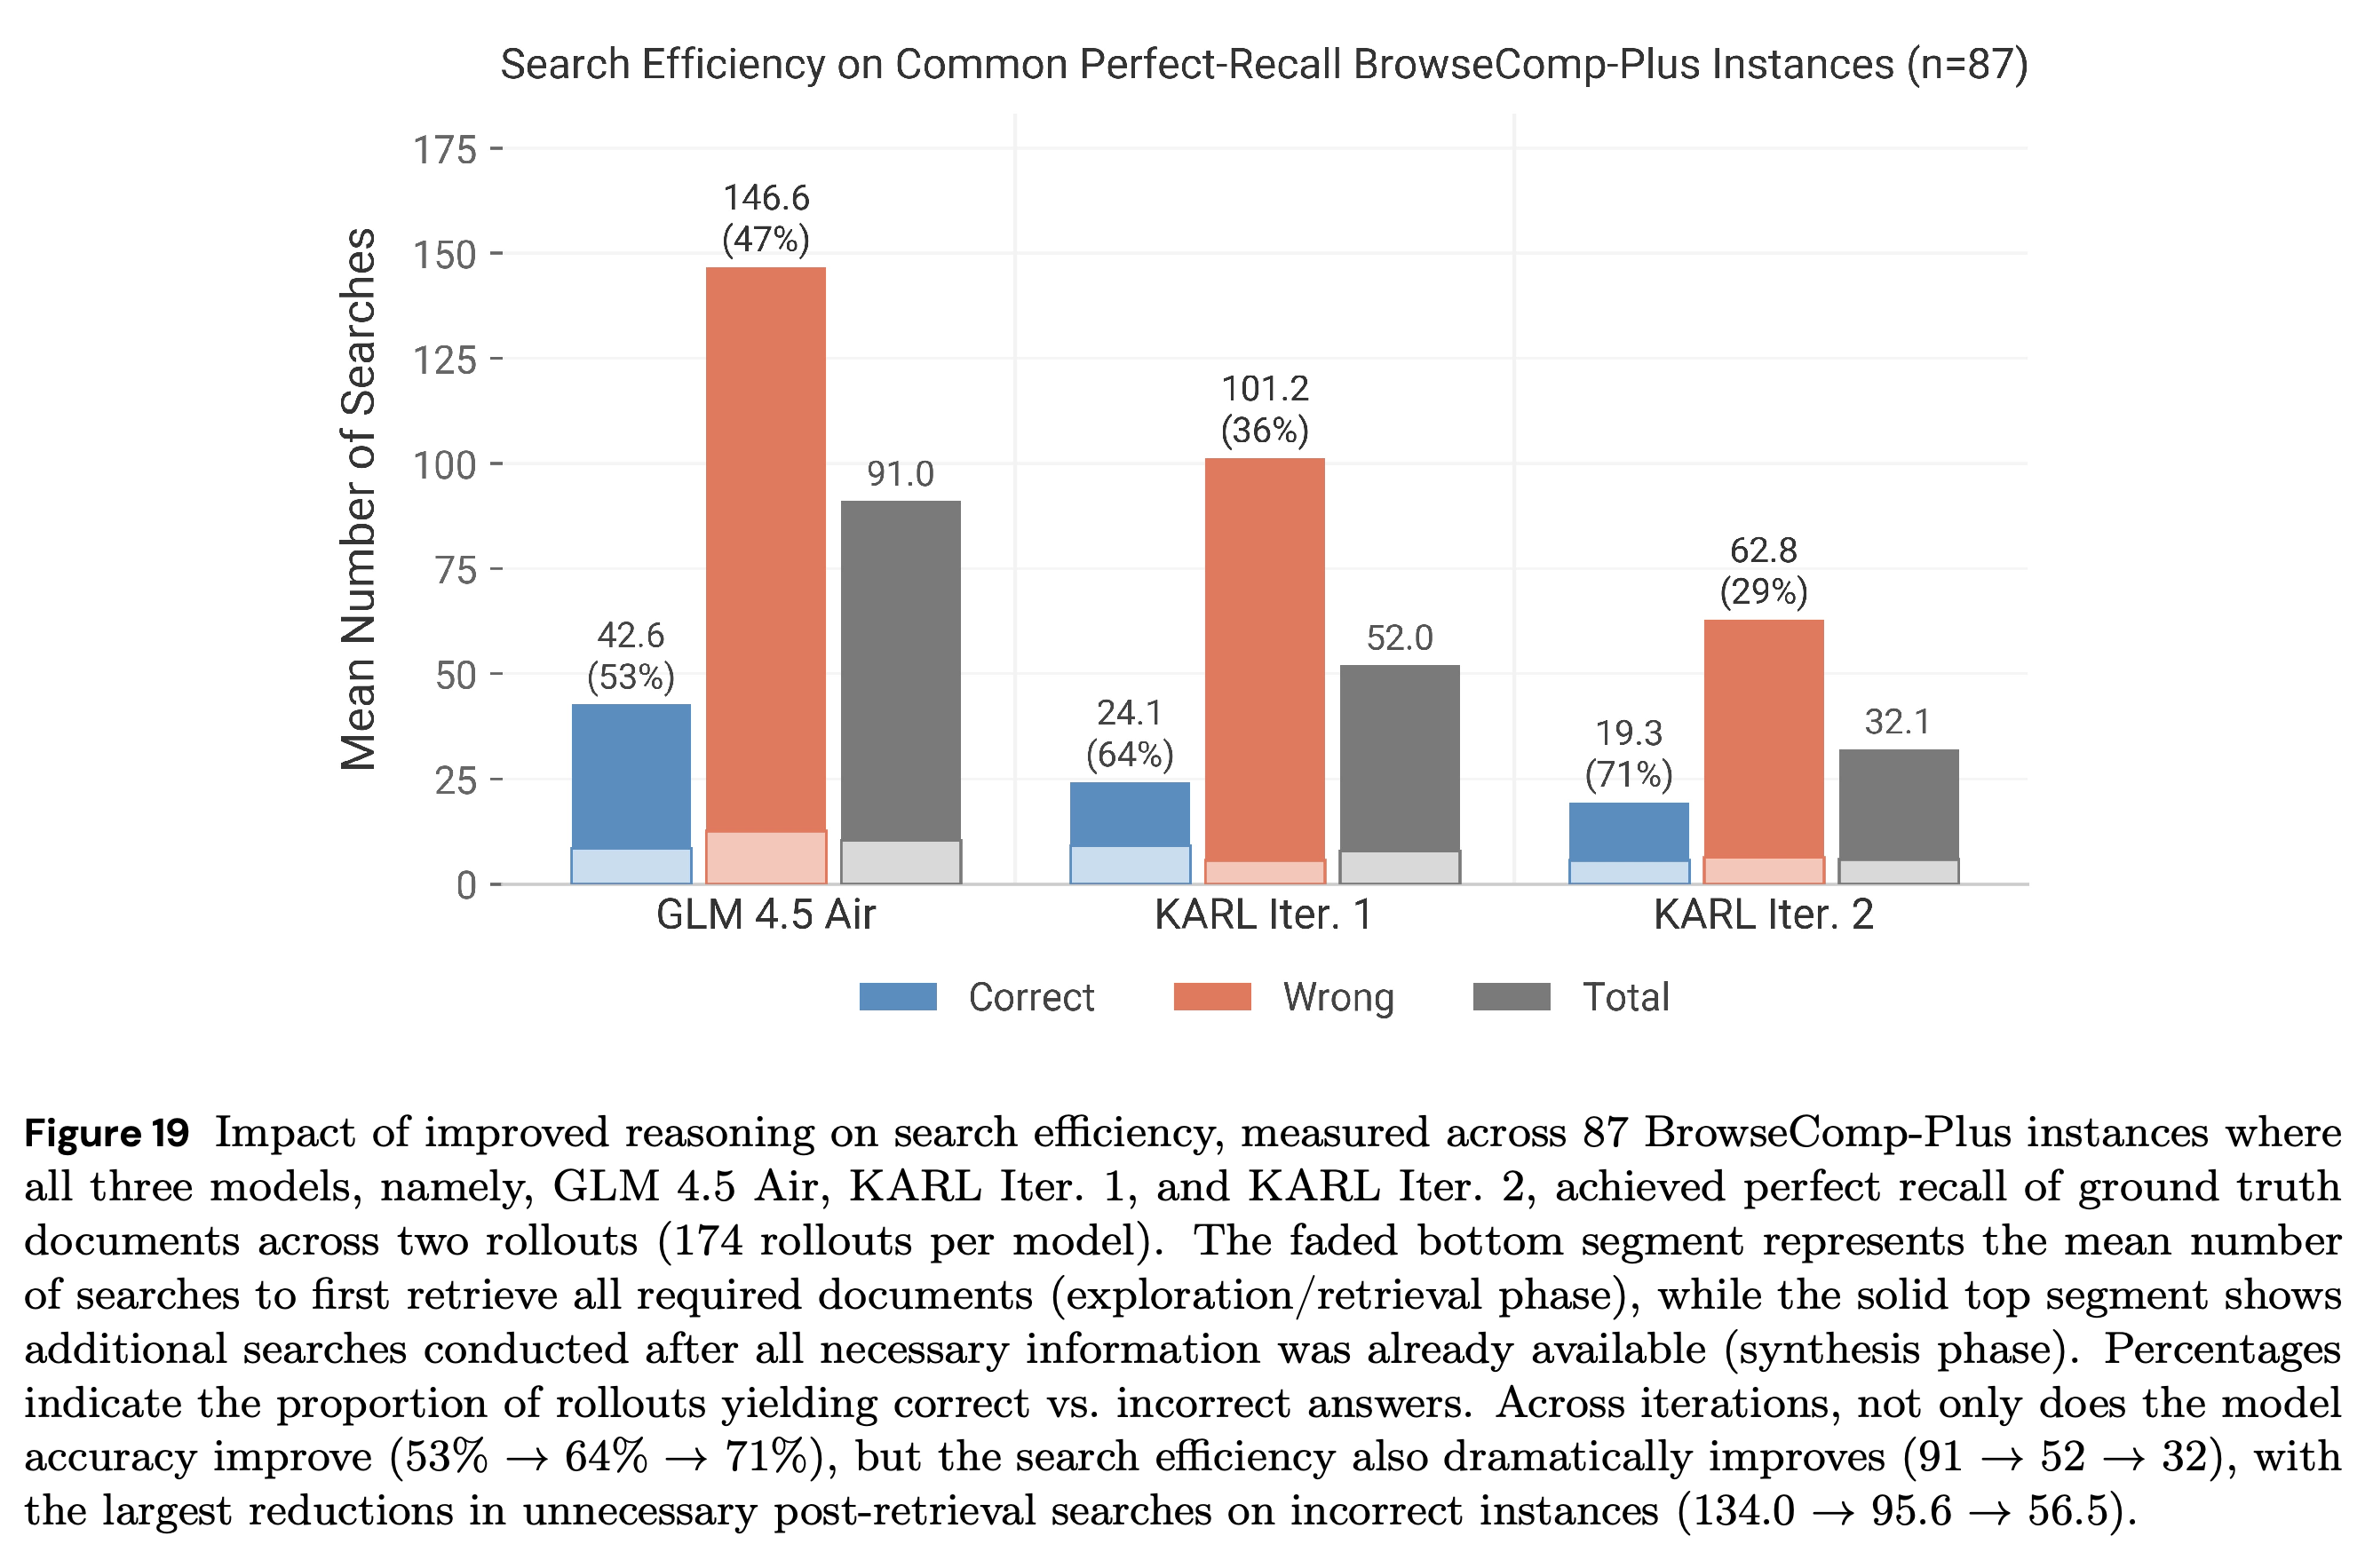
- Figure 19 restricts comparison to 87 questions with full gold-document recall in both rollouts for every model, yielding 174 rollouts per model. Mean searches fall from 91.0 to 52.0 to 32.1 while accuracy rises from 53% to 64% to 71%, mainly through fewer searches after annotated evidence has been retrieved.
KARL retrieves more distinct documents at comparable query indices, especially on BrowseComp-Plus. Diversity was not directly rewarded; the curves indicate a change in search behavior without establishing that diversity alone causes the accuracy improvement.
Accuracy rises within full, partial, and no-annotated-document retrieval groups. These groups differ across models, so the comparison is descriptive rather than instance-controlled; manual inspection attributes the small no-gold-document successes to incomplete annotations.
On 87 questions with full annotated-document recall for every model across two rollouts, mean searches fall from 91.0 to 52.0 to 32.1 while accuracy rises from 53% to 64% to 71%. Most search savings occur after full recall, supporting improved evidence use and commitment on this selected subset.
8.2 Qualitative Case Studies
The qualitative studies examine persistence, post-retrieval interpretation, verification, commitment under partial evidence, and premature stopping. They illustrate mechanisms consistent with the aggregate changes, but selected examples do not establish their prevalence across the benchmark.
8.2.1 Comparison with Baselines
On BrowseComp-Plus Query ID 280, KARL returns Sol Campbell at step 155, while Sonnet 4.5 stops at step 25 and GLM 4.5 Air fails at the 200-step budget. On Query ID 61, KARL identifies the first book’s poetry genre in 7 steps, whereas Sonnet assumes a fiction genre and GLM selects the wrong candidate.
- These cases distinguish productive long-horizon persistence from non-convergent search, and evidence interpretation from retrieval alone.
- The football response does not document verification of every constraint and treats a founding-date requirement approximately. Its correct final answer is therefore not proof of complete constraint checking.
8.2.2 Behavioral Impact on Efficiency
KARL still performs redundant verification: Query ID 472 identifies Saturna at search 7 but continues through search 19. On Query ID 257, KARL answers Sasquatch Books after 57 or 7 steps despite an unverified constraint, while GLM 4.5 Air exhausts its search budget.
- The examples support a flexible commitment policy rather than a fixed stopping threshold or a requirement to verify every constraint.
- Query ID 1185 is a counterexample to equating shorter traces with improved efficiency: KARL retrieves relevant cricket data but gives up after 13 searches instead of performing arithmetic such as 33+11+31+2+0 = 77.
- This failure shows that search-oriented training does not reliably solve post-retrieval numerical computation. The paper proposes adding explicit arithmetic and tabular-reasoning rewards, but does not evaluate that extension.
8.2.3 Behavioral Profiles
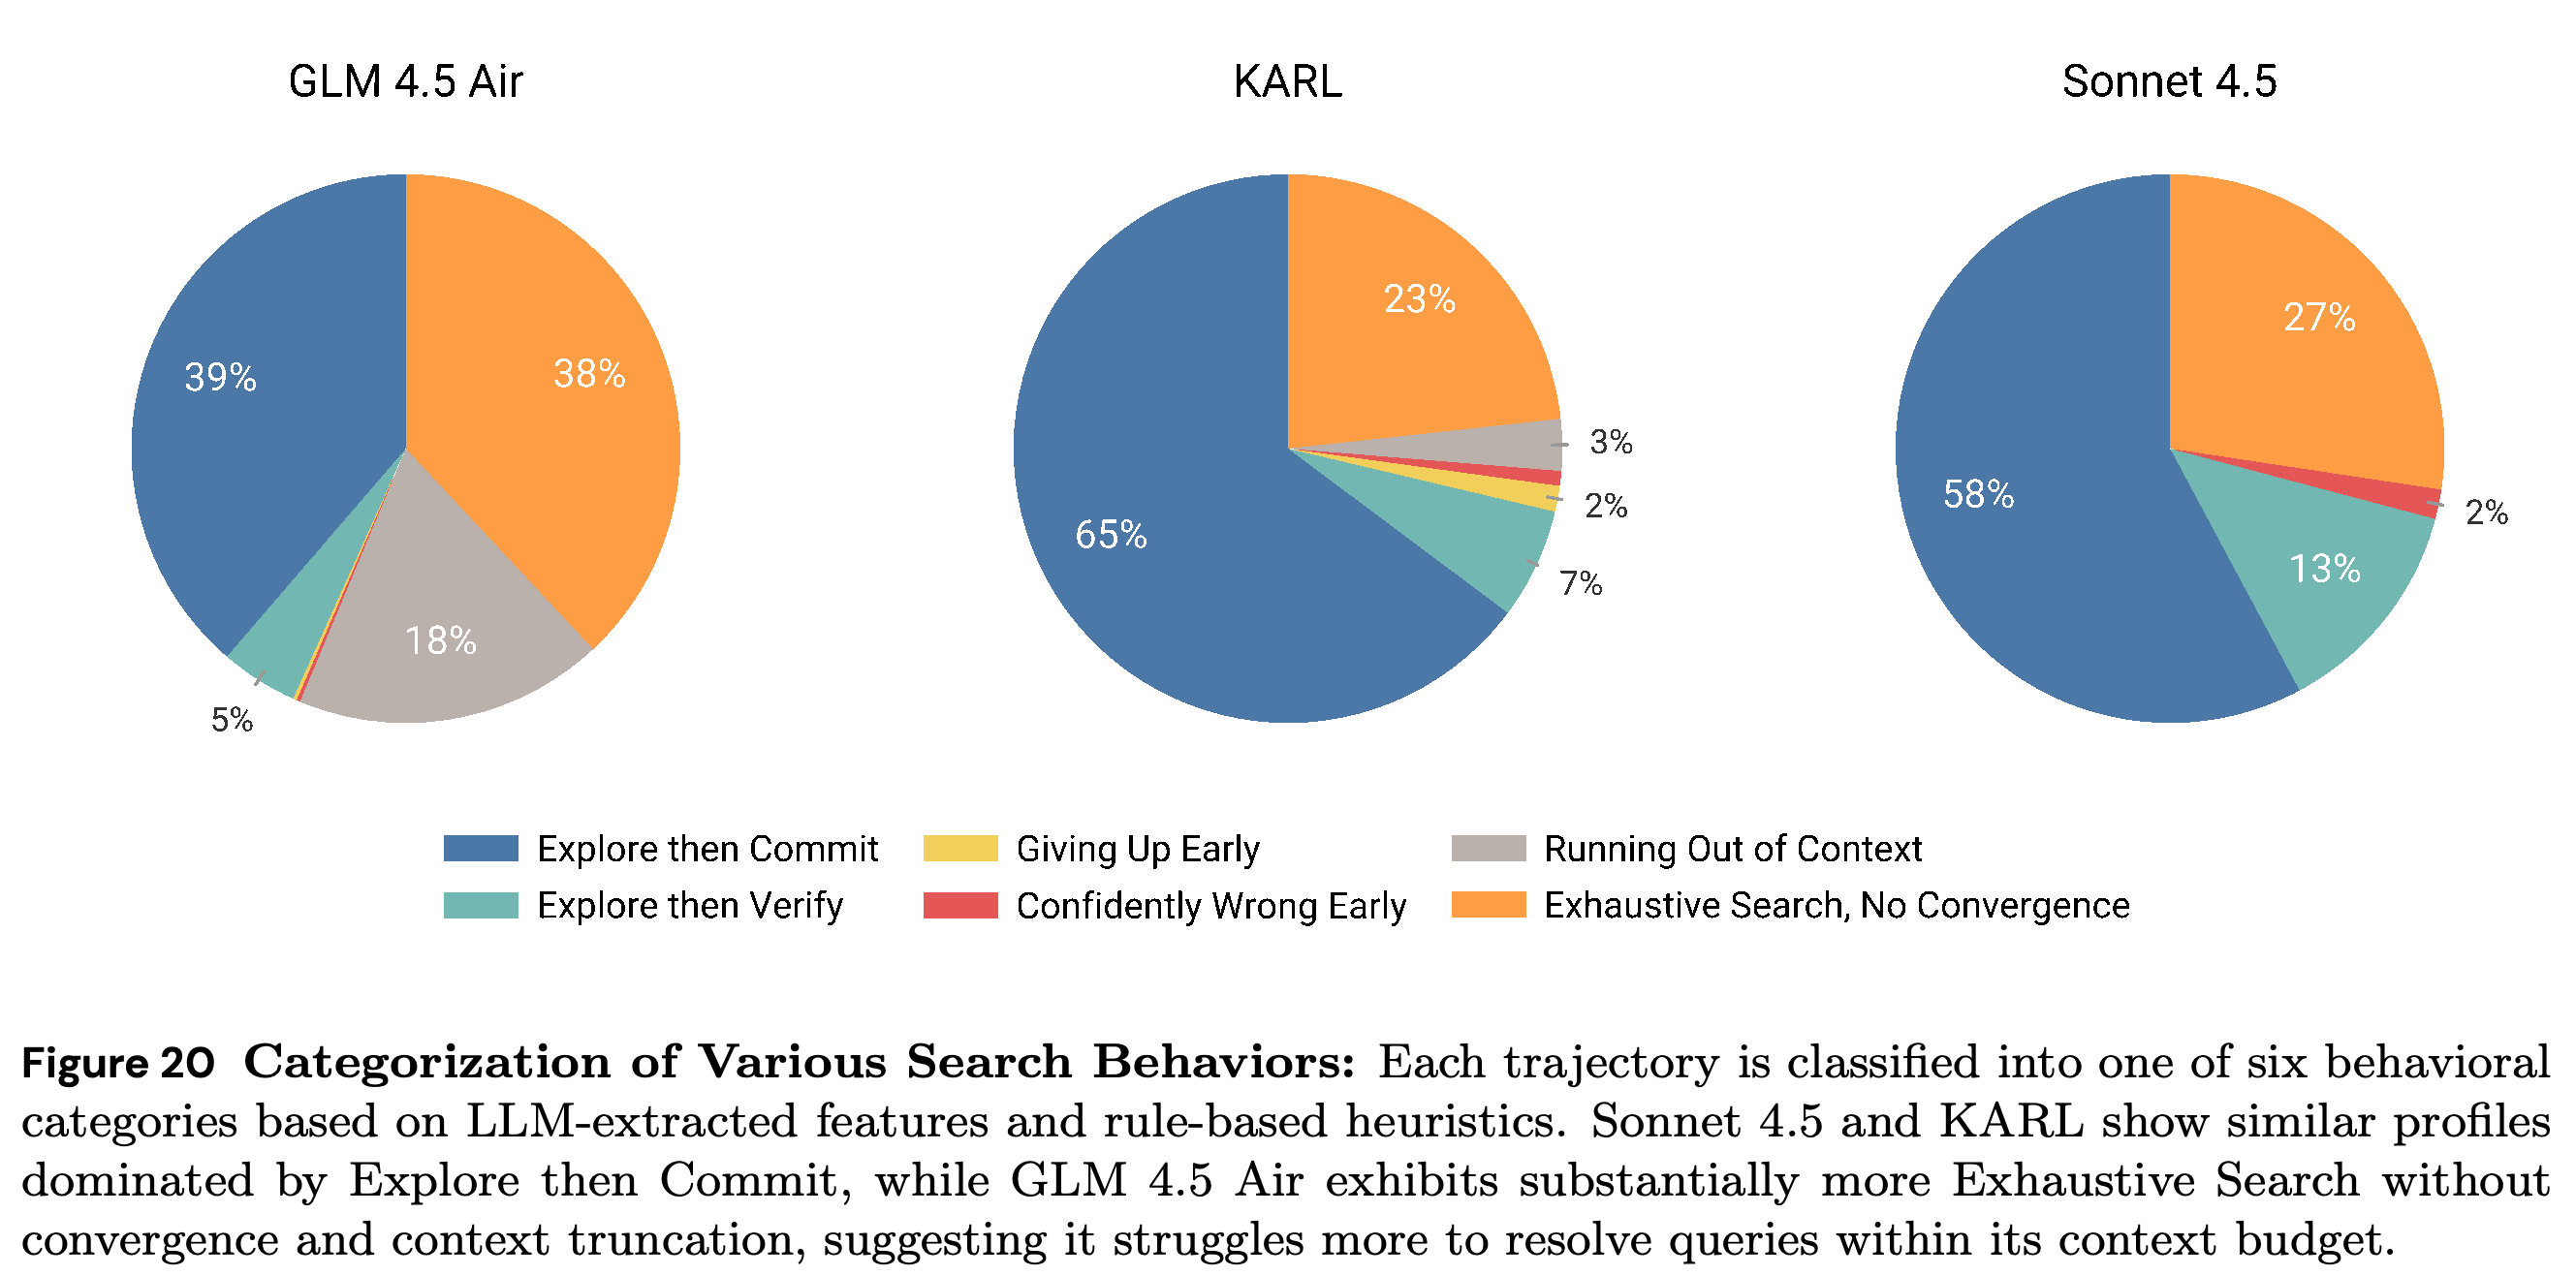
The six behavioral classes are Explore then Commit, Explore then Verify, Giving Up Early, Confidently Wrong Early, Running Out of Context, and Exhaustive Search, No Convergence. Figure 20 shows Explore then Commit increasing from 39% for GLM 4.5 Air to 65% for KARL, compared with 58% for Sonnet 4.5.
- Exhaustive Search, No Convergence falls from 38% to 23%, and Running Out of Context falls from 18% to 3%, consistent with more frequent convergence within the search budget.
- The authors note increased Giving Up Early and hypothesize a spurious association between short traces and correctness; this explanation is not experimentally isolated.
- Appendix F calibrates the classifier on 30 hand-labeled traces and reports roughly 75% human agreement with rule-generated labels. The behavioral proportions are approximate classifier-based measurements.
KARL shifts toward Explore then Commit and away from context exhaustion and non-convergent exhaustive search. The proportions come from a heuristic and LLM-assisted classifier with roughly 75% reported human agreement, not exhaustive manual annotation.
9 Conclusion
The paper concludes that grounded synthetic tasks, heterogeneous off-policy RL, and complementary test-time scaling produce effective search agents under its closed-corpus protocol. Structured retrieval, code execution, callable sub-agents, and hierarchical memory are proposed extensions, not evaluated capabilities of the current vector-search-only system.
Appendix
- A Authors lists individual contributors and correspondence for the Databricks AI Research report. It provides attribution rather than additional methodological or experimental results.
- B Cost and Latency Experiment Details documents reasoning-effort and compression selection, token-price accounting, 8 GPU H200 inference, warm-up, sampling, and the first-answer-token latency protocol. Figures 21–25 report mean effective latencies of 13,758 ms for GLM 4.5 Air, 14,615 ms for KARL, 32,753 ms for Sonnet 4.6, 30,566 ms for Opus 4.6, and 82,748 ms for GPT 5.2, with substantial task-level variation and separate end-to-end measurements. Figure 24 records 2,822 Opus rollouts, including 572 for FinanceBench, rather than the 2,700 total and 450 per task shown for the other models; the PDF does not explain this deviation.
- C Dataset Details and Examples presents KARL responses for TREC-Biogen gene-therapy report synthesis, BrowseComp-Plus television-episode identification, FinanceBench capital-expenditure lookup, QAMPARI enumeration of James B. Longacre’s designs, and Freshstack LangChain JSON-loading procedures. C.2 also lists the 230 calibrated BrowseComp-Plus query IDs; the generated examples illustrate answer formats and are not independent validation of every medical or software claim. C.6 PMBench (Internal Benchmark) describes 57 manually verified questions over roughly 3,000 customer-conversation documents written over roughly 2 years, curated from real product-manager queries or monthly summaries with linked-note verification and evaluated using nugget-based partial credit.
- D Prompts provides the D.1 evaluation judge’s support, partial_support, and not_support labels and the D.2 deduplication, solver, and quality-filter templates; the solver requests an explanation with document citations, an exact answer, and confidence. D.3 Data Synthesis Statistics reports BrowseComp-Plus yields of 8.8% in Iter. 1 and 16.2% in Iter. 2, but Iter. 2 skips quality filtering; it also states that TREC-Biogen uses no Quality Filter, conflicting with the main synthesis description. D.4 illustrates semantic duplicates, while D.5 illustrates an erroneous biomedical nugget, a referentially ambiguous award comparison, and an incorrect company reference answer; no filtering ablation measures the quality filter’s effect.
- E Qualitative Case Studies expands E.1 search persistence, E.2 genre reasoning, E.3 redundant verification, E.4 commitment with an unverified constraint, and E.5 premature stopping on numerical reasoning. E.6 shows KARL’s best non-traumatic-hand-fracture response covering 9/9 reference nuggets versus the base model’s best 5/9, using targeted follow-up searches. E.7 shows a PMBench aggregator combining five responses with at most 3/9 fully supported nuggets into a response supporting 5/9, including one nugget assembled from complementary partial information.
- F Categorizing Search Behavior defines a priority-ordered rule classifier using features including truncation, uncertainty, proposed answers, and verification searches, extracted through LLM judgments and string matching. A second LLM judgment can override the rule result at ≥95% confidence or when no rule matches; calibration uses 30 hand-labeled rollouts, followed by two trajectories for each of 230 BrowseComp-Plus questions per model. The authors manually inspect borderline traces and report roughly 75% agreement between human annotations and rule-generated labels.
- G Details about Compression Behavior and G.1 Compression Statistics report a median of 6 and mean of 10.2 compression events per BrowseComp-Plus question, averaged over two rollouts, with 47 of 230 questions requiring 20 or more events. G.2 contrasts two approximately 100× reductions: G.2.1 Successful Compression: Author Identification reduces 112,946 to 1,134 characters while preserving the findings needed for the correct title, Baby. G.2.2 Harmful Compression: ICC Hall of Fame Puzzle reduces 108,881 to 1,131 characters but drops an unfinished year-offset reasoning chain, anchors on 2009, and misses contradictory evidence for the correct answer 2010.
- H Evaluation Infrastructure describes an aroll-based comparison app for streaming outputs, tool calls, citations, optional blind preference voting, notes, and shareable runs. A separate trace viewer supports qualitative triage and comparison of exploration and verification behavior. The appendix shows inspection tools but reports no controlled human-preference result validating the benchmark ranking.
Brief Thoughts
The most specific evidence concerns context management and deciding when available evidence is sufficient. Cross-model compression swaps and the common-perfect-recall analysis support these contributions more directly than the overall leaderboard. The RL-versus-SFT result is strongest as an inference-time scaling comparison: SFT starts higher without parallel thinking, while RL scores higher at the tested parallel budget. Improved max@k supports broader observed solution coverage, but does not establish that the base policy was incapable of generating those solutions.
The headline results should be interpreted within the vector-search harness, calibrated evaluation subset, and token-based cost model. Conflicting filtering and deduplication descriptions, incomplete document annotations, classifier noise, and demonstrated arithmetic and compression failures leave important reproducibility and reliability questions unresolved. The small TREC-Biogen and PMBench sets and absence of uncertainty estimates for benchmark quality scores make small leaderboard differences difficult to interpret statistically. Latency uncertainty is reported separately. No matched online-RL comparison or total training-cost accounting isolates OAPL’s claimed sample and computational efficiency. Reference-nugget completion should be supplemented in deployment with checks for unsupported additional claims, citation validity, and executable procedural correctness.