


Introspective Diffusion Language Models | Summary
13 Apr 2026 | Paper Review Diffusion Language Models Parallel Decoding Speculative Decoding LLM ServingContents
- Summary
- 1 Introduction
- 2 Background and Motivation
- 3 Introspective Diffusion Language Model
- 4 Experiments
- 5 Conclusion
- Appendix
- Brief Thoughts
This article explains the key points of Introspective Diffusion Language Models.
- 2026-04-13 (arXiv)
- Yu, Yifan, Jian, Yuqing, Wang, Junxiong, Zhou, Zhongzhu, Zhuang, Donglin, Fang, Xinyu, Yanamandra, Sri, Wu, Xiaoxia, Wu, Qingyang, Song, Shuaiwen Leon, et al.
- Together AI, University of Illinois Urbana-Champaign, The University of Texas at Austin, Princeton University, Stanford University
- Paper
- Github
- Project Page
Summary
- The paper attributes part of the diffusion language model quality gap to disagreement between token-generation distributions and the model’s predictions after those tokens are revealed. I-DLM converts pretrained autoregressive models using causal attention, next-token logit shifting, and supervision on both masked and clean positions.
- Introspective Strided Decoding (ISD) combines verification of previous proposals with generation of new proposals in the same forward pass. Strict acceptance and correction preserve the model’s causal anchor distribution; Residual ISD (R-ISD) uses gated LoRA to keep that anchor equal to the original base AR distribution.
- The conversion uses a dataset of 4.5B tokens of generated reasoning responses and training on 8 H100 GPUs. I-DLM-8B scores 69.6 on AIME-24 and 45.7 on LiveCodeBench-v6, compared with 43.3 and 30.4 for LLaDA-2.1-mini (16B), while remaining below Qwen3-8B on several difficult reasoning benchmarks.
- An SGLang-based implementation combines causal KV-cache reuse, CUDA graphs, stationary-batch scheduling, and fused verification. The paper reports 2.9–4.1× higher throughput than prior DLMs at concurrency C=64 under fixed-length burst workloads.
1 Introduction
The introduction identifies two obstacles to practical diffusion language models: lower generation quality and inference overhead that prevents token parallelism from translating into serving throughput. Rather than progressively modifying diffusion toward AR behavior, the authors begin with pretrained AR models and preserve their causal prediction structure while adding parallel proposals.
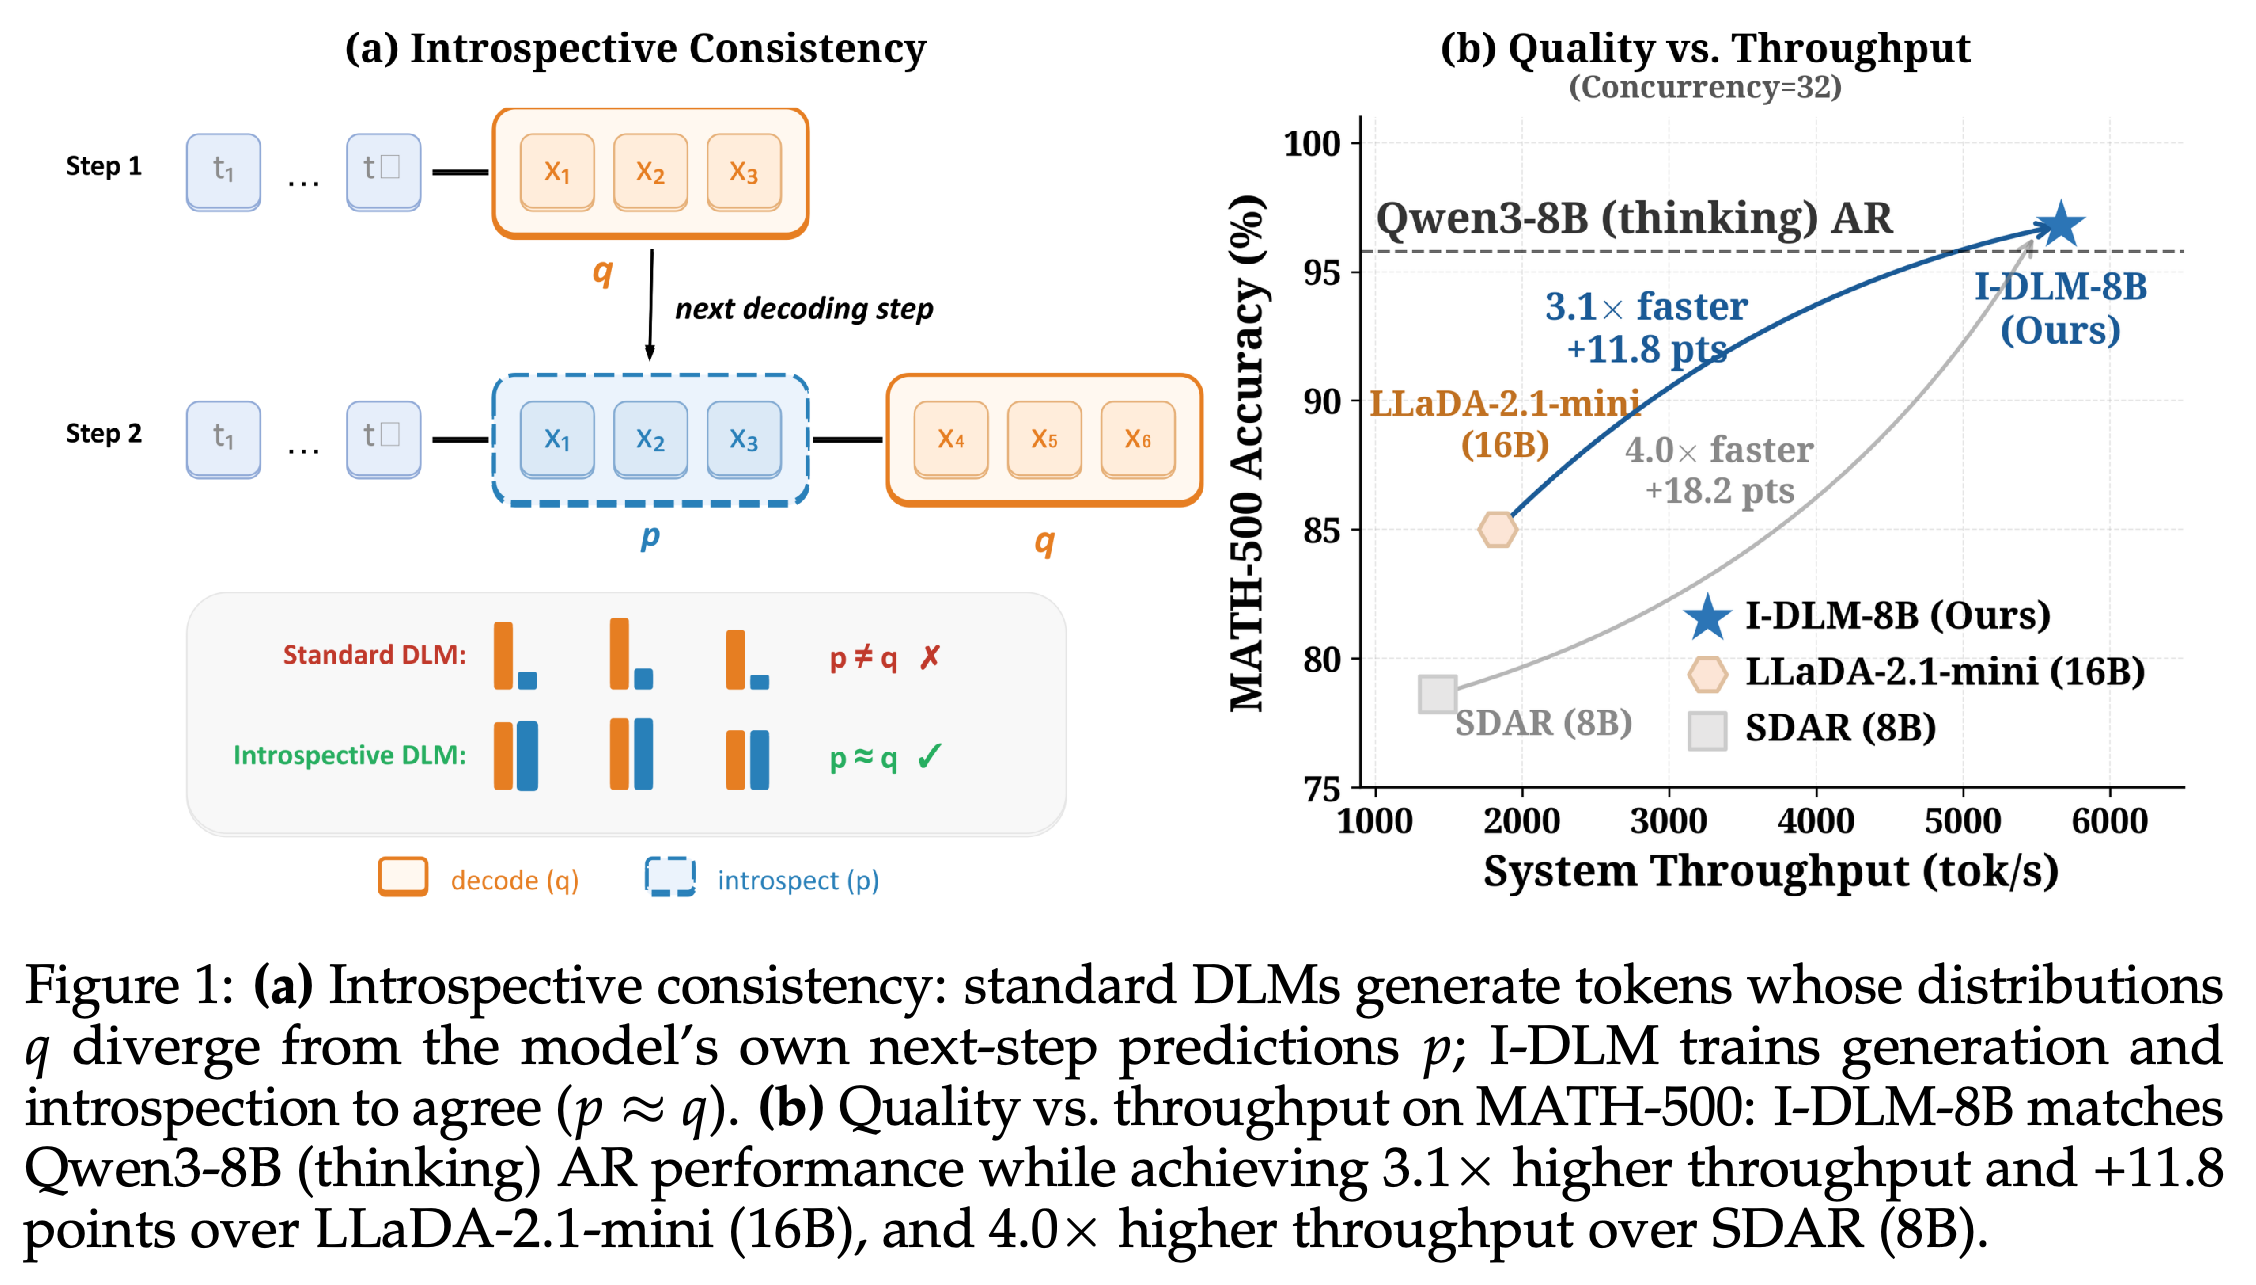
- The proposed principle is introspective consistency: proposal distributions should agree with the model’s causal predictions when the proposed tokens are revealed.
- Figure 1 compares MATH-500 results at concurrency 32: I-DLM-8B reaches 96.8% accuracy, versus 85.0% for LLaDA-2.1-mini and 78.6% for SDAR.
The left panel contrasts proposal distributions with revealed-context predictions. The right panel places I-DLM-8B near the Qwen3-8B accuracy reference on MATH-500 at concurrency 32, with higher throughput than the two plotted diffusion baselines. This is a workload-specific comparison, not an aggregate quality result.
2 Background and Motivation
The introspective acceptance rate is (\alpha=\frac{1}{L}\sum_k\min\left(1,\frac{p_k(x_k)}{q_k(x_k)}\right)), where qk generates token xk and pk evaluates it after the sequence is revealed under a causal predictive rule. On IFEval, Figure 2 reports 0.984 for I-DLM, 1.000 for Qwen3-8B, 0.699 for SDAR, and 0.568 for LLaDA 2.0; LLaDA 2.1 reaches 0.933 without editing and 0.949 with editing.
- This statistic measures generation–introspection agreement, not whether the answer is factually or logically correct.
- At batch size 8, the plotted throughput-versus-TPF slopes are 549 for I-DLM and 84 for SDAR. Higher token parallelism translates more effectively into throughput for I-DLM in this setting.
The panels separate generation–introspection agreement, analytical query overhead, and measured batching behavior. I-DLM’s acceptance rate of 0.984 approaches the AR reference of 1.000, and its throughput-versus-TPF slope of 549 exceeds SDAR’s 84 at batch size 8. The figure connects proposal alignment with useful serving progress under the tested conditions.
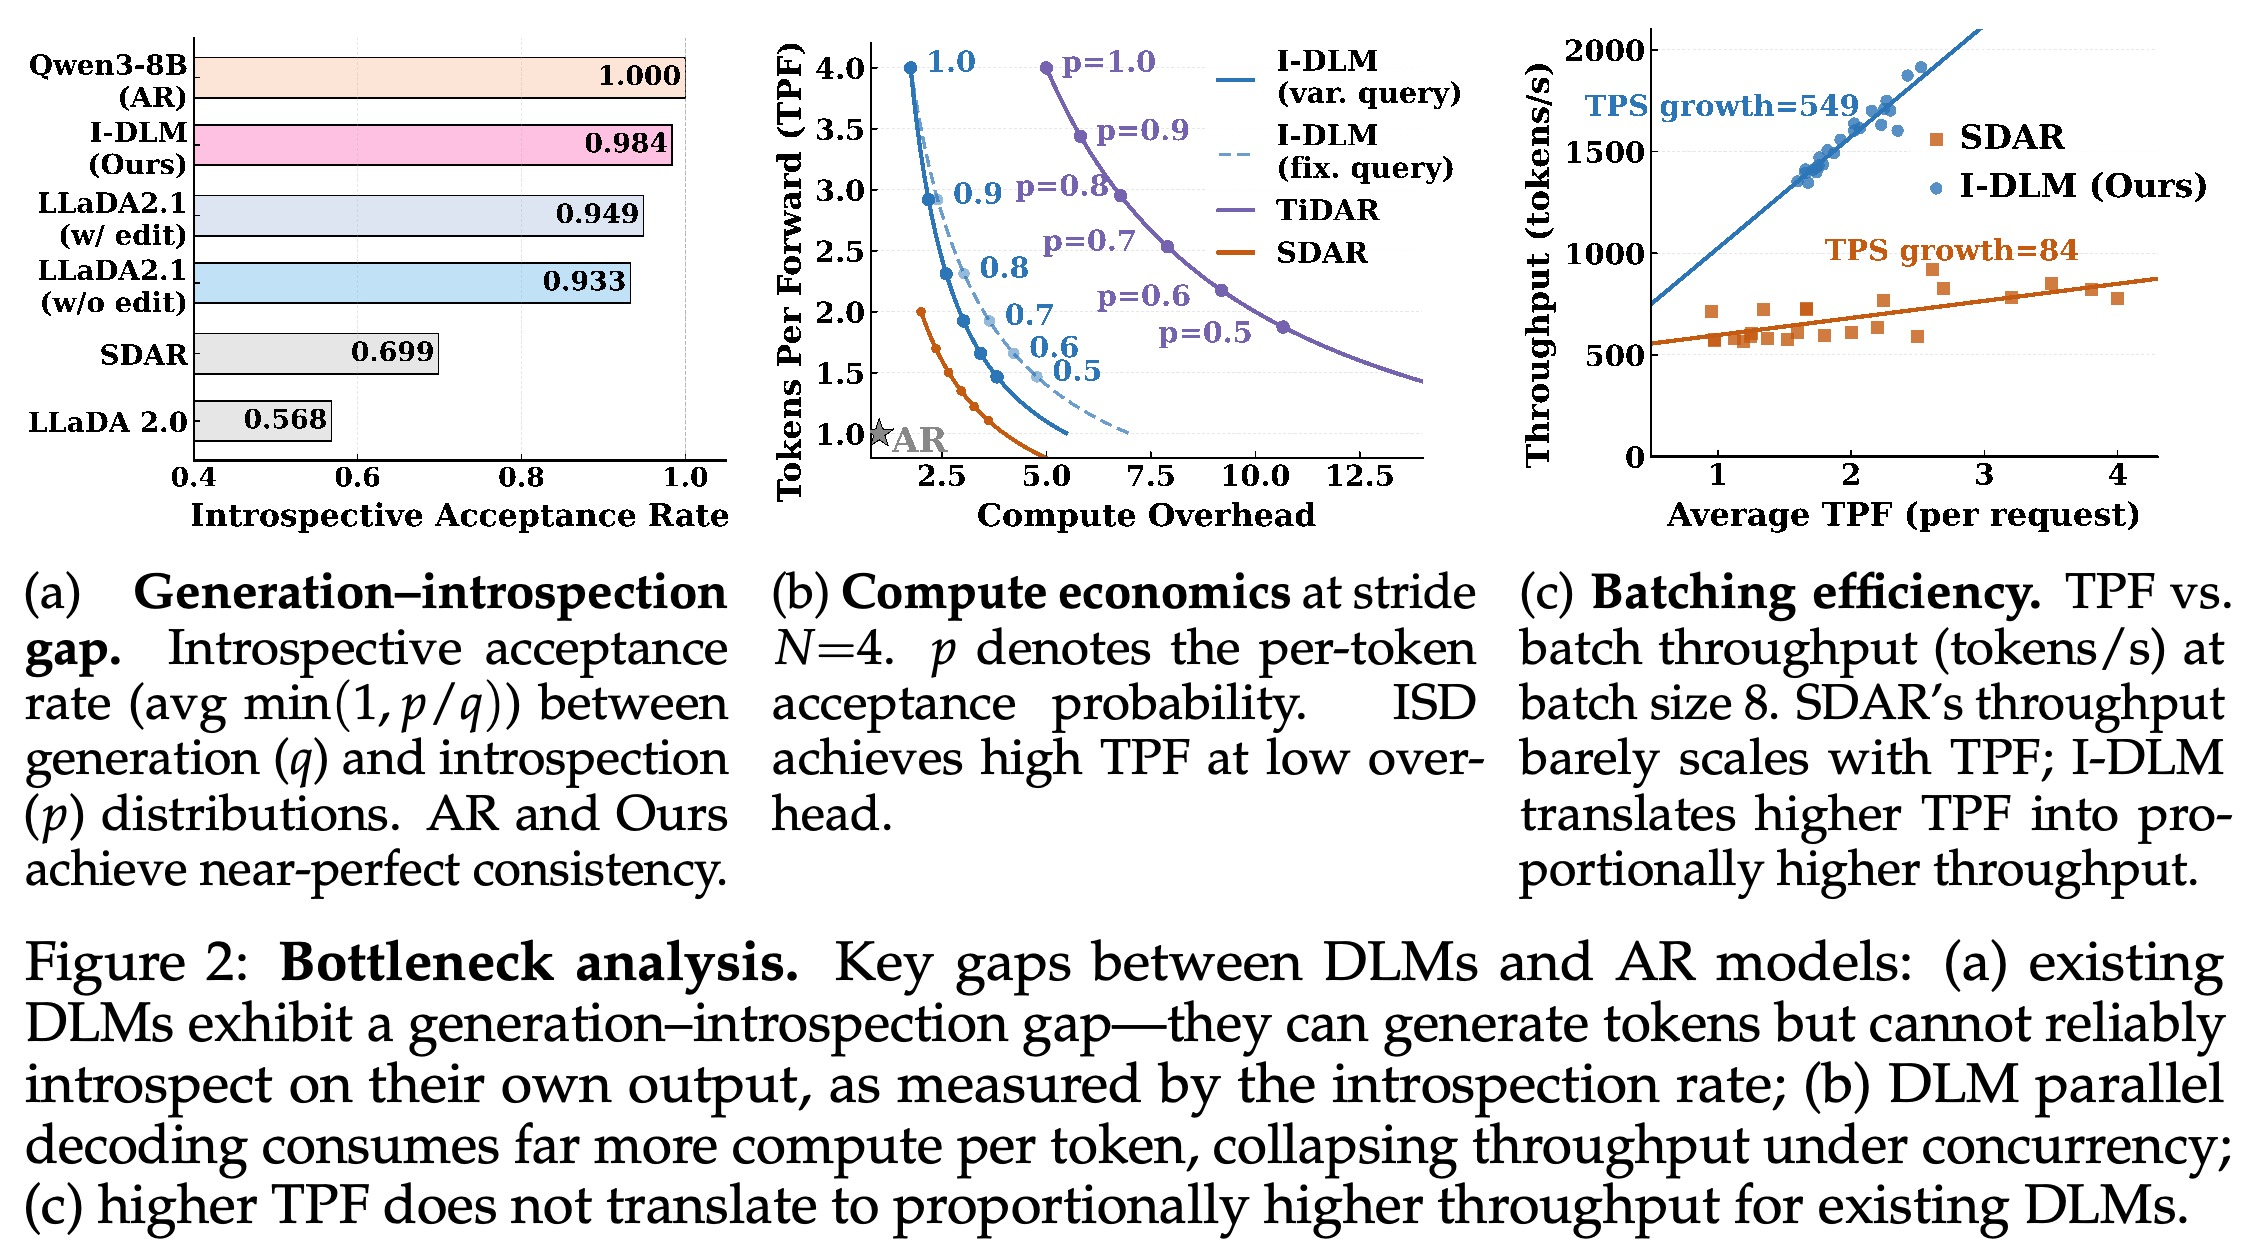
The analysis distinguishes tokens per forward pass (TPF) from overhead relative to AR decoding. At N=4 and TPF approximately 2.5, the main text reports approximately 2.5× overhead for I-DLM and 7.8× for TiDAR; SDAR is capped at TPF=2.0 in the analyzed execution scheme because block denoising requires a separate KV-commit pass.
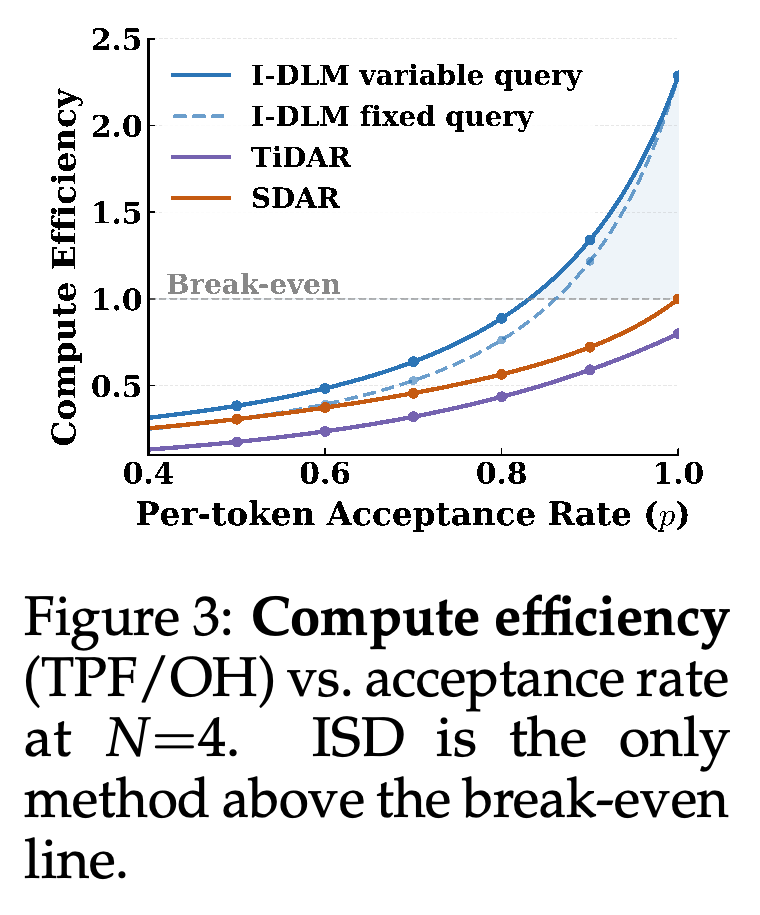
- Figure 3 defines compute efficiency as TPF/OH. ISD crosses the stated break-even threshold near acceptance probability 0.83 for variable queries and 0.86 for fixed queries.
- Appendix B models overhead through query tokens per output token, rather than directly measuring FLOPs. Wall-clock performance additionally depends on memory bandwidth, kernels, scheduling, and concurrency.
ISD’s variable- and fixed-query curves cross the TPF/OH=1 reference only at sufficiently high acceptance. High proposal alignment is therefore a condition for the stated efficiency advantage. The metric combines TPF with analytical query overhead and should not be interpreted as a direct wall-clock speedup.
3 Introspective Diffusion Language Model
I-DLM couples three design choices: train masked proposals and clean causal predictions together, verify proposals with ISD, and retain causal execution so existing AR serving infrastructure can be reused. The causal anchor supports both distributional verification and cache reuse, while the proposal pathway supplies parallelism without a separate draft model.
3.1 Introspective-Consistency Training
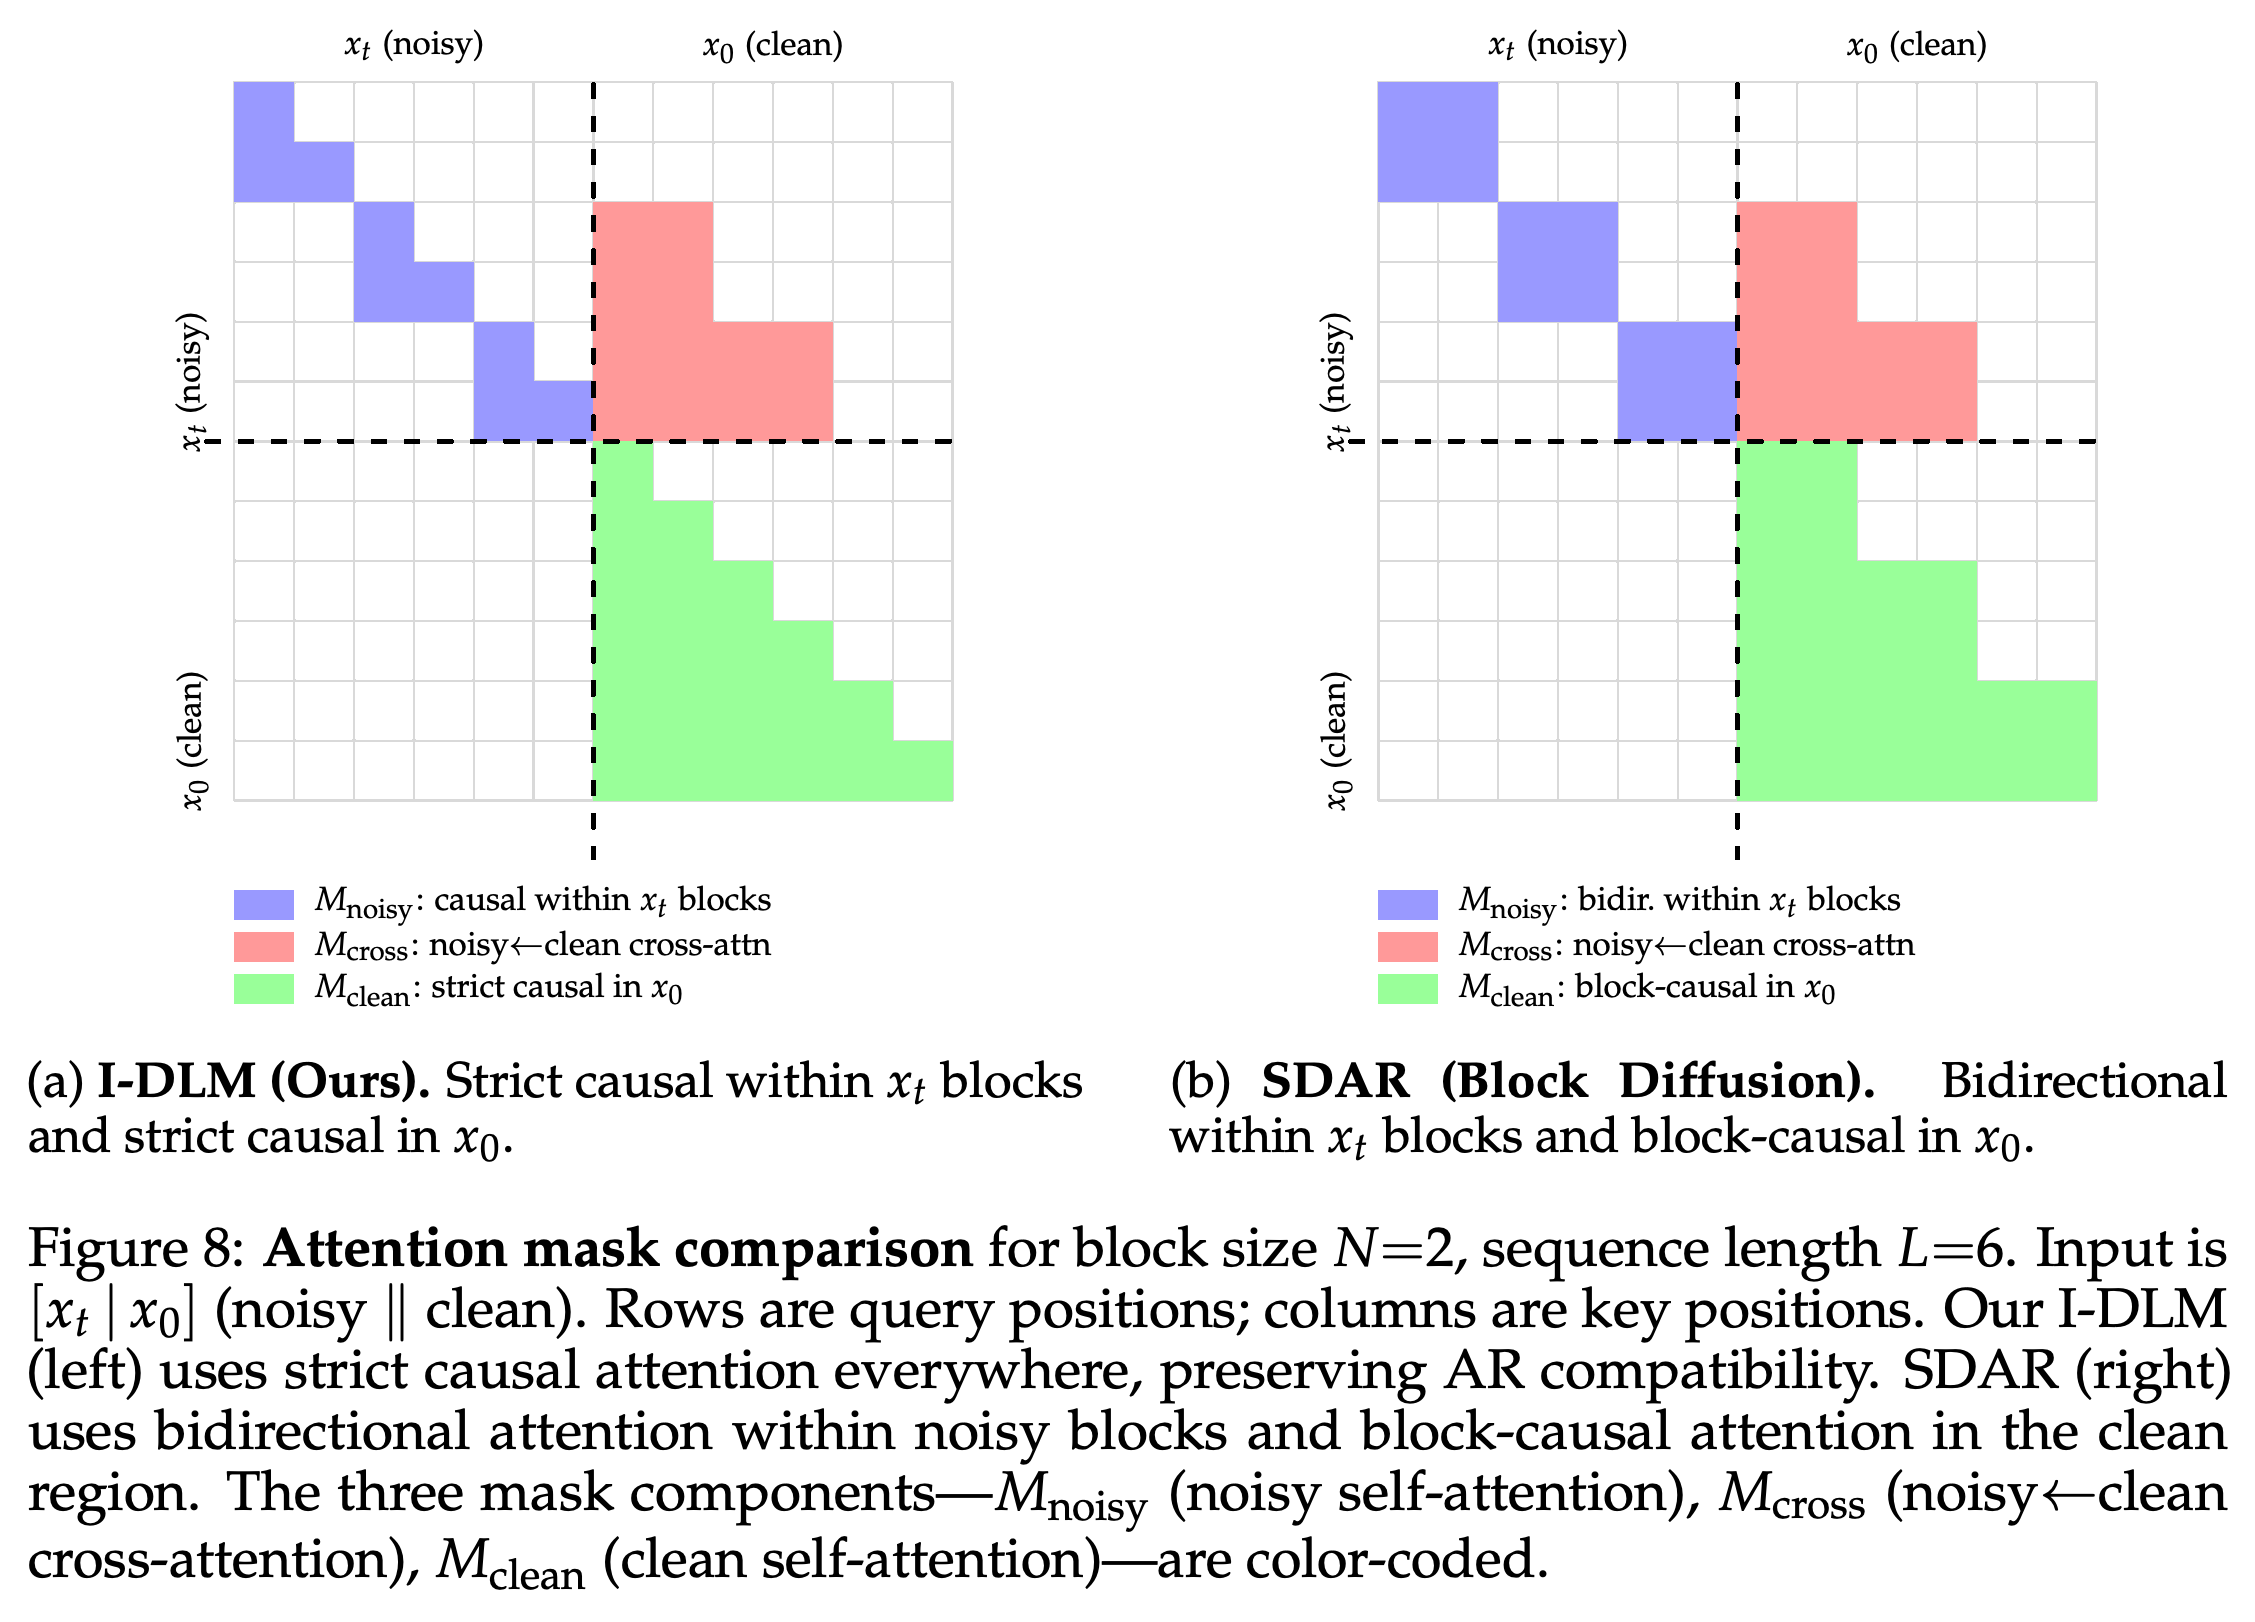
Training preserves the AR mapping logits[i] → token[i+1] rather than predicting token[i] from its own masked position. The input concatenates an all-masked region xt with a clean reference x0, and shifted cross-entropy losses supervise both regions. Figure 8 and Appendix E specify causal attention within noisy blocks, noisy-to-clean attention to preceding clean blocks, and strict token-level causal attention within the clean region.
- Clean positions learn the causal anchor p; masked positions learn proposal distributions q.
- All-masked supervision avoids the unsupervised positions produced by randomly masking only a fraction of tokens.
- The block-structured mask in Appendix E is not a single lower-triangular causal mask over the concatenated input, despite the simpler description in Section 3.1.
The matrices show the block-structured training mask behind the causal-training description. I-DLM removes bidirectional attention within noisy blocks and uses token-causal clean attention, while noisy blocks receive reference context from preceding clean blocks. This cross-region access is more specific than a global causal mask over the concatenation.
The proposed auto-balanced objective is L = Lmask + ŝ·Lclean, with ŝ = Lmask/Lclean treated as a detached scalar at each step. This equalizes the two weighted loss magnitudes without a teacher model or separate distillation objective; it does not establish equal gradient norms.
- Clean-position supervision maintains the verification pathway alongside the harder masked prediction task.
- Appendix H qualifies the general recipe: early 8B stride expansions use a fixed clean-loss scale of 0.2, and the 32B run also uses a fixed scale of 0.2 rather than the auto-balanced objective.
3.2 Introspective Strided Decoding (ISD)
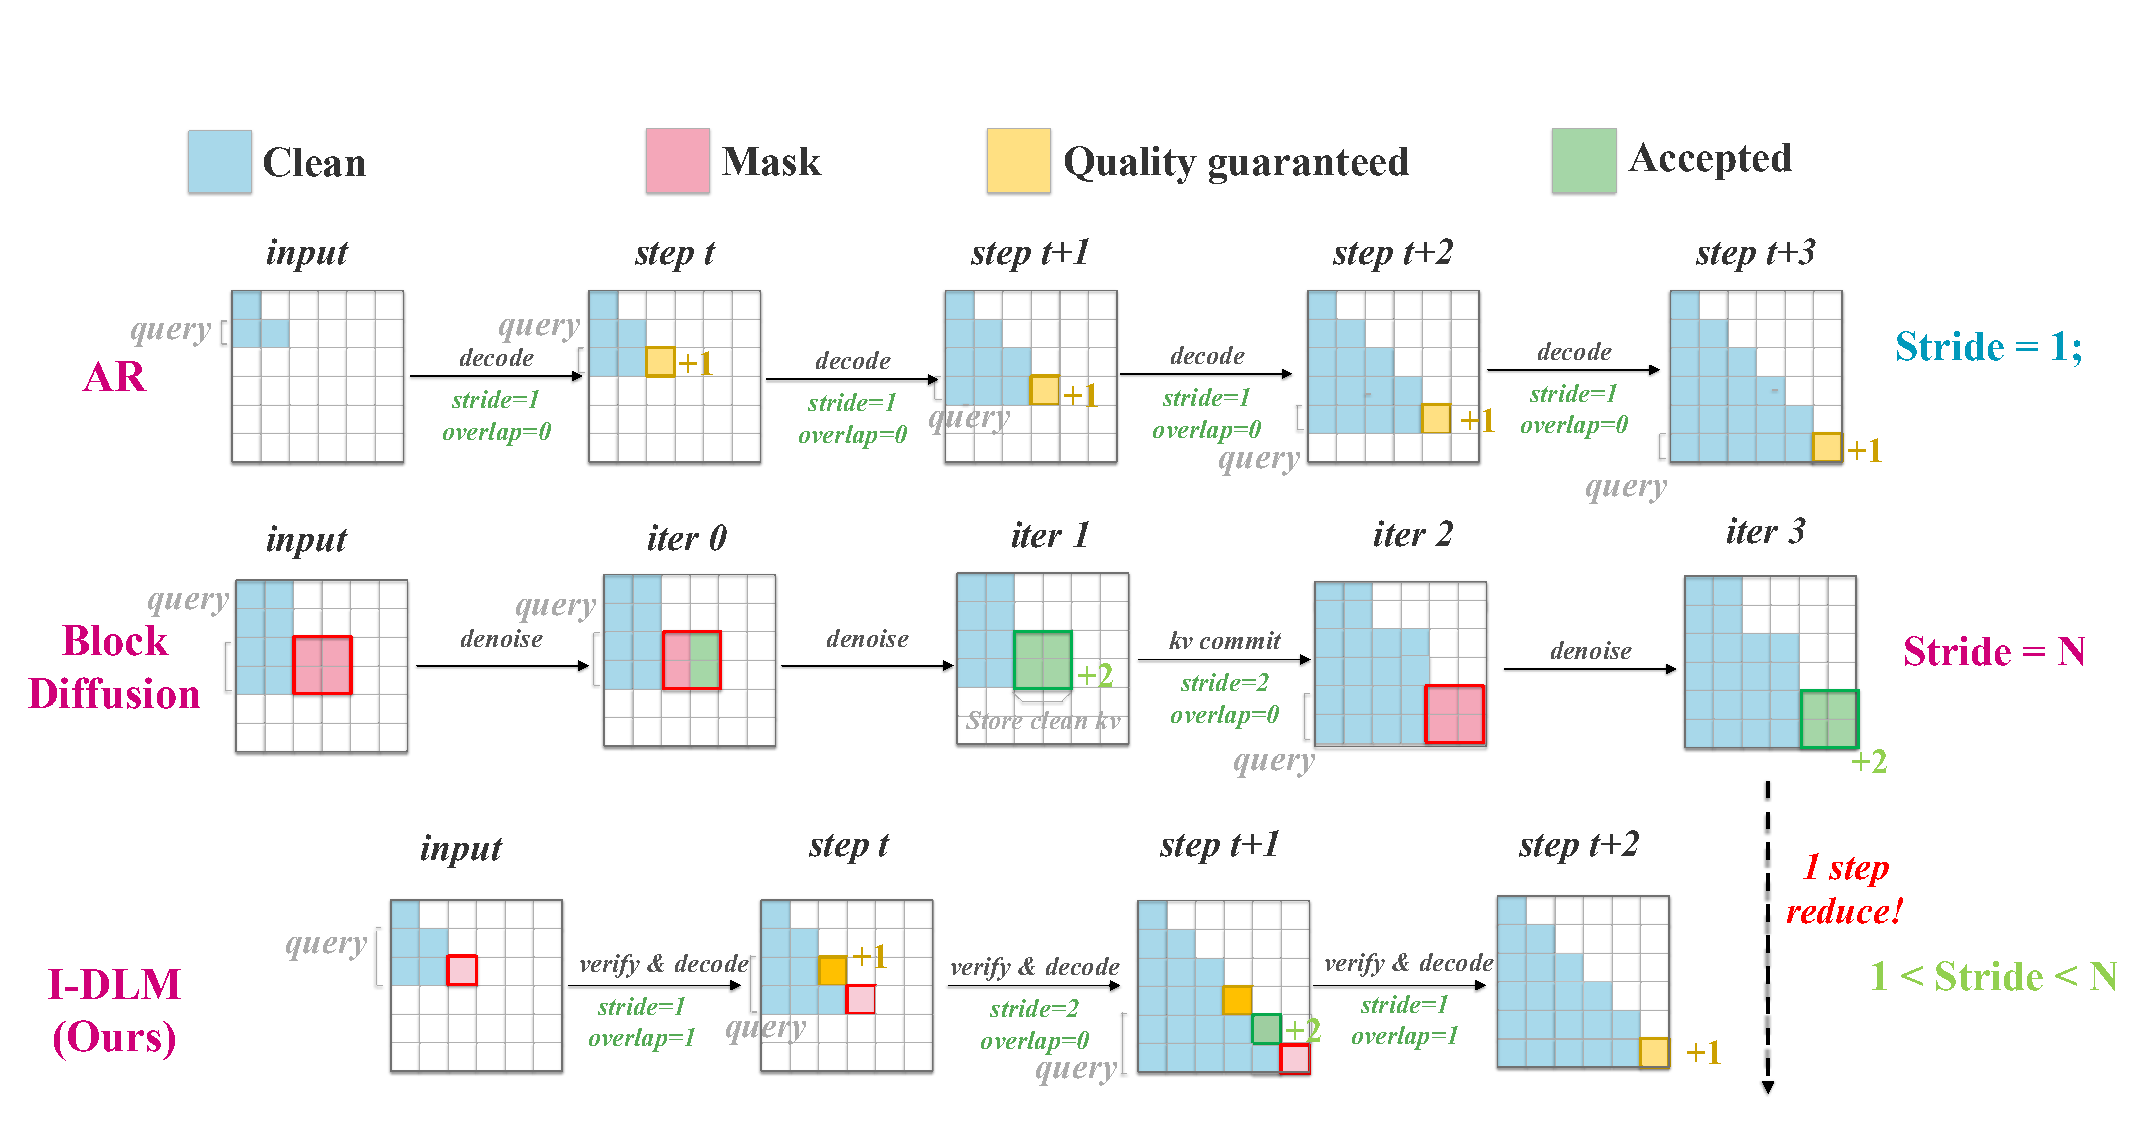
ISD begins with standard AR prompt prefill. In Algorithm 1, the last clean position yields one anchor-distributed token and N−1 mask positions yield speculative proposals; subsequent execution fuses verification of those proposals with new masked-token prediction. Figure 4 contrasts this overlap with sequential AR decoding and block diffusion’s separate denoising and KV-commit stages.
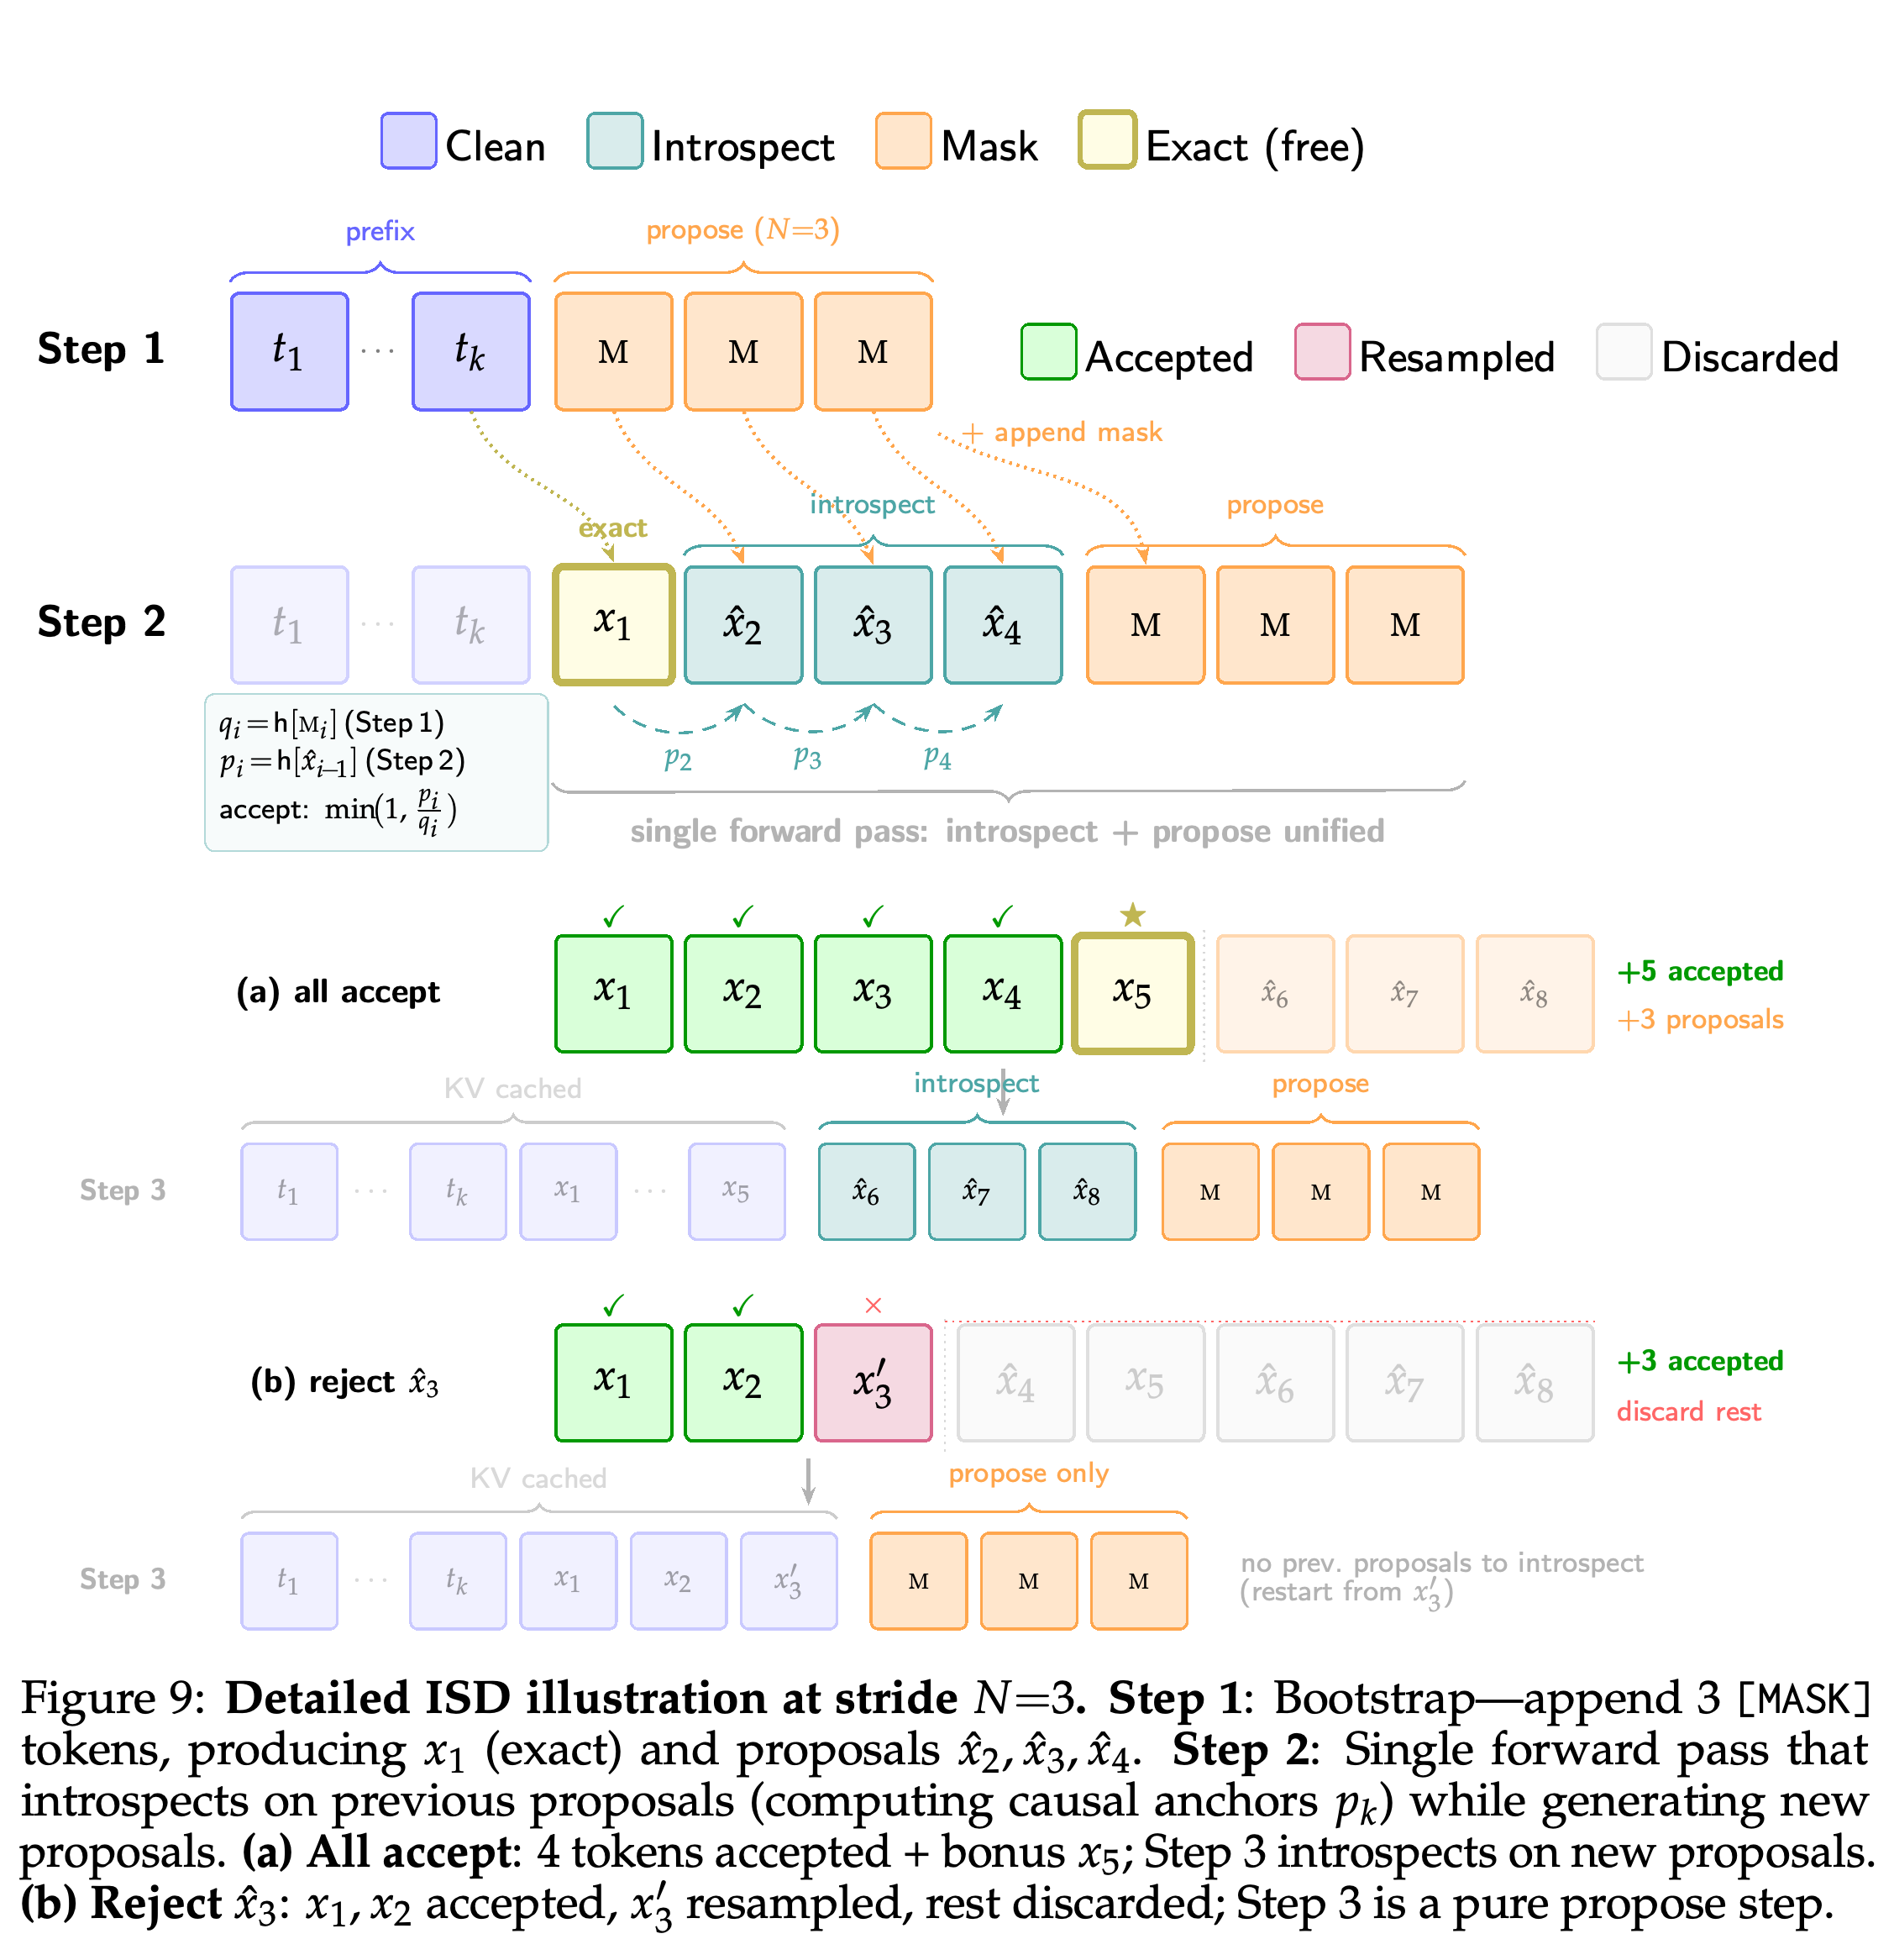
- Each proposal is accepted with probability (\min\left(1,\frac{p_k(x_k)}{q_k(x_k)}\right)). At the first rejection, ISD samples from normalize(max(0, pk−qk)) and discards subsequent proposals; acceptance together with correction preserves the anchor distribution.
- If all proposals pass, an additional token can be sampled from the final causal anchor. After a rejection, the next step generates proposals without verifying a previous speculative suffix.
- Figure 9 illustrates both paths, but its N=3 example uses three masks and three proposals plus an exact token, unlike Algorithm 1’s N−1-mask convention.
The attention-grid sequences show AR advancing one token at a time, block diffusion inserting a cache-commit stage, and I-DLM overlapping verification with proposal generation. The causal structure allows accepted-token cache entries to be retained without the separate bidirectional-block commit used in the illustrated baseline.
The all-accept path retains proposals and continues with another fused step; rejection corrects the first failed proposal and discards the suffix before restarting proposal generation. The illustration labels three masks as N=3, which differs from Algorithm 1’s convention of N−1 masks for stride N.
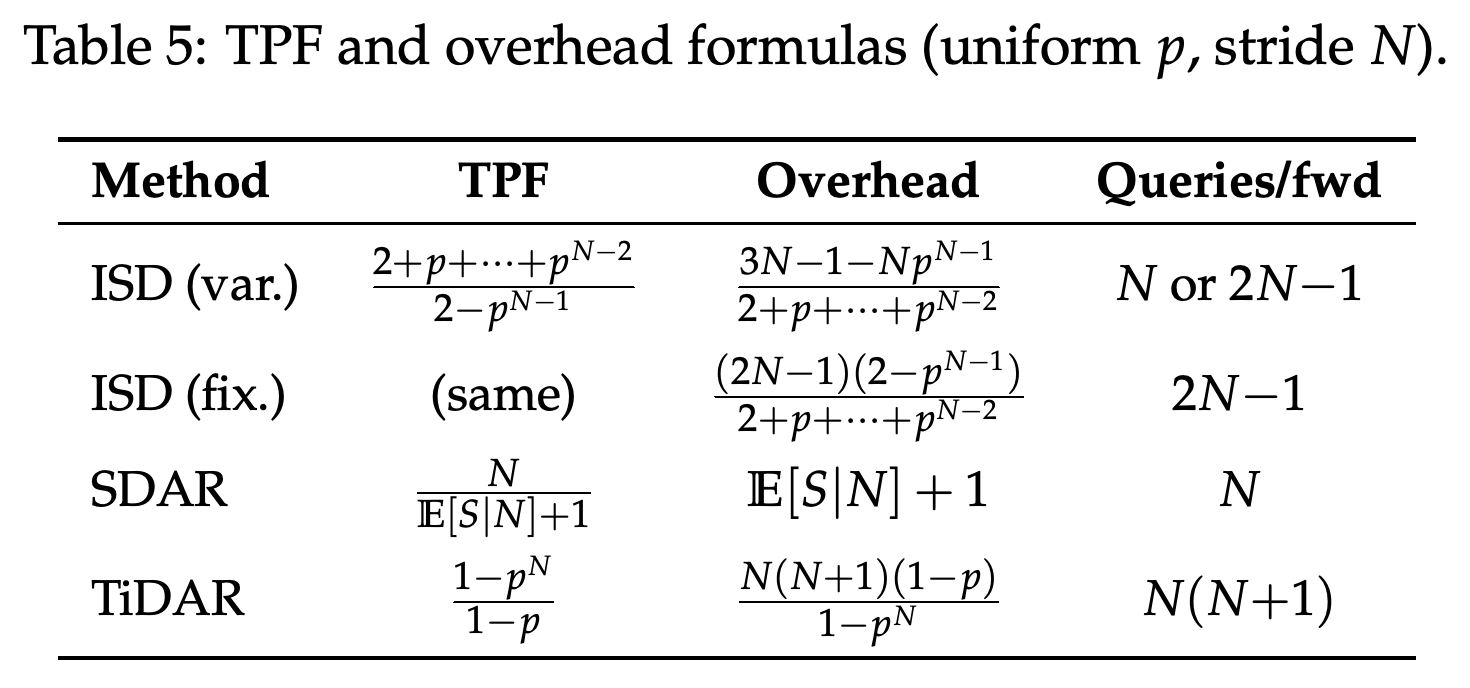
For cumulative proposal acceptance probabilities Pk, the paper derives TPFN = (2 + P1 + ⋯ + PN−2)/(2 − PN−1). This gives TPF=N at perfect acceptance and TPF=1 when acceptance is zero. Table 5 summarizes the query-overhead formulas and contrasts ISD’s proposal-only recovery steps with SDAR’s commit pass and TiDAR’s discarded branches.
- Fixed-query ISD processes 2N−1 query tokens per forward; the variable-query version processes N queries in proposal-only recovery steps.
- The approximation wall-clock speedup ≈ TPF applies to memory-bound decoding where forward latency changes little with stride, not to every serving regime.
The formulas identify different sources of query work: proposal-only recovery for ISD, a separate commit forward for SDAR, and unused speculative branches for TiDAR. They assume uniform acceptance and model query-token overhead, rather than measuring GPU FLOPs or latency.
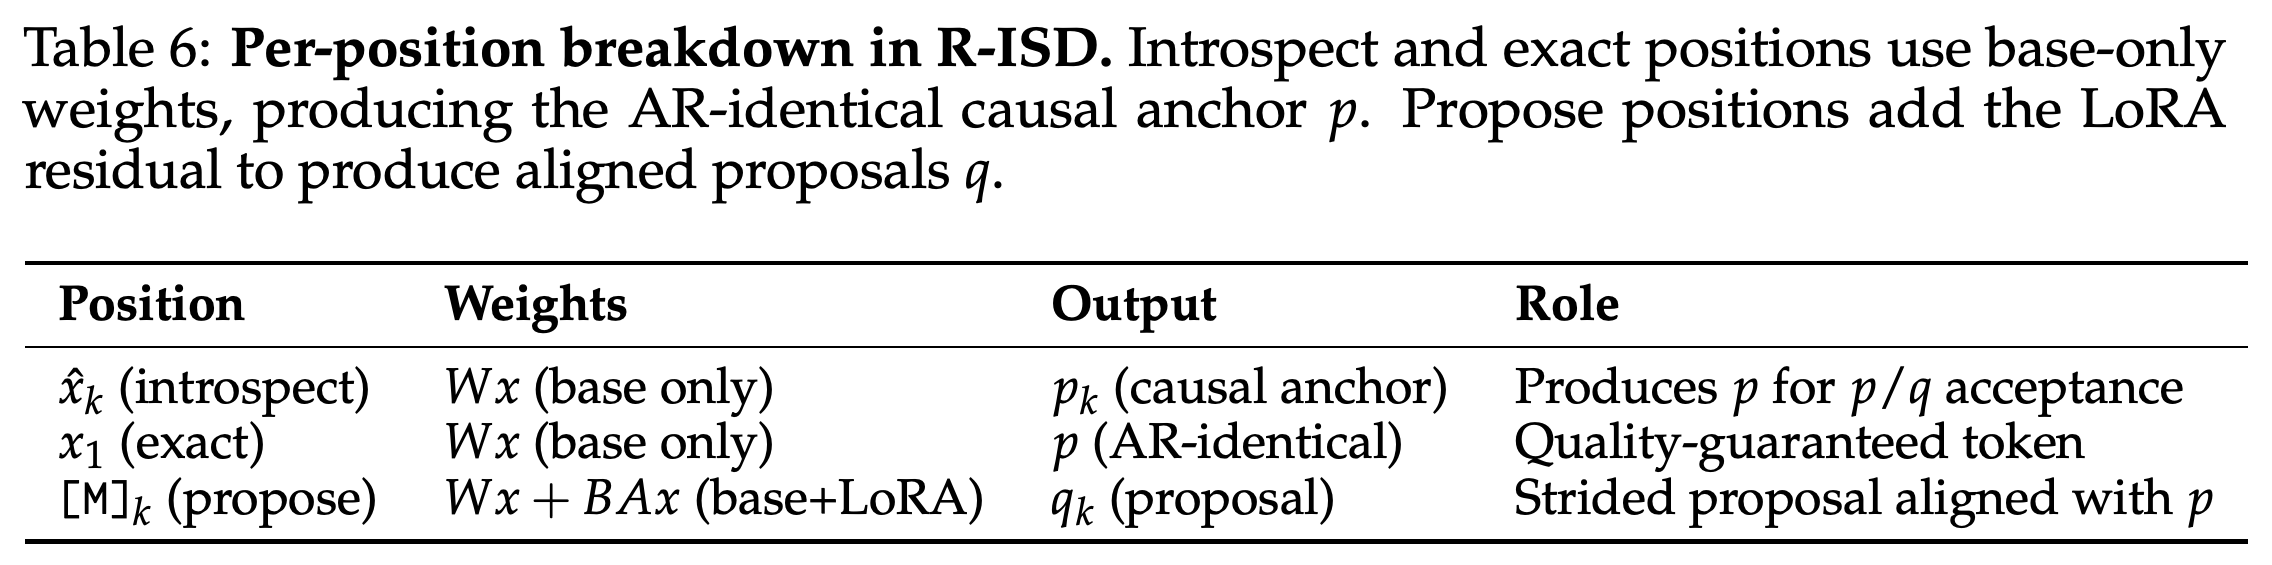
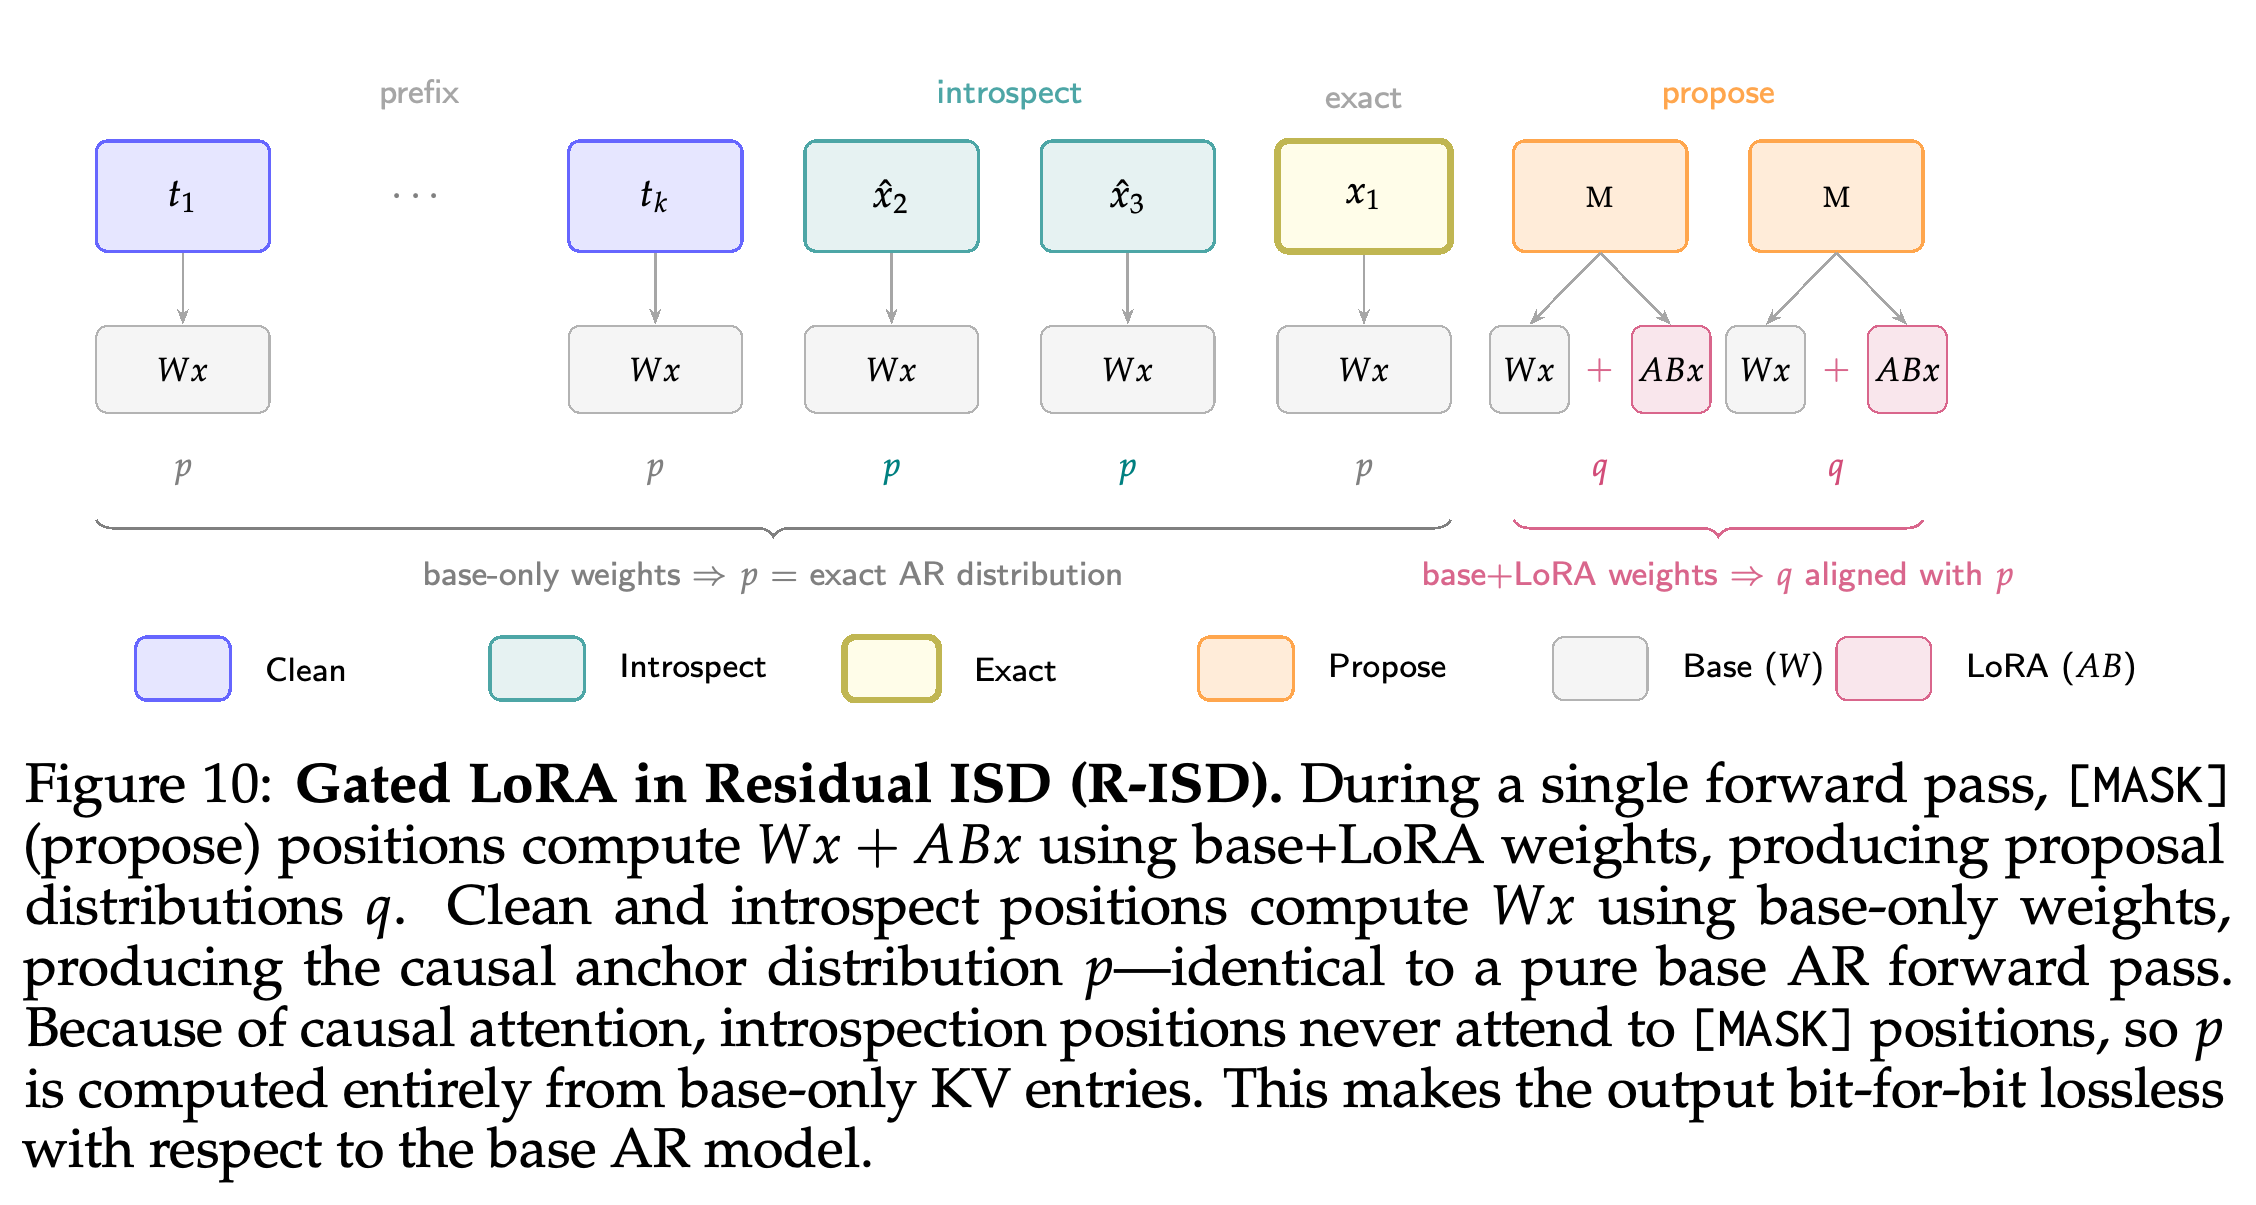
R-ISD applies LoRA residuals only at [MASK] positions, while clean and introspection positions use unchanged base weights. With masks appended after clean positions, strict causal attention keeps clean-position anchors and committed KV entries independent of the adapted proposal positions. Figure 10 and Table 6 explain this position-dependent separation.
- Ordinary strict ISD preserves the converted model’s causal anchor distribution, not necessarily the original pretrained model’s distribution.
- R-ISD preserves the original base AR target distribution under the stated gating and causal execution. The paper calls its output “bit-for-bit lossless,” but distribution preservation alone does not imply identical sampled sequences under arbitrary random-number and numerical execution choices.
The position-wise breakdown explains how proposal adaptation leaves verification unchanged: introspection and exact-token positions use base-only weights, whereas masked proposal positions activate LoRA. This separation, together with causal attention, preserves the original AR anchor in R-ISD.
The diagram assigns LoRA computation only to masked proposal positions and leaves clean and introspection positions on the base pathway. Causality keeps their anchors independent of later adapted masks, supporting target-distribution preservation. Identical sampled sequences require additional random-number and numerical execution assumptions.
3.3 I-DLM Serving Stack: AR-Compatible Serving
The serving implementation maps ISD to SGLang extend operations with 2N−1 causal query tokens, reusing paged KV cache, continuous batching, and tensor parallelism. CUDA graph replay captures the extend forward, and a single paged attention kernel replaces the ragged-attention, paged-attention, and merge cascade for small extensions of at most 9 tokens.
- Figure 7 reports that the cascade’s forward-latency overhead rises from +4% at C=1 to +20% at C=64.
- The stationary-batch loop reuses batch objects and metadata, allocates KV slots with batched scatter, trims rejected and masked entries, and defers non-critical I/O into the next GPU-forward window.
A fused Triton verification kernel uses online softmax and Gumbel-max correction, with the common acceptance path avoiding correction work. The serving stack uses argmax proposals and strict verification to preserve the target output distribution; the verification rule must use the distribution of the actual proposal mechanism. Segment-gated LoRA supports R-ISD inside CUDA graphs.
- The paper reports that approximately 78% of positions follow the common acceptance path.
- For small token counts, the LoRA implementation uses cuBLAS instead of segmented GEMV and overlaps LoRA shrink operations with base projections on a dedicated CUDA stream.
4 Experiments
Experiments evaluate converted Qwen3-8B and Qwen3-32B models, compare them with diffusion models and EAGLE-3, and separately measure benchmark quality and serving performance. Training-design ablations, cumulative systems ablations, stride extensions, and relaxed acceptance examine different parts of the quality–efficiency trade-off.
4.1 Evaluation Methodology
Quality evaluation uses thinking mode, temperature 1.0, top-k=50, top-p=0.95, and averages over three runs. Table 1 identifies ISD with N=4 and sampling; Appendix H lists a maximum generation length of 32,768 tokens, including the thinking block.
- The paper describes 15 benchmarks, but Table 1 contains 14 benchmark rows. Table 10 additionally lists TriviaQA without a corresponding main quality result.
- Code tasks use pass@1 with extracted Python code executed against tests under a 10-second timeout; IFEval uses the official evaluator after removing thinking blocks.
- LLaDA-2.1-mini, SDAR, and EAGLE-3 are reproduced through SGLang. Other diffusion baseline results come from their publications, so comparison conditions are not uniformly controlled.
Serving evaluation separates per-request tokens/s from server-level total tokens/s on MBPP, MATH-500, and LMSYS-Chat. Appendix H specifies burst arrivals, fixed 2,048-token outputs, five discarded warmup requests, and throughput measured as total tokens divided by elapsed time from first to last completion.
- The main text evaluates C ∈ {1, 2, 4, 8, 16, 32, 64}; Table 11 additionally lists C=48.
- The main serving setup uses H100 80GB SXM with NVLink, CUDA 12.9, and FlashInfer. The 8B configurations use one GPU per server, and the 32B configurations use tensor parallelism across two GPUs.
- These conditions do not directly test variable output lengths, sustained stochastic arrivals, or tail-latency service-level objectives.
4.2 End-to-End Performance
Table 1 shows large improvements over the listed diffusion baselines, but mixed results against same-scale AR models. I-DLM-8B matches Qwen3-8B on ARC-C at 95.8 and IFEval at 84.7, exceeds it on MATH-500 at 96.8 versus 95.8, and trails it on AIME-25 at 60.8 versus 65.4 and LiveCodeBench-v6 at 45.7 versus 50.3.
- Against LLaDA-2.1-mini (16B), I-DLM-8B gains 26.3 points on AIME-24 and 15.3 points on LiveCodeBench-v6.
- At 32B, I-DLM reaches 83.3 on AIME-24 versus Qwen3-32B’s 76.7, but scores 58.7 on GPQA versus 65.0.
- The table provides no uncertainty intervals or statistical tests. These per-task results do not establish statistical equivalence to the AR counterparts.
The N=4 results show large gains over the principal diffusion baselines but mixed results against AR: I-DLM-8B improves MATH-500 by 1.0 point while trailing Qwen3-8B by 4.6 points on both AIME-25 and LiveCodeBench-v6. Despite the caption’s reference to 15 benchmarks, the table contains 14 benchmark rows.
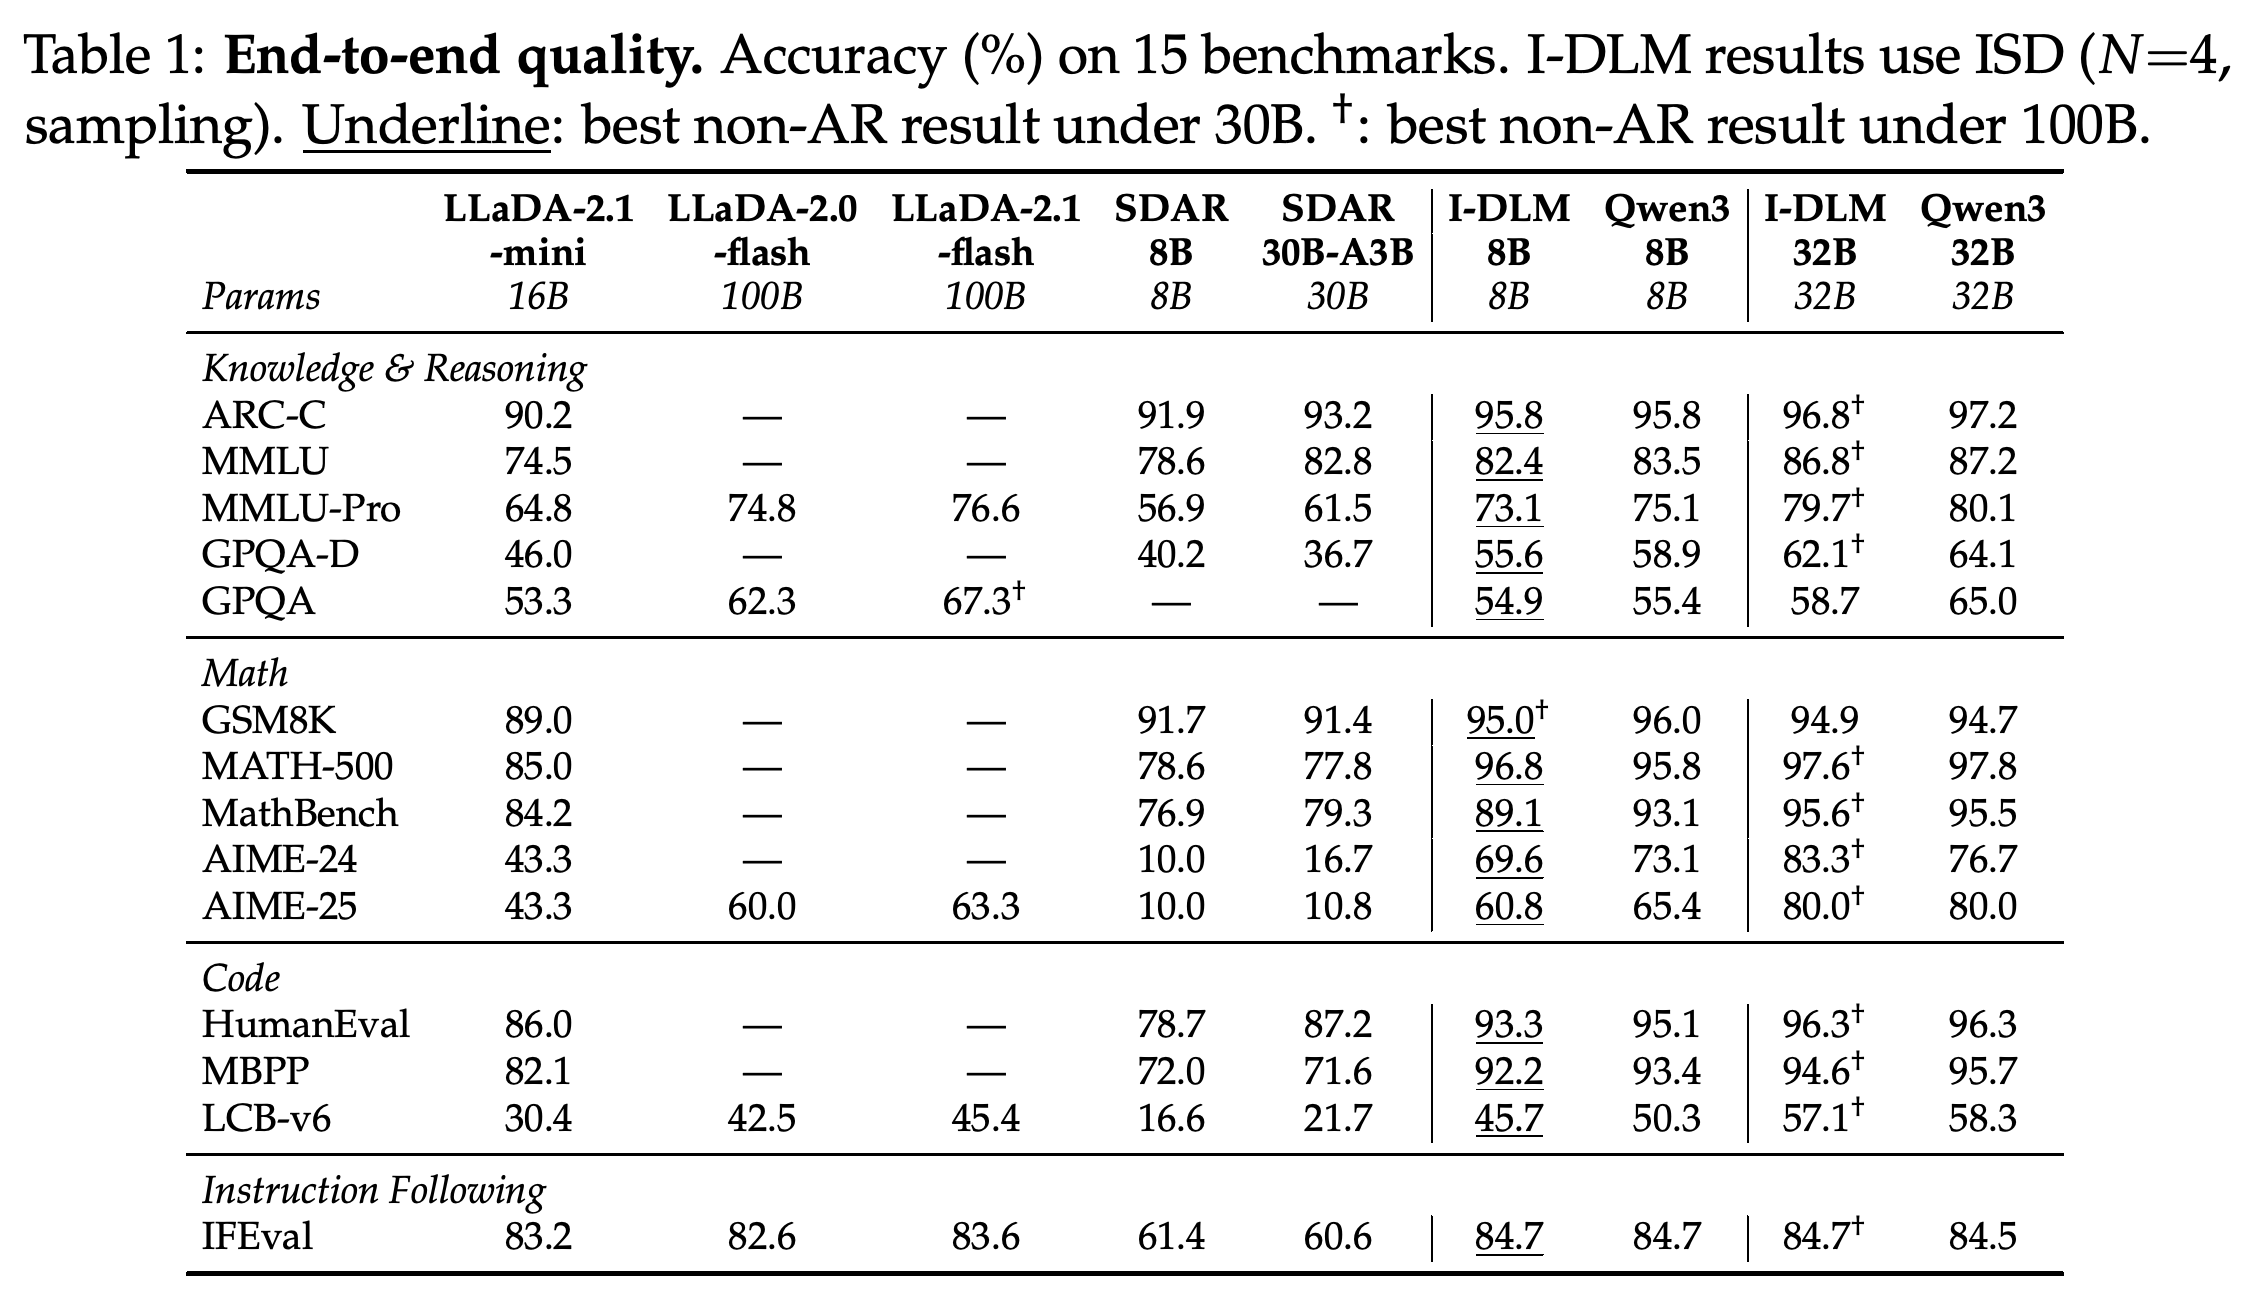
Table 2 extends the comparison to NBDiff, Jacobi Forcing, WeDLM, LightningRL, TiDAR, DREAM, Fast-dLLM, and proprietary diffusion models on commonly reported tasks. I-DLM-8B obtains 93.3 on HumanEval and 92.2 on MBPP, exceeding Mercury Coder Small’s 90.0 and 76.6 and Gemini Diffusion’s 89.6 and 76.0.
- Section 4.2 gives the proprietary models’ HumanEval and MBPP scores in misleading comparison pairs; Table 2 supplies the model-to-score mapping.
- I-DLM does not lead every reported diffusion comparison: NBDiff scores 82.9 on MMLU versus I-DLM’s 82.4.
- Missing results are marked “—,” so the table supports no conclusions on unreported tasks.
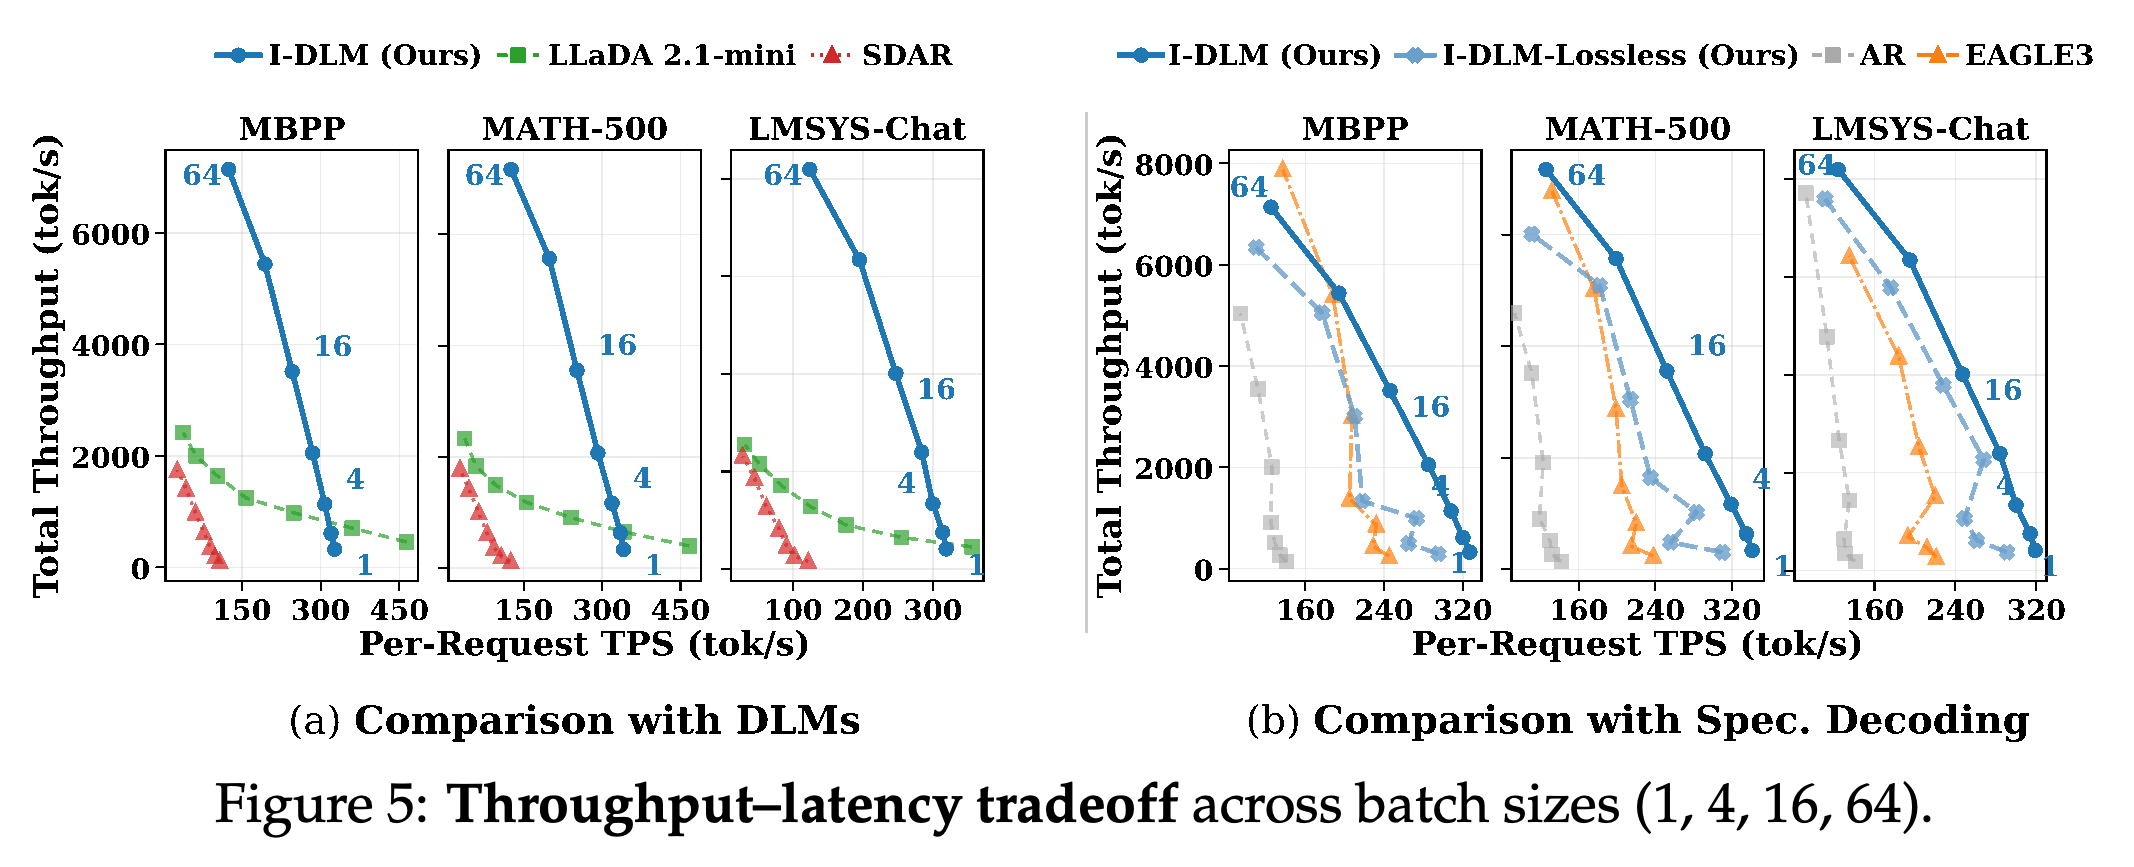
Figure 5 shows that I-DLM’s serving advantage over SDAR and LLaDA-2.1-mini grows with concurrency. At C=16–32, the reported throughput advantage is 2.2–3.8× over LLaDA-2.1-mini and 3.7–4.5× over SDAR; at C=64, the paper reports approximately 125 tok/s per request and 2.9–4.1× higher total throughput.
- At C=1 on MATH-500, the reported per-request rates are 341 tok/s for I-DLM and 238 tok/s for EAGLE-3; the main text reports 310 tok/s for I-DLM-Lossless.
- At C=32, I-DLM reports 199 versus 176 tok/s for EAGLE-3 on MATH-500 and 195 versus 184 tok/s on LMSYS-Chat.
- The paper claims an advantage over EAGLE-3 through C=32, not at every concurrency. Appendix peak measurements report different configurations and different lossless rates.
The curves jointly show per-request generation rate and aggregate throughput as concurrency increases. I-DLM retains higher throughput than the plotted diffusion baselines at moderate and high concurrency. Its comparison with EAGLE-3 depends on concurrency and whether ordinary or lossless I-DLM is used.
4.3 Ablation Studies
Figure 6 compares causal/logit-shift training with block-diffusion training under the same data budget. Its plotted values show HumanEval at 93.3 versus 60.3, MBPP at 92.2 versus 67.4, MathBench at 89.1 versus 71.6, and MMLU at 82.4 versus 80.0. The observed difference is larger on code and mathematical tasks than on MMLU.
- The accompanying prose instead uses 92.7 for HumanEval and 92.8 for MBPP, which differ from the plotted values.
- The comparison changes causal attention and logit shifting together. It neither isolates their individual contributions nor establishes acceptance rate as the sole mechanism behind the quality difference.
- The cumulative systems ablation improves throughput from 111 to 282 tok/s at C=1, 829 to 2,084 at C=8, and 2,791 to 5,882 at C=32. CUDA graphs provide the largest reported incremental gain.
The training panel shows larger quality differences on code and mathematics than on MMLU, but changes causal attention and logit shifting together. The systems panel shows that implementation work contributes materially to speed: the cumulative optimized stack achieves 2.1–2.5× the naive baseline throughput.
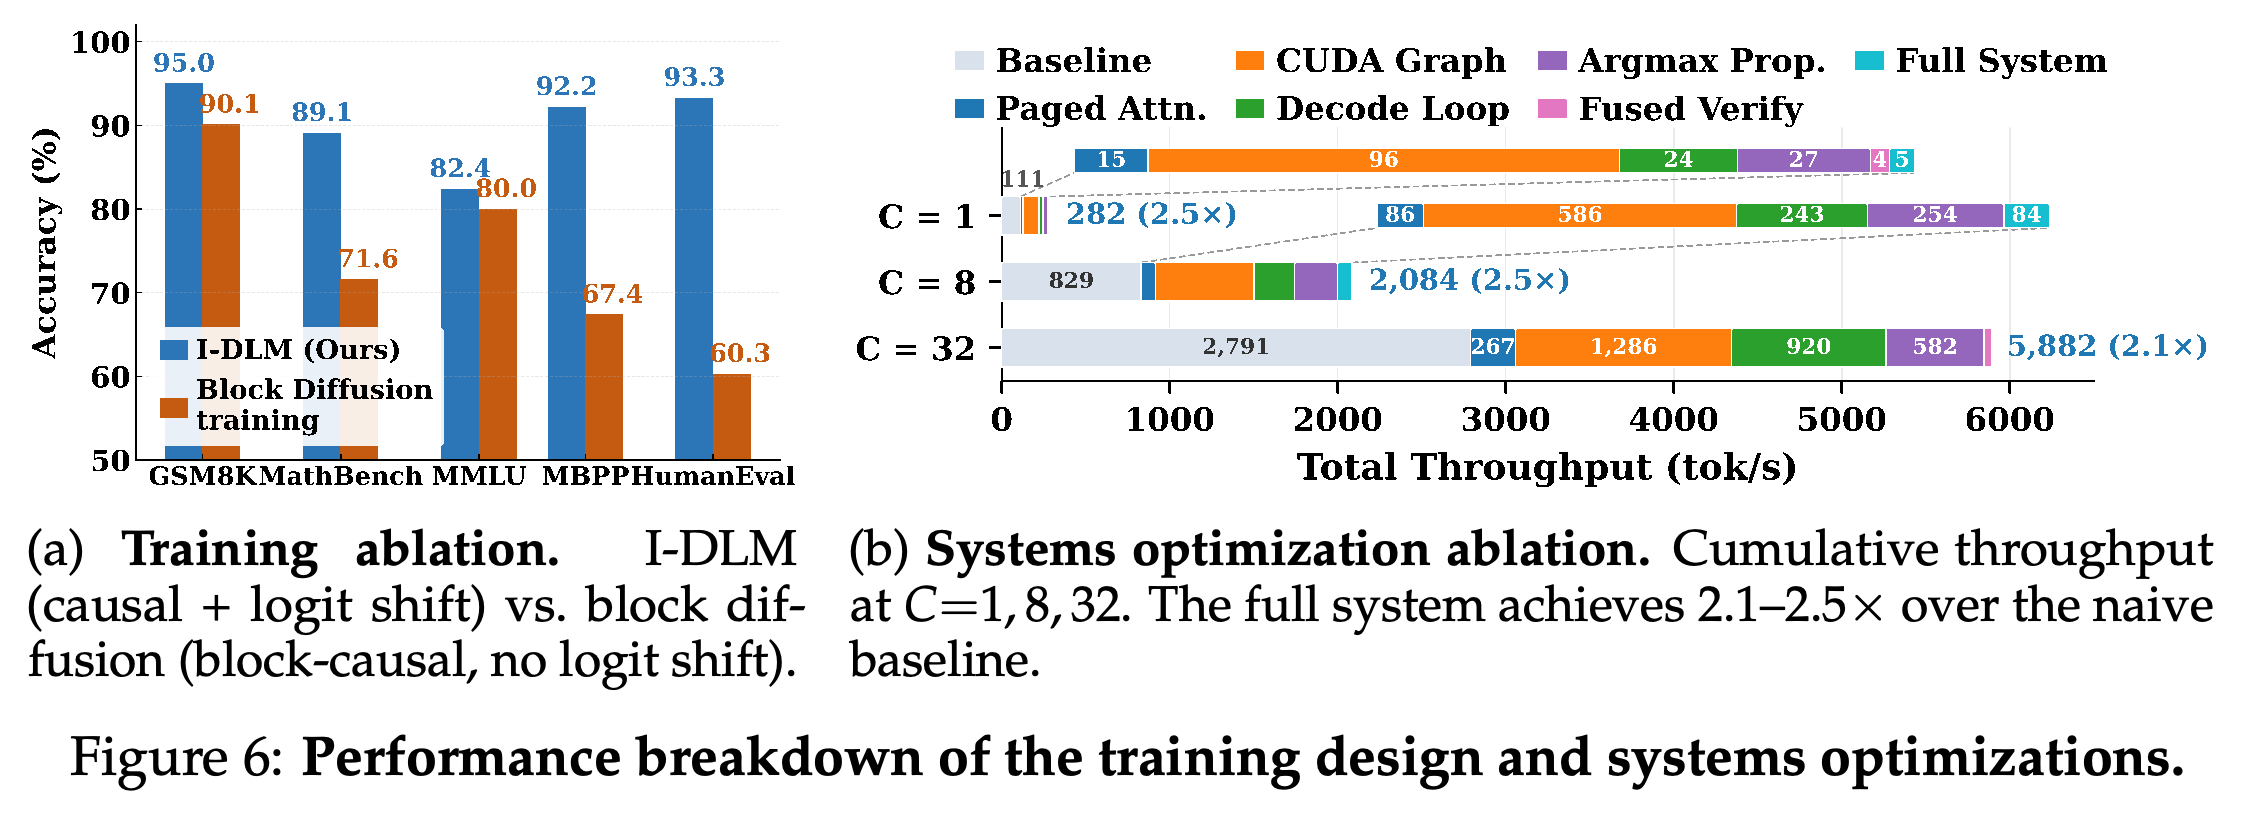
Table 3 measures stride on one H100 at batch size 1. Increasing N from 2 to 8 raises TPF from 1.80 to 4.01 and TPS from 209.6 to 445.1, while MATH-500 declines from 96.8 to 94.6 and MBPP from 93.4 to 88.3.
- At N=4, the table reports TPF=2.96, TPS=324.5, MATH-500=96.8, and MBPP=92.2.
- The larger-stride checkpoints receive continued training, so this is not purely an inference-time stride change on identical weights.
- The results show speed gains with a measurable quality cost, particularly on MBPP. TPF increases substantially but not in direct proportion to stride.
Larger trained strides increase tokens per forward and single-request speed, but reduce quality at N=8, especially on MBPP. Since stride extension includes continued training, the rows do not isolate an inference-only parameter change.
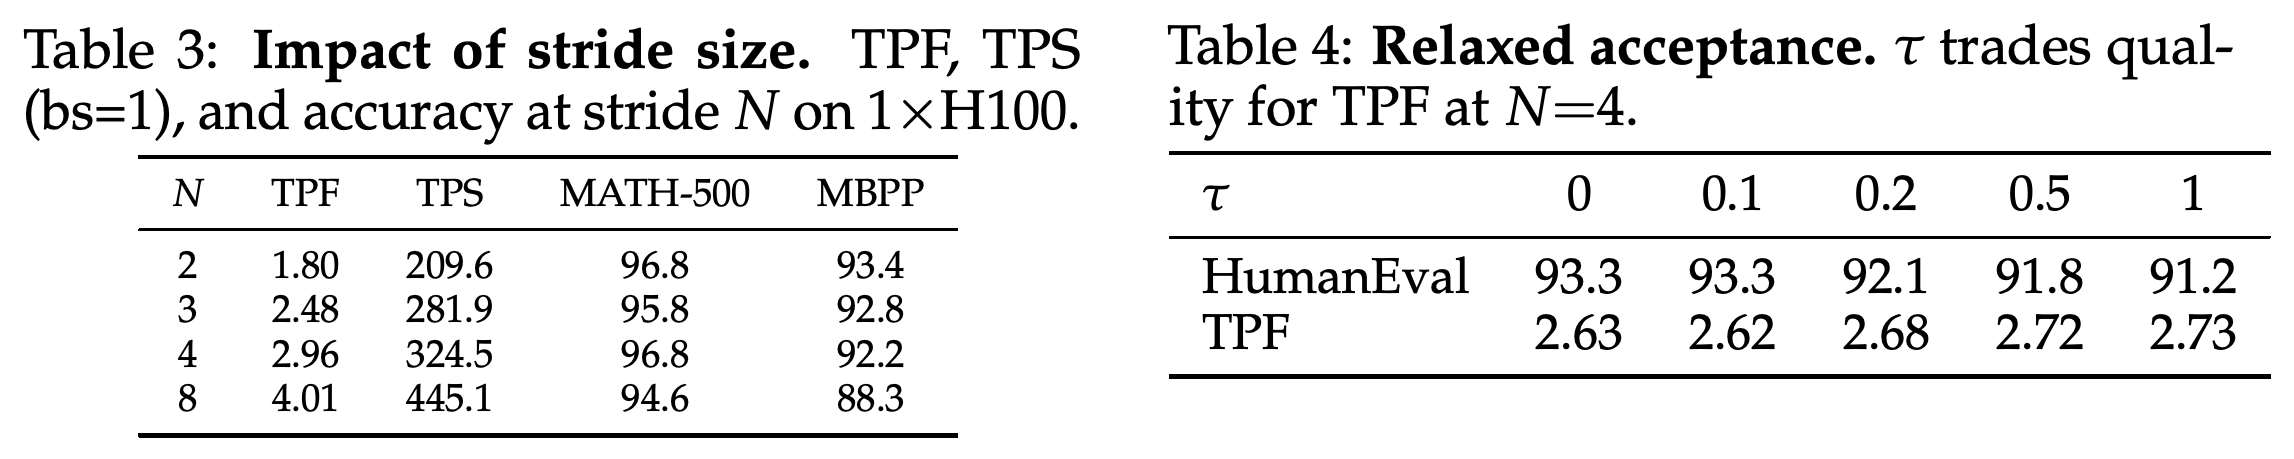
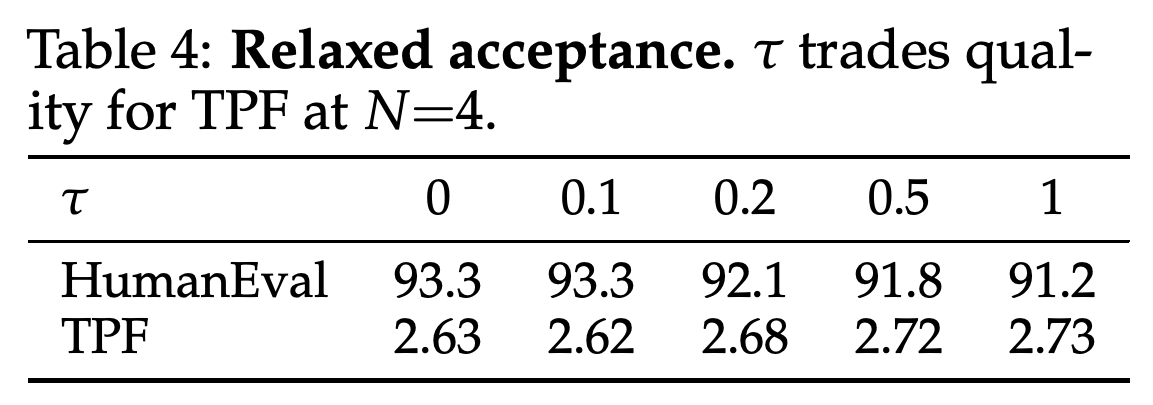
Table 4 relaxes acceptance by multiplying the ratio by 1+τ at N=4. From τ=0 to τ=1, TPF rises from 2.63 to 2.73 and HumanEval falls from 93.3 to 91.2. This is a 2.1-point decrease, although the prose calls it 1.6 points.
- At τ=0.1, HumanEval remains 93.3 and TPF is 2.62, slightly below the strict setting.
- Relaxation forfeits exact target-distribution preservation. The measured TPF gain is modest relative to the strict setting.
Relaxing acceptance from τ=0 to τ=1 increases TPF by 0.10 and reduces HumanEval by 2.1 points. The measured gain is modest, and the score difference does not match the prose’s stated 1.6-point decrease. Relaxed verification no longer preserves the exact target distribution.
5 Conclusion
The conclusion presents introspective consistency as a principle for converting AR models into parallel generators while retaining their causal prediction structure. The results show substantially better quality than the principal diffusion baselines and higher throughput under concurrent serving. Exact preservation of the original base AR distribution belongs specifically to the gated R-ISD construction.
Appendix
- A Detailed Related work places I-DLM among masked diffusion models, AR-to-diffusion conversion methods, speculative decoding, multi-token prediction, and DLLM-specific accelerators. I-DLM combines shared-model causal verification, shifted masked proposals, and serving-compatible execution rather than using a separate draft model or confidence-only acceptance.
- B TPF and Compute Overhead Analysis and B.1 ISD (Ours) derive renewal-cycle expectations for a proposal-only step followed by verification-and-proposal steps. Under uniform acceptance p, TPFISD = (2+p+⋯+p^(N−2))/(2−p^(N−1)); overhead is (3N−1−Np^(N−1))/(2+p+⋯+p^(N−2)) for variable queries and (2N−1)(2−p^(N−1))/(2+p+⋯+p^(N−2)) for fixed queries.
- B.2 Block Diffusion (SDAR) gives TPF=N/(E[S|N]+1) and OH=E[S|N]+1, including the commit forward. B.3 Branched Self-Speculative Decoding (TiDAR) gives TPF=1+p+⋯+p^(N−1) with N(N+1) queries per forward. B.4 Summary collects these formulas in Table 5; at perfect acceptance, TiDAR’s TPF/OH metric is N/(N+1), while SDAR is capped at N/2 tokens per forward in the analyzed scheme.
- C Why Block Diffusion Requires a Separate KV Commit Pass explains the cache-writing pass in the evaluated SGLang implementation and links https://github.com/sgl-project/sglang/pull/19044. Fusing commit and denoising would require mixed per-position attention patterns, larger queries, and more complicated batching. This describes an implementation barrier for the examined kernels, not an impossibility result for all block-diffusion systems.
- D Attention Kernel Overhead analyzes the three-kernel attention cascade and its replacement by one paged kernel per layer. E Attention Mask Structure decomposes the training mask into noisy self-attention, noisy-to-clean cross-attention, and clean self-attention, with preceding clean blocks supplying context to masked blocks.
- F ISD Step-by-Step Illustration uses Figure 9 to show all-accept continuation and rejection recovery. G Lossless ISD with Gated LoRA describes (h_j\leftarrow Wx_j+\mathbf{1}_{[j\in\mathcal{M}]}BAx_j): only mask positions receive the LoRA residual, while clean positions retain base-only anchors. Table 6 and Figure 10 show this separation, though Figure 10 writes the residual as ABx rather than the BAx notation used in the equation.
- H Training, Serving, and Evaluation Details and H.1 Training Setup identify https://github.com/JetAstra/SDAR as the training codebase and 4.5B tokens of generated reasoning responses as the dataset. The 8B schedule uses two epochs with N=2 then N=3; the 32B schedule uses one epoch at N=2 with rank-1024 LoRA. General hyperparameters include learning rate 1×10^-5, cosine decay, warmup ratio 0.03, effective batch size 32, sequence length 4096, and bf16; additional lossless adapters use rank 128 and learning rate 2e-4.
- H.2 Hardware and H.3 Serving Configuration specify H100 80GB SXM, NVLink, CUDA 12.9, FlashInfer, and SGLang, with common settings mem-fraction-static=0.85, attention-backend=flashinfer, and disable-radix-cache=true. Tables 7–9 list blockN3, blockN5, gated-LoRA configurations, and EAGLE-3 with draft identifier Tengyunw/qwen3 8b eagle3 and steps=3, topk=1, d=4. The 32B lossless serving row lists rank 1024, unlike the rank-128 additional lossless adapters described in H.1.
- H.4 Evaluation Configuration provides benchmark counts, answer extraction, and baseline reproduction details in Table 10. H.5 Throughput Benchmark Configuration links https://github.com/sgl-project/genai-bench and specifies burst-mode measurements in Table 11. H.6 Infrastructure Ablation Configuration lists serving toggles in Table 12; the reported experiment adds optimizations cumulatively on one H100 at C=1, 8, and 32.
- I Additional Results and I.1 Peak Throughput on Different Hardware report favorable low-concurrency, long-generation measurements in Table 13. Listed peaks include 925 TPS for N=8 on two B200 GPUs on GSM8K, 685 TPS for N=8 on two H100 GPUs on MBPP, and 341 TPS for N=4 on one H100 on MATH-500. The table also reports 272 TPS for N=3 I-DLM-8B and 240 TPS for rank-128 R-ISD on MATH-500; these are configuration-specific peaks rather than general serving rates.
Brief Thoughts
The contribution is the alignment of training, verification, and serving around a causal anchor. The quality table, combined training ablation, and concurrency curves support this design as a practical way to add parallel proposals to strong AR models. They do not establish introspective consistency as the unique explanation for prior DLM quality gaps.
The paper’s broad parity and losslessness claims require qualification: per-task AR deficits remain, baseline results mix reproduced and published measurements, and distributional preservation does not by itself imply identical sampled sequences. The main text and appendix also disagree on some scores, stride conventions, loss schedules, and adapter configurations. Component-wise training ablations, uncertainty estimates, consistent configuration reporting, and serving tests beyond fixed-length bursts would help resolve these limitations.