


SWE-chat: Coding Agent Interactions From Real Users in the Wild | Summary
22 Apr 2026 | Paper Review AI Coding Agents Datasets Human-Agent InteractionContents
- Summary
- 1 Introduction
- 2 SWE-chat
- 3 How do humans interact with coding agents in the wild? (RQ1)
- 4 How do coding agents fail and how do users respond? (RQ2)
- 5 Discussion
- Ethics statement
- Appendix
- Brief Thoughts
This article explains the key points of SWE-chat: Coding Agent Interactions From Real Users in the Wild.
- 2026-04-22 (arXiv), COLM 2026
- Baumann, Joachim, Padmakumar, Vishakh, Li, Xiang, Yang, John, Yang, Diyi, Koyejo, Sanmi.
- Stanford University
- Paper
- Github
- Project Page
Summary
- SWE-chat links real developer–agent conversations, tool trajectories, and commits with line-level human versus agent authorship. The September 2026 SWE-chat v2 release contains almost 18,000 sessions from 707 public GitHub repositories, more than 229,000 user prompts, and approximately 2 million tool calls.
- Understanding existing code is the most common specific prompt intent, at 18.2%. Committed-code authorship is strongly bimodal: 25.0% of sessions are human-only, 33.9% collaborative, and 41.1% vibe coding; near-total agent authorship does not imply an absence of human steering.
- Only 59.4% of cumulative agent-produced lines reach commits, while 65.4% of the agent’s final net output is retained unchanged. Vibe coding has a median cost of $2.71 per 100 committed lines versus $0.92 for collaborative coding, and introduces 0.47 Semgrep findings per 1,000 added lines versus 0.15 for collaborative and 0.12 for human-only coding.
- In Claude Code sessions, users interrupt or push back on 50.2% of prompts, whereas agents invoke the clarification tool in roughly 3% of turns. These observational results describe opt-in public-repository users; missing abandoned sessions, imperfect LLM annotations, and incomplete measures of developer effort limit generalization.
1 Introduction
The paper addresses the gap between curated software-engineering benchmarks and actual collaborative development. Isolated tasks with verifiable solutions do not capture how developers progressively specify requirements, correct agents, override actions, or discard generated code.
- RQ1 asks how users interact with coding agents in real-world coding tasks.
- RQ2 asks how agents fail in practice and how users respond.
- The introduction distinguishes benchmark task difficulty from usefulness and interaction costs in deployed workflows.
1.1 Our contributions
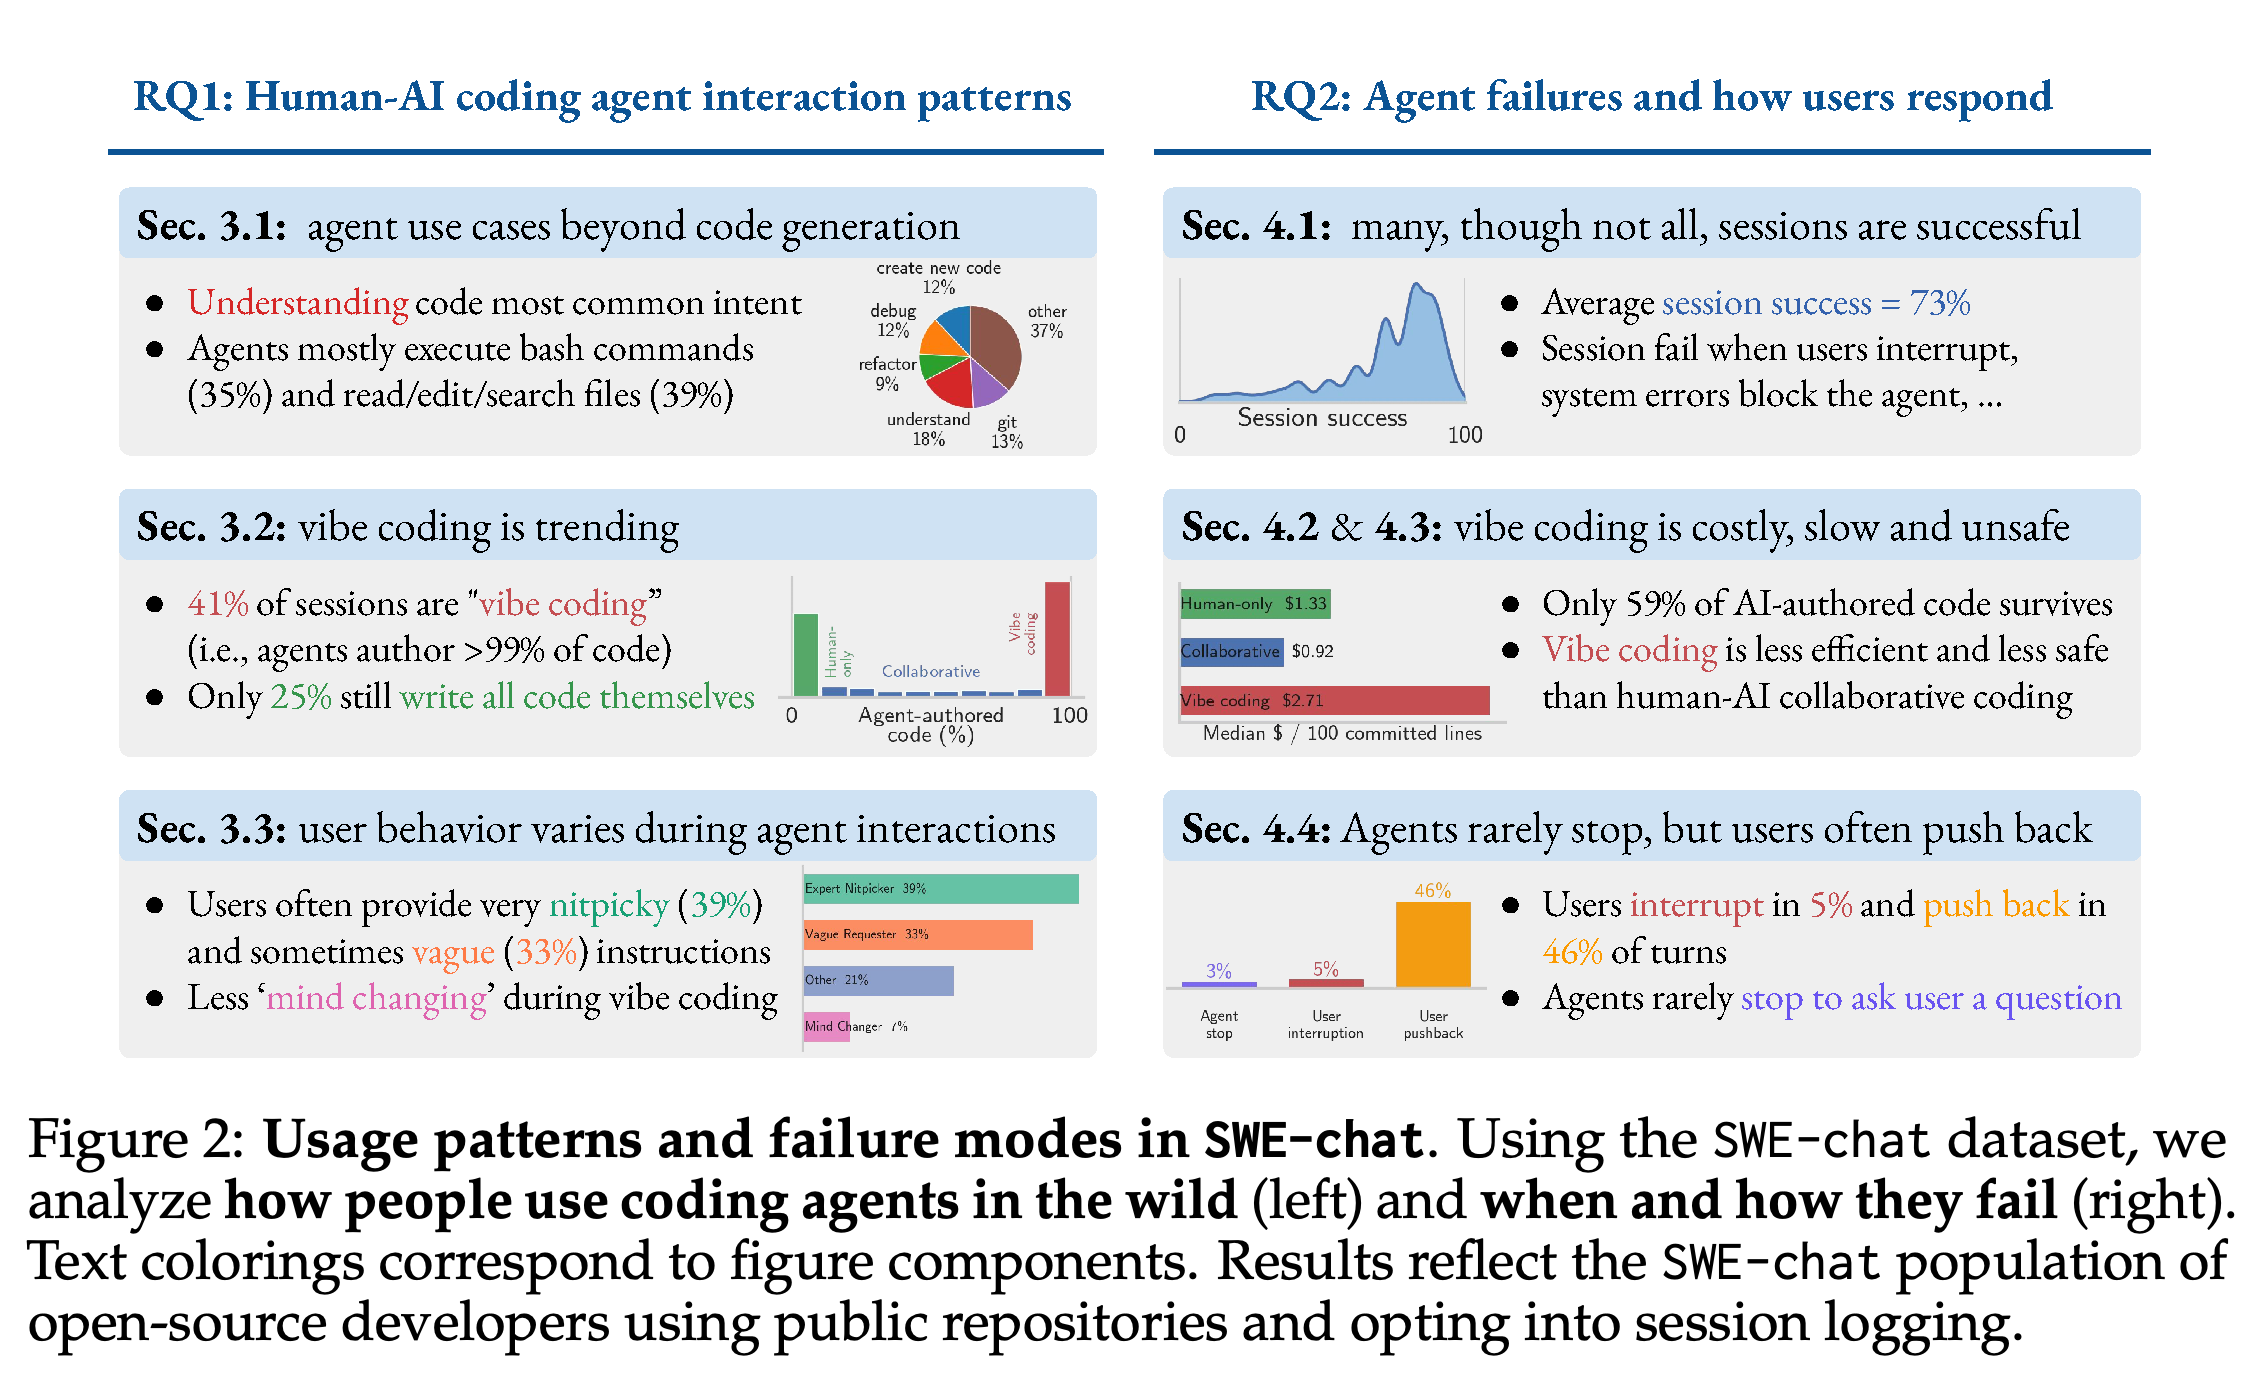
The principal contribution is a public dataset combining human prompts, complete agent tool-use trajectories, code diffs, and code attribution. Table 1 compares this combination with existing datasets; Figure 2 organizes the initial analysis around interaction patterns and failures.
- The empirical analysis covers task diversity, authorship modes, user behavior, retained code, resource consumption, security findings, and oversight.
- The reported increase in vibe coding is supported by a mixed-effects logistic regression with p < 0.001.
- An OLS analysis of cost per committed line, adjusted for prompt intent and repository domain, reports β = +0.46 and p < 0.001 for vibe coding. This adjustment does not establish causality.
The overview connects task diversity, authorship modes, and user personas with success ratings, efficiency, security findings, and oversight. Its rounded values summarize the opt-in population; the detailed sections supply the operative definitions and precise measurements.
2 SWE-chat
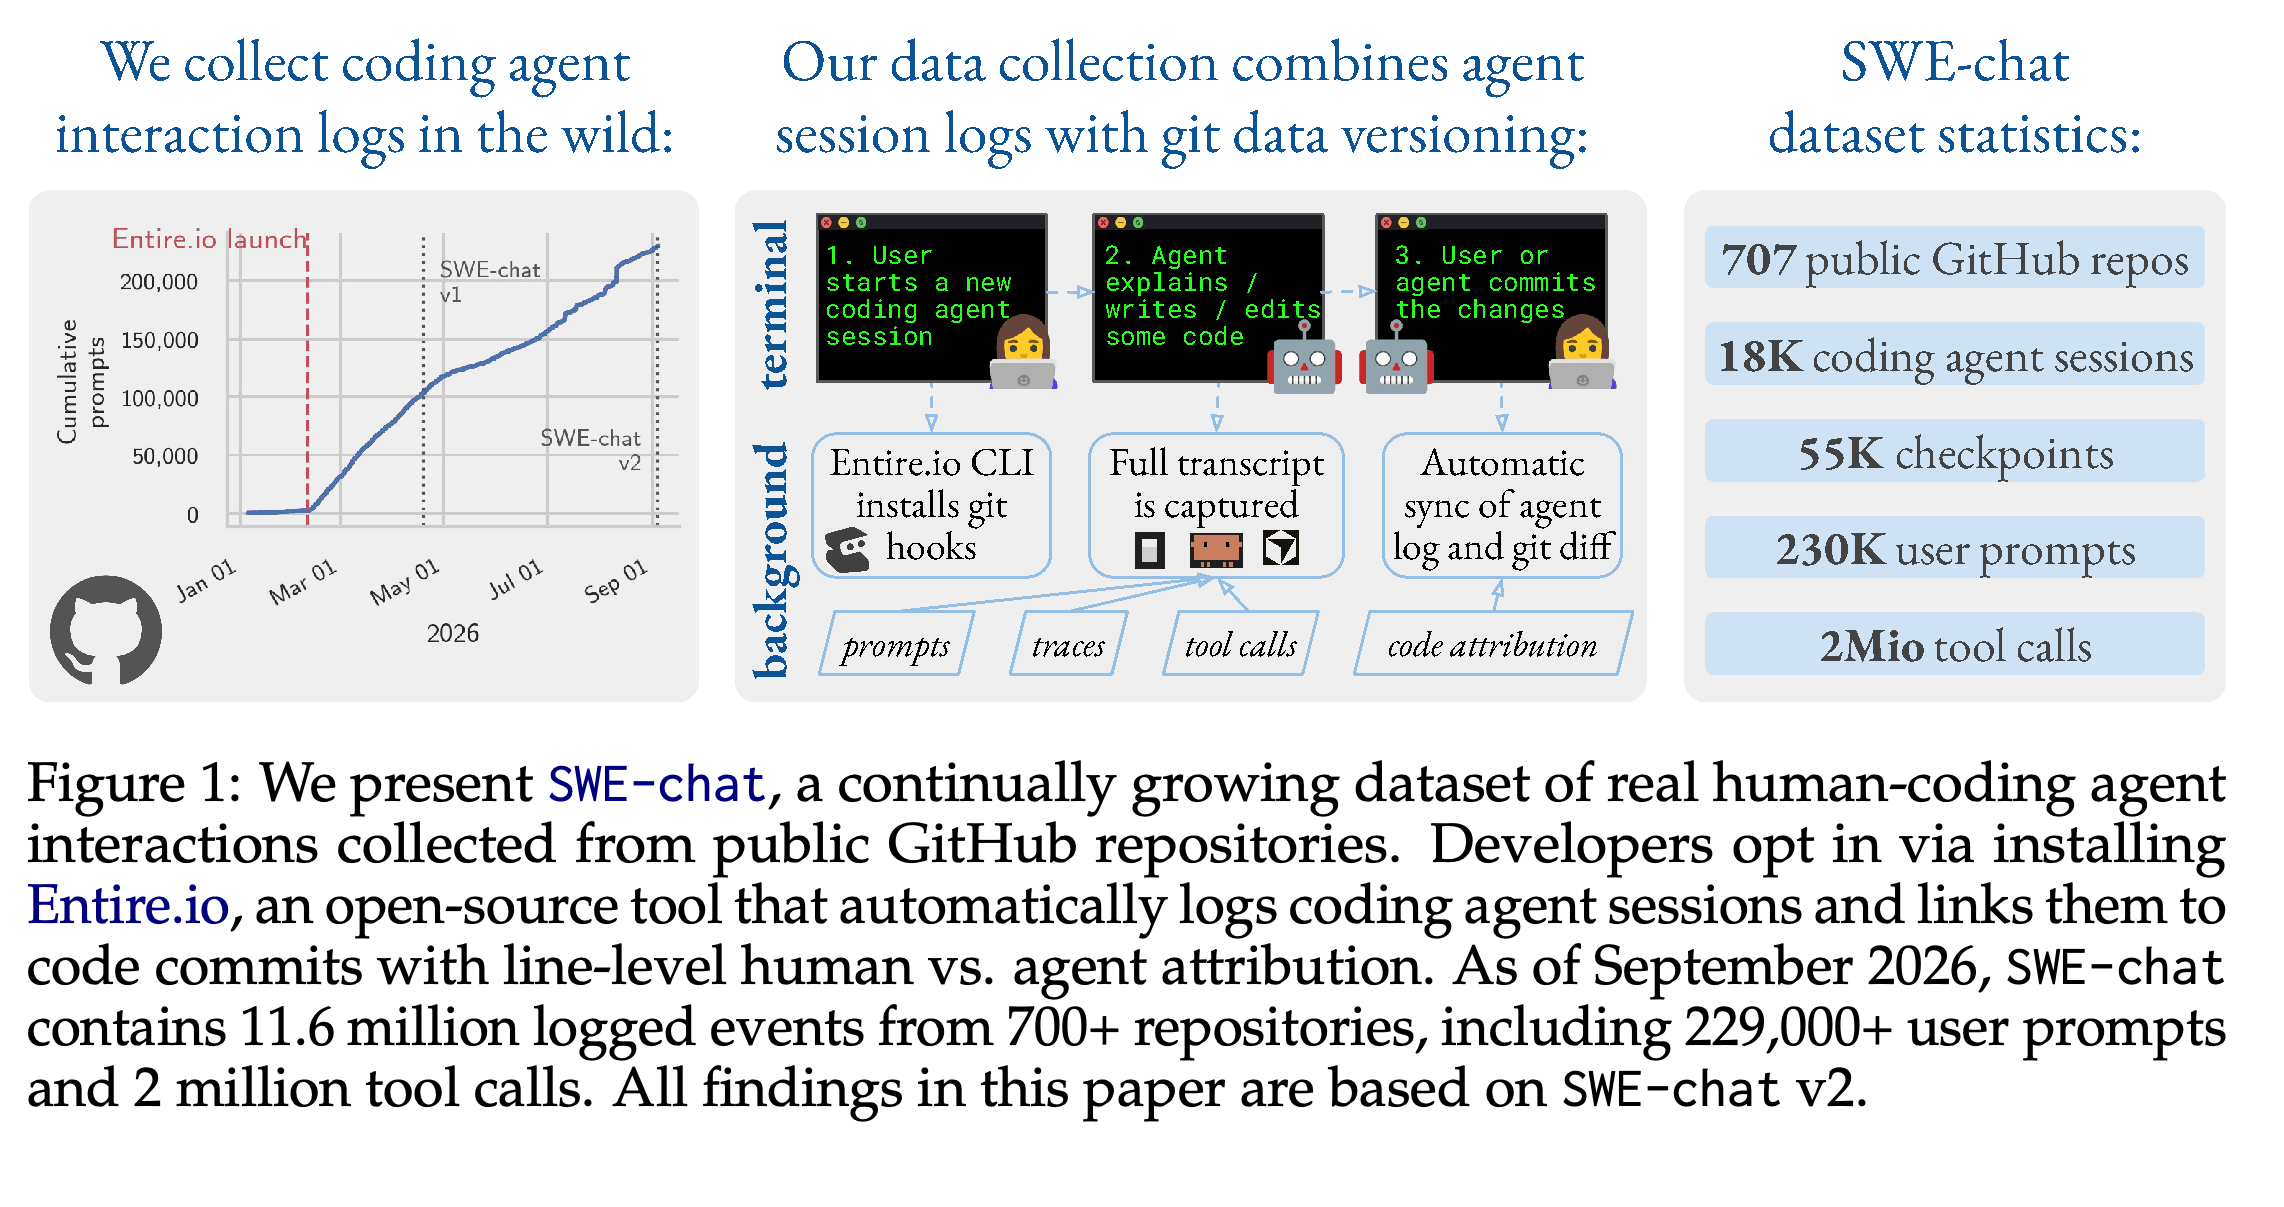
SWE-chat connects interaction traces to committed-code outcomes rather than evaluating only the agent’s final response or patch. Figure 1 illustrates how Entire.io logging synchronizes transcripts and git changes, exposing both the development process and the committed result.
The logging diagram connects prompts, agent actions, and commits through git hooks and transcript capture. The growth curve and September counts show an evolving observational corpus with commit-linked provenance rather than a fixed collection of benchmark tasks.
2.1 Data collection
The collection pipeline discovers public GitHub repositories whose developers enable Entire.io’s CLI checkpoint logging and publish the logs. Checkpoints link transcripts to commits with line-level authorship attribution; transcripts contain prompts, responses, tool calls, token usage, and, where supported, skill invocations and subagent transcripts.
- Supported agents include Claude Code, OpenAI Codex, OpenCode, Gemini CLI, Cursor, GitHub Copilot CLI, Pi, and Factory Droid.
- The release contains more than 54,000 checkpoints and 11.6 million logged events, including progress events, tool results, and extended-thinking traces from more than 6,600 sessions.
- Figure 3 distinguishes sessions, user prompts, and agent turns containing text and tool calls. Public opt-in logging selects an early-adopter population.
2.2 Data statistics
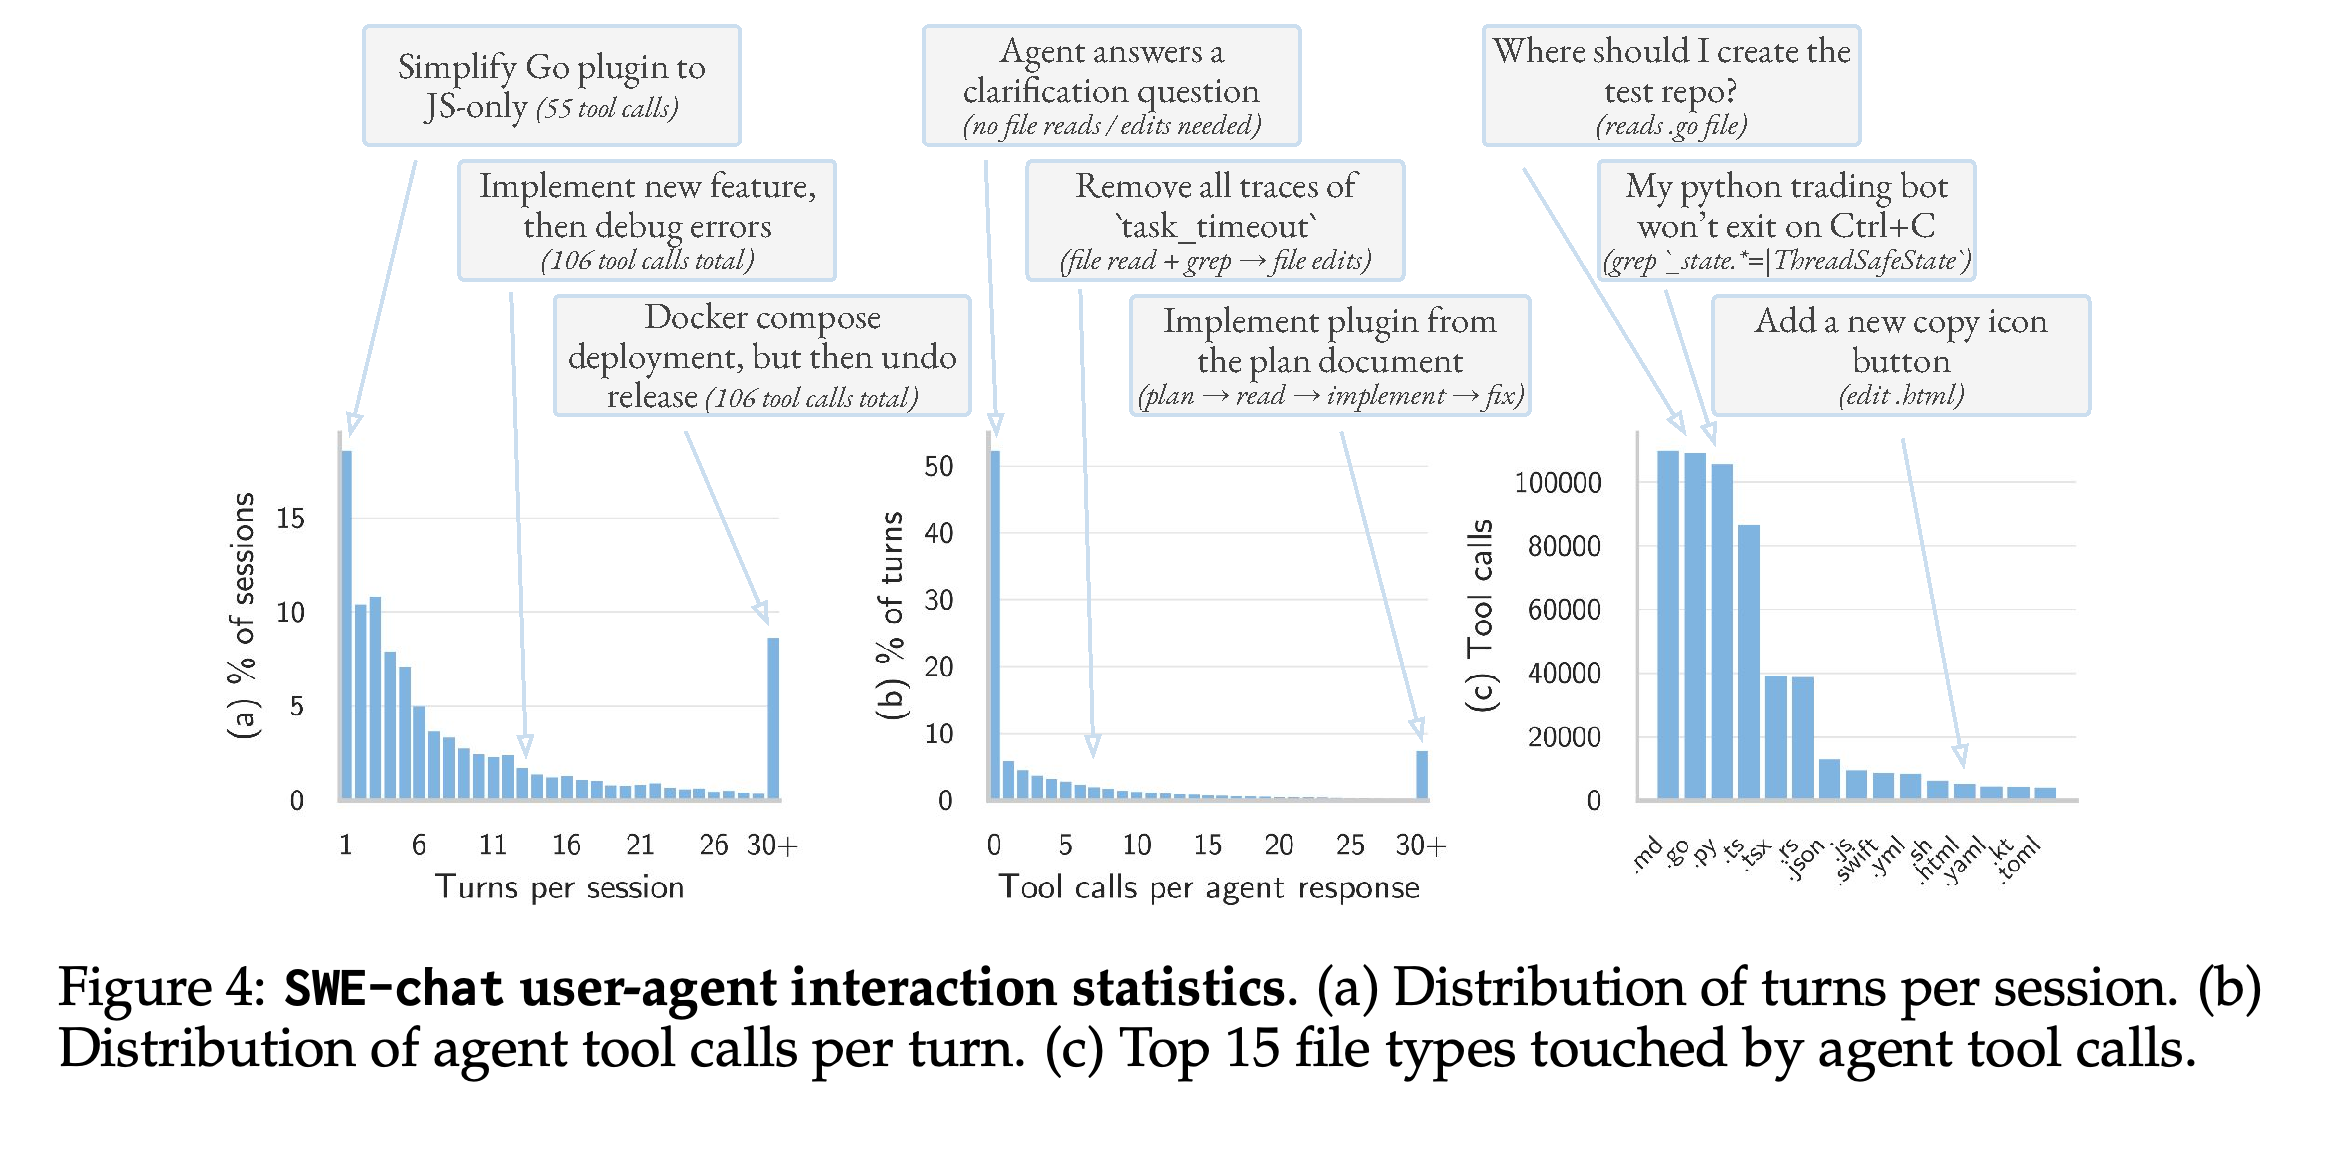
Figure 4 shows heterogeneous session lengths, tool-call counts per turn, and file types touched. The dataset spans hundreds of users and eight widely used agents, plus community integrations; Claude Code accounts for approximately 69% of sessions, partly reflecting its early support in Entire.io.
- The analysis filters data that appears to originate from automated bots.
- Long sessions and tool-heavy turns coexist with short advisory exchanges requiring no file operations.
- The file-type distribution spans documentation and multiple programming languages.
Many exchanges are short or involve no tool calls, while substantial tails include long sessions and tool-heavy turns. The file-type panel spans documentation and several programming languages, demonstrating that the logs cover more than a single patch-writing workflow.
2.3 Data analysis methodology
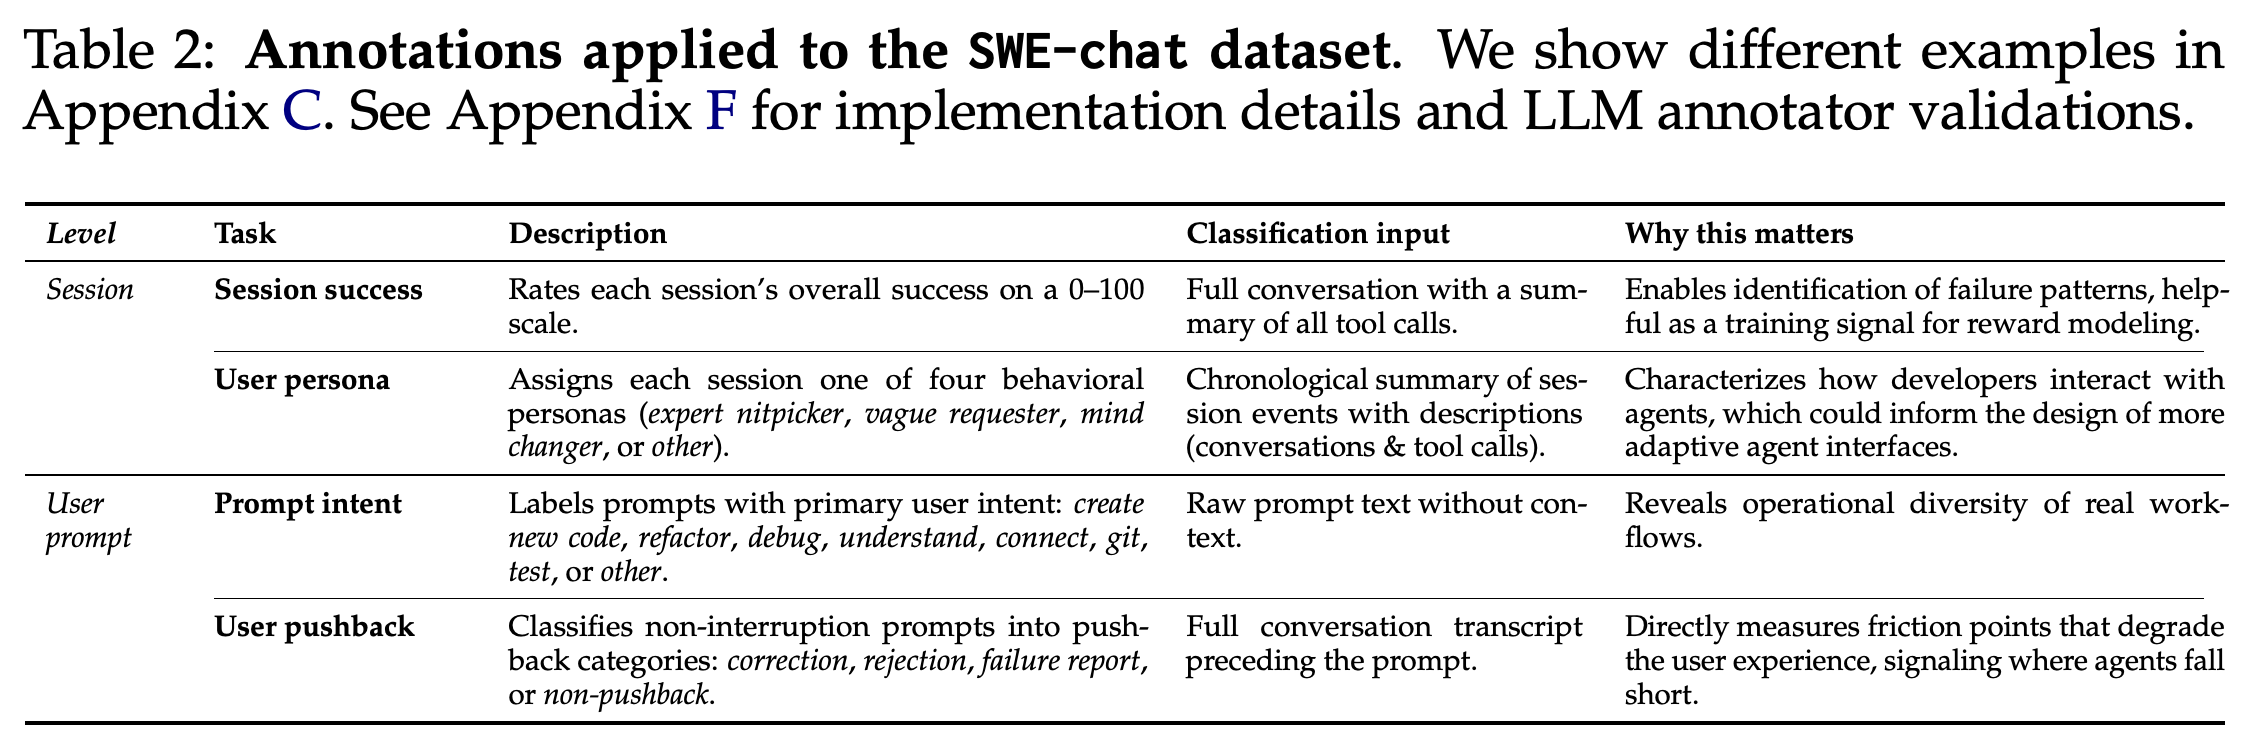
The authors combine LLM-generated behavioral annotations with metrics computed directly from logs and code attribution. Table 2 separates session-level success and persona labels from prompt-level intent and pushback labels, each using a different evidence window.
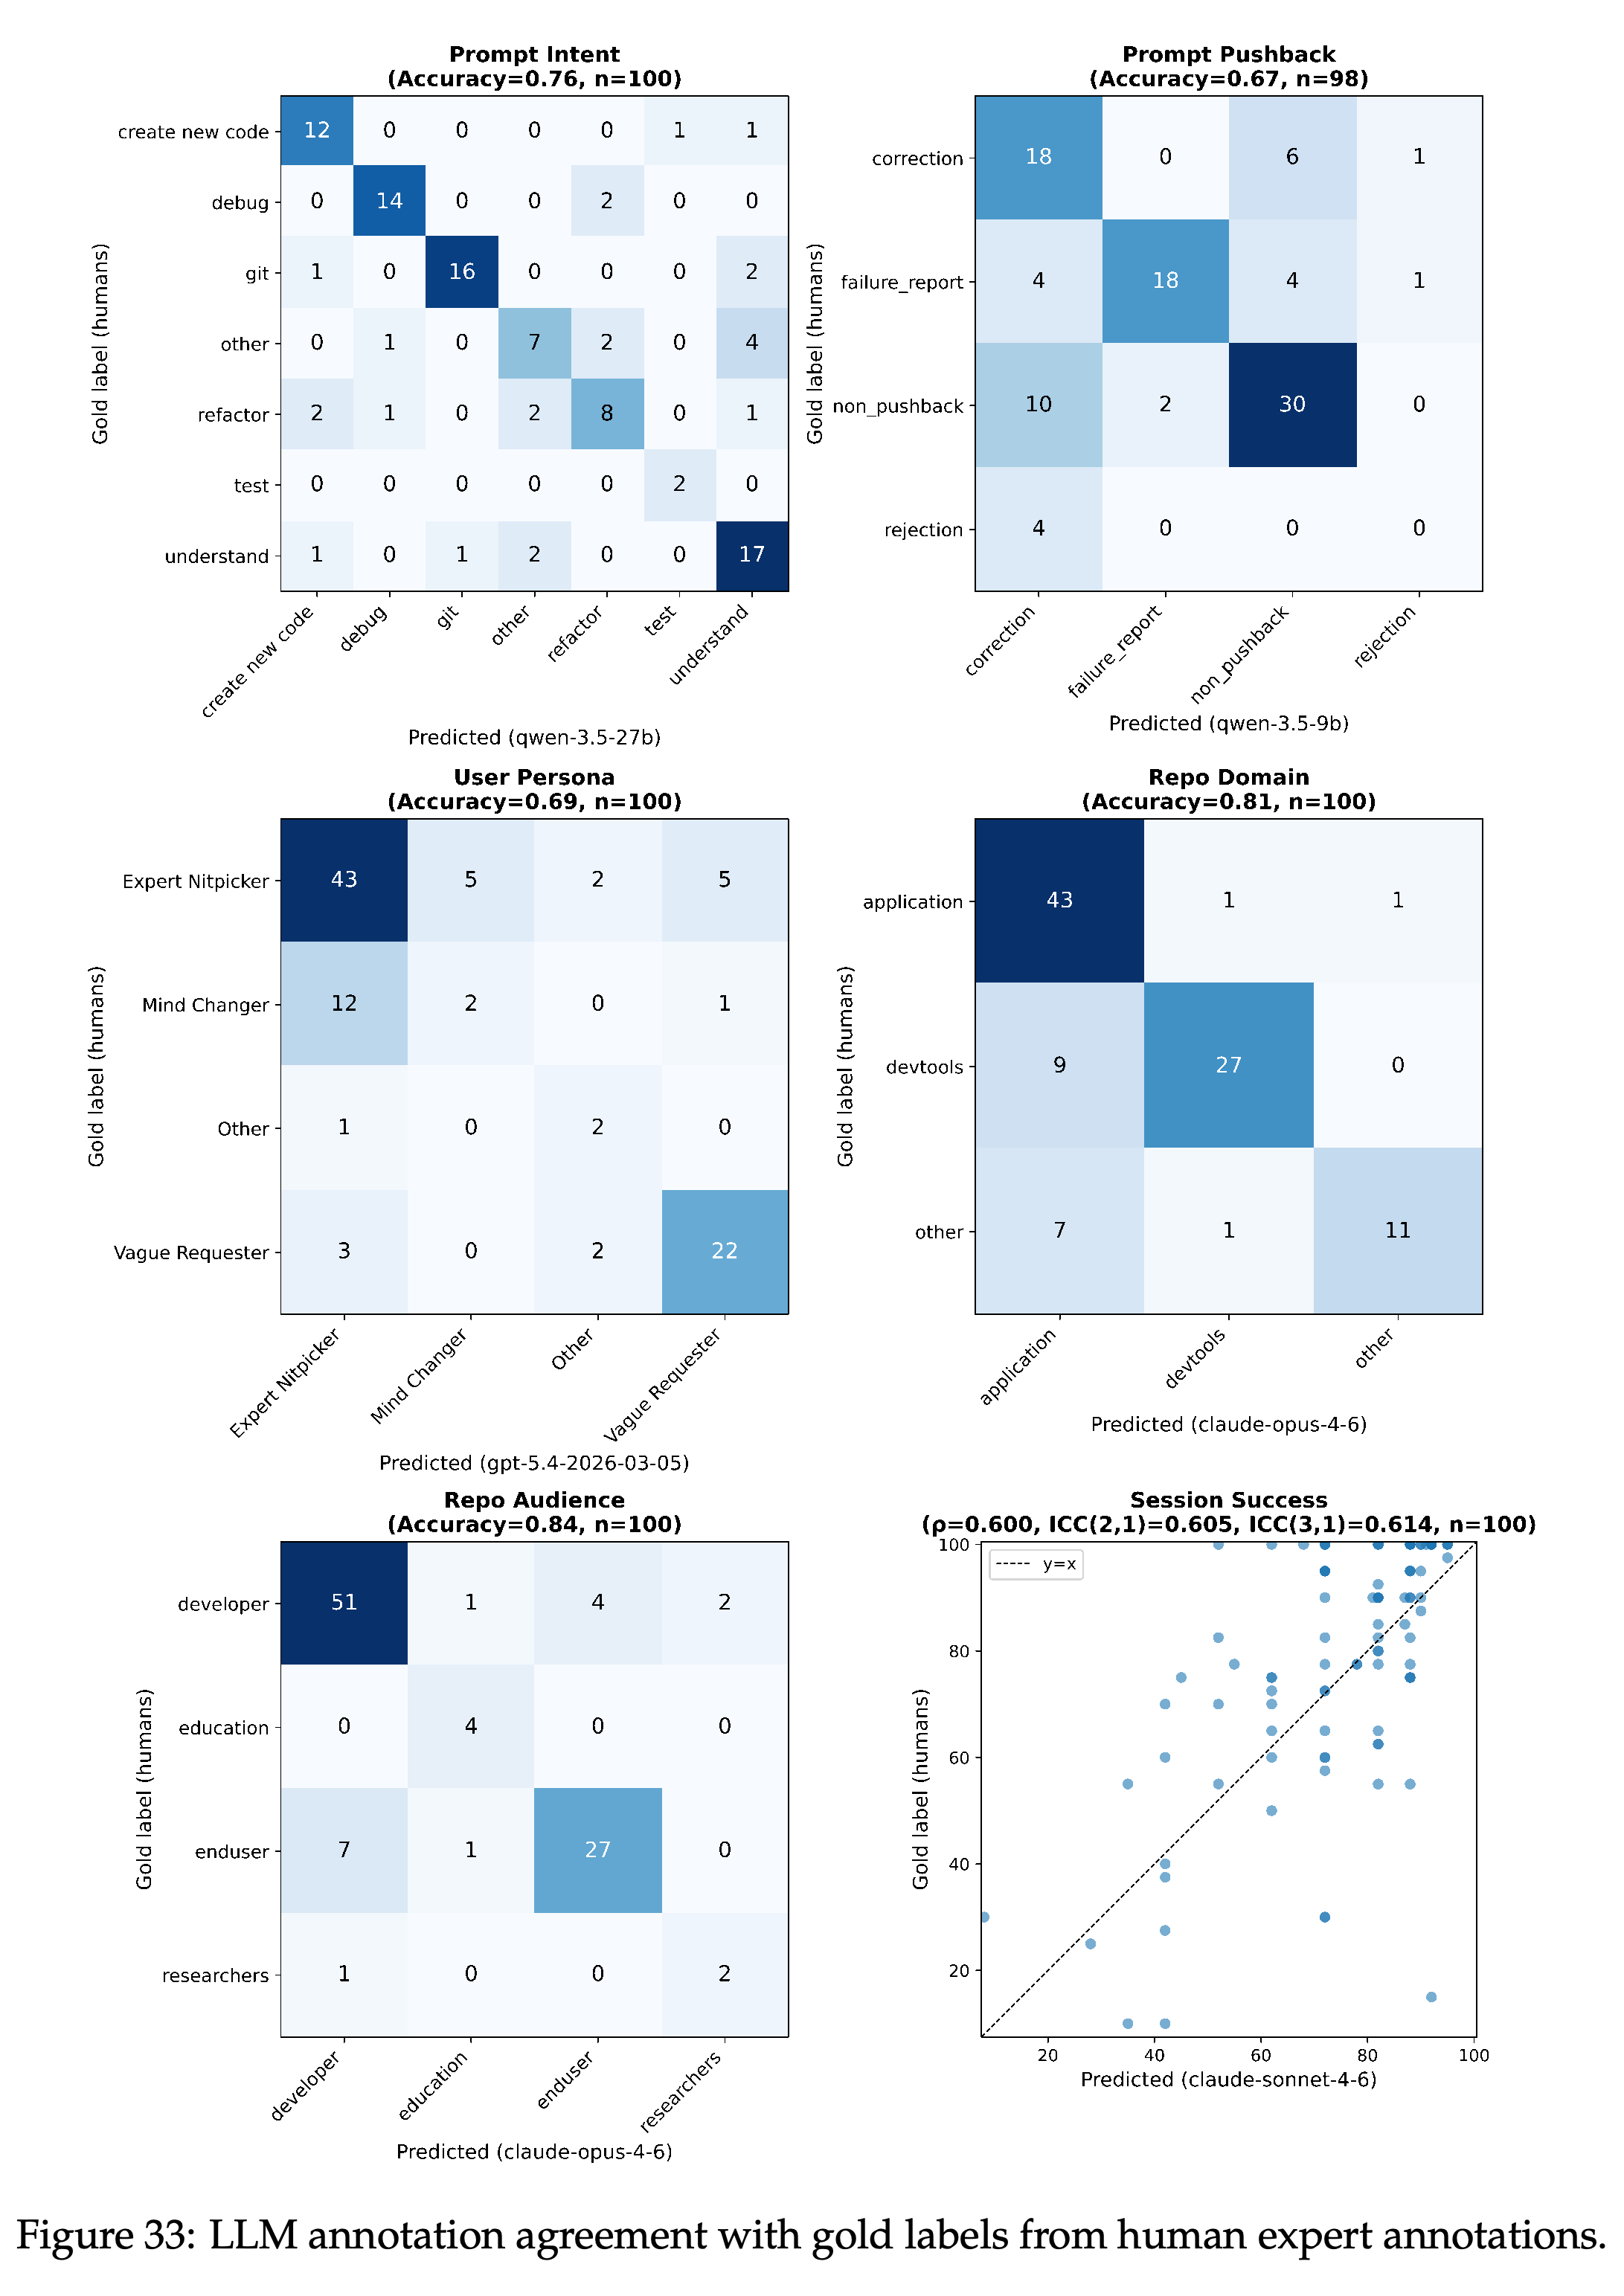
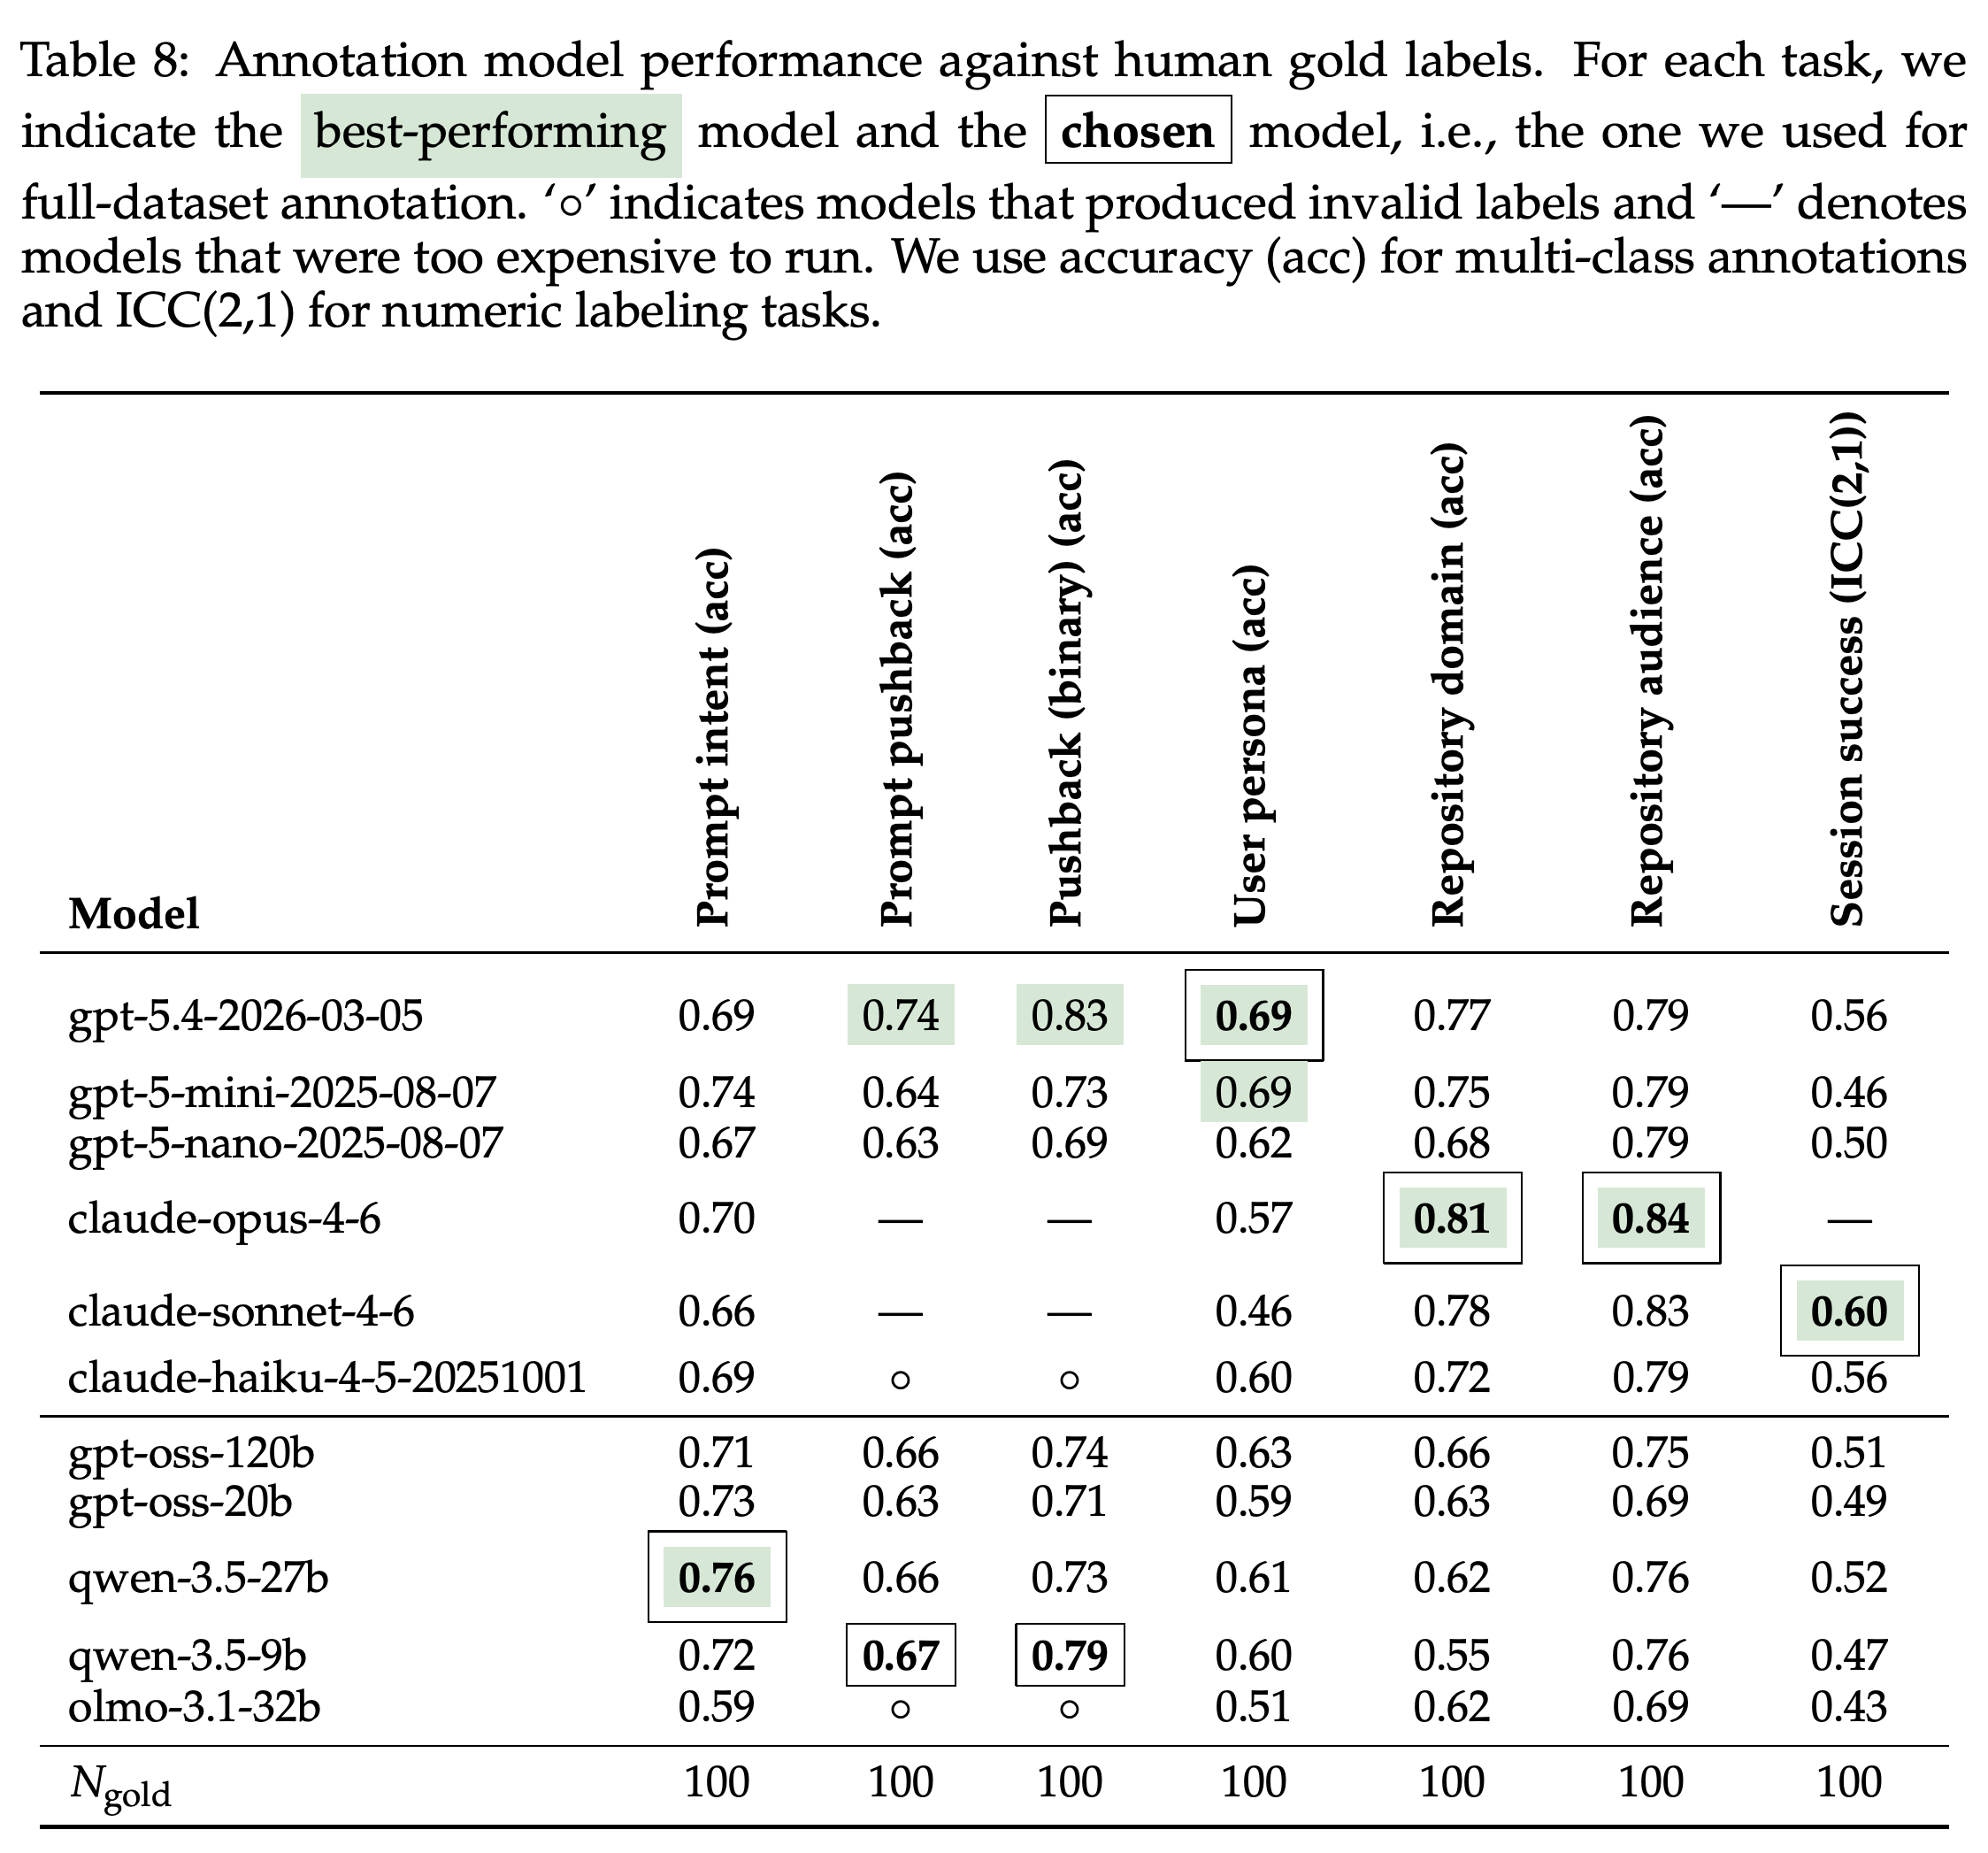
- Candidate models and prompt paraphrases are evaluated against expert gold labels from 100 examples per task. Figure 33 and Table 8 show residual errors, particularly for pushback and persona classification.
- The selected models are Qwen/Qwen3.5-27B for intent, Qwen/Qwen3.5-9B for pushback, gpt-5.4-2026-03-05 for persona, claude-opus-4-6 for repository type, and claude-sonnet-4-6 for session success.
- Efficiency metrics reconstruct generated and retained lines. Security analysis compares Semgrep findings before and after commits in modified files; neither measurement requires behavioral LLM labels.
Intent uses isolated prompt text, pushback uses preceding conversation, and persona and success use session-level evidence. These differing evidence windows and rubrics mean the labels cannot be treated as interchangeable measures of failure.
The confusion matrices reveal errors concealed by aggregate accuracy, including Mind Changer sessions labeled Expert Nitpicker and rejection prompts labeled correction. The success-rating comparison has ICC(2,1) = 0.605, indicating imperfect absolute agreement with expert gold scores.
The model comparison documents differing annotation accuracy and cost trade-offs. Qwen3.5-9B is selected for pushback despite lower accuracy than gpt-5.4-2026-03-05; selected models’ uneven agreement limits the precision of downstream behavioral estimates.
3 How do humans interact with coding agents in the wild? (RQ1)
RQ1 examines what users request, how much committed code agents author, and how users steer sessions. The analysis covers iterative development activities rather than only autonomous, one-shot code generation.
3.1 Task types: agents assist with a broad range of tasks beyond writing code
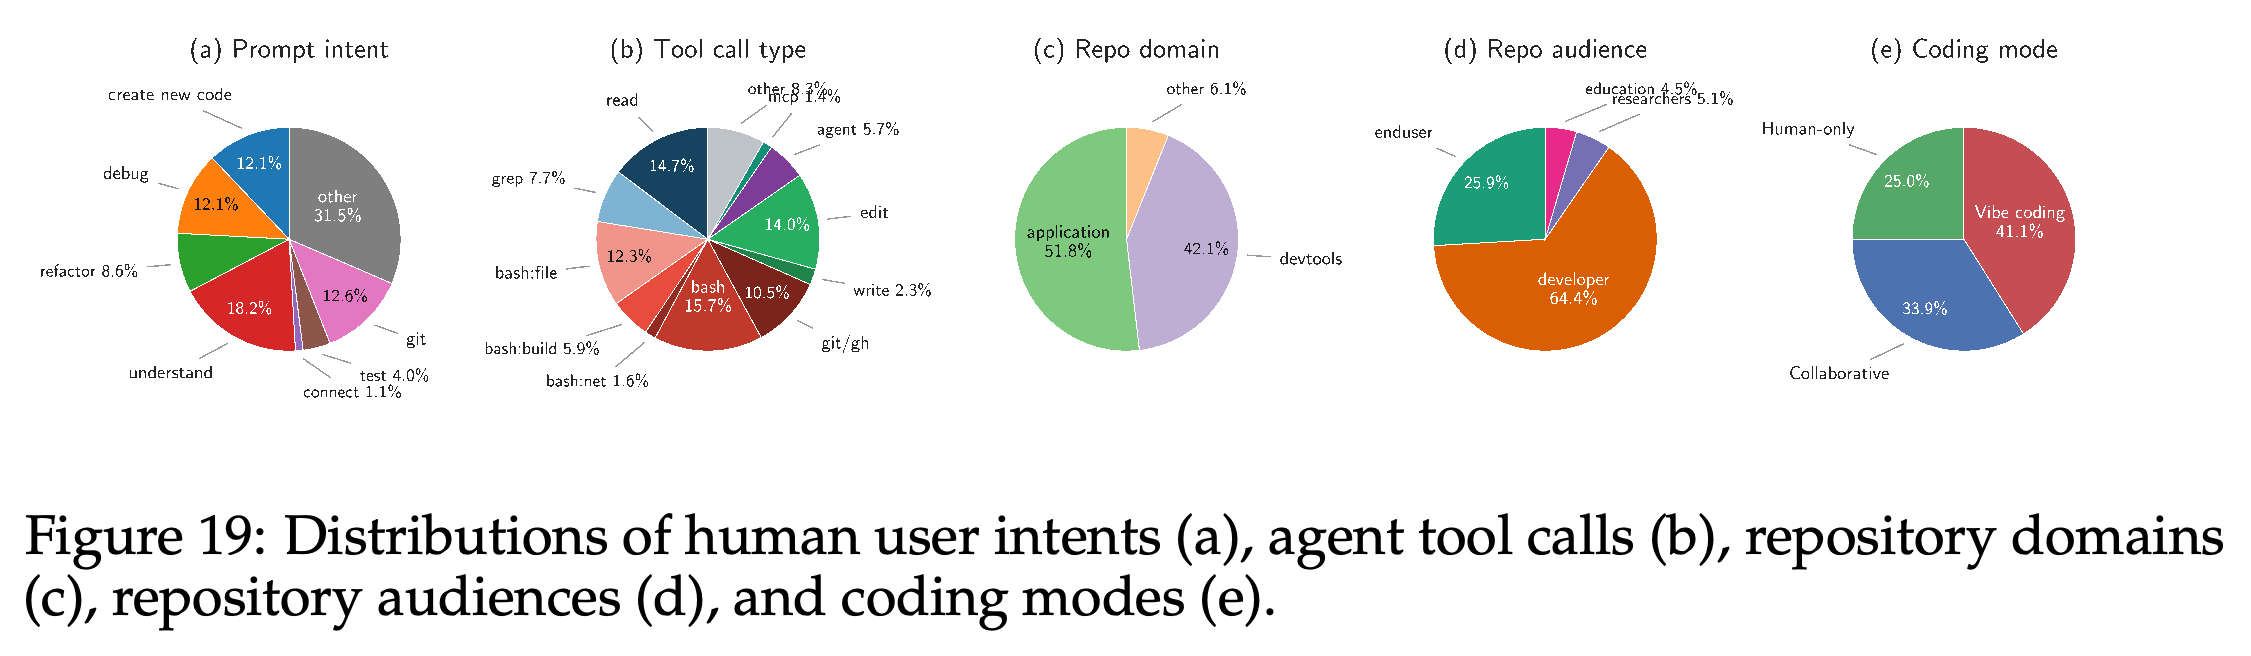
Understanding code accounts for 18.2% of prompts, followed by git operations at 12.6%, creating new code at 12.1%, and debugging at 12.1%; 31.5% falls into “other.” Figure 19 provides the full intent and tool distributions, documenting workflows beyond feature implementation and bug-fix patches.
- Refactoring accounts for 8.6%, testing for 4.0%, and connecting systems for 1.1% of prompts.
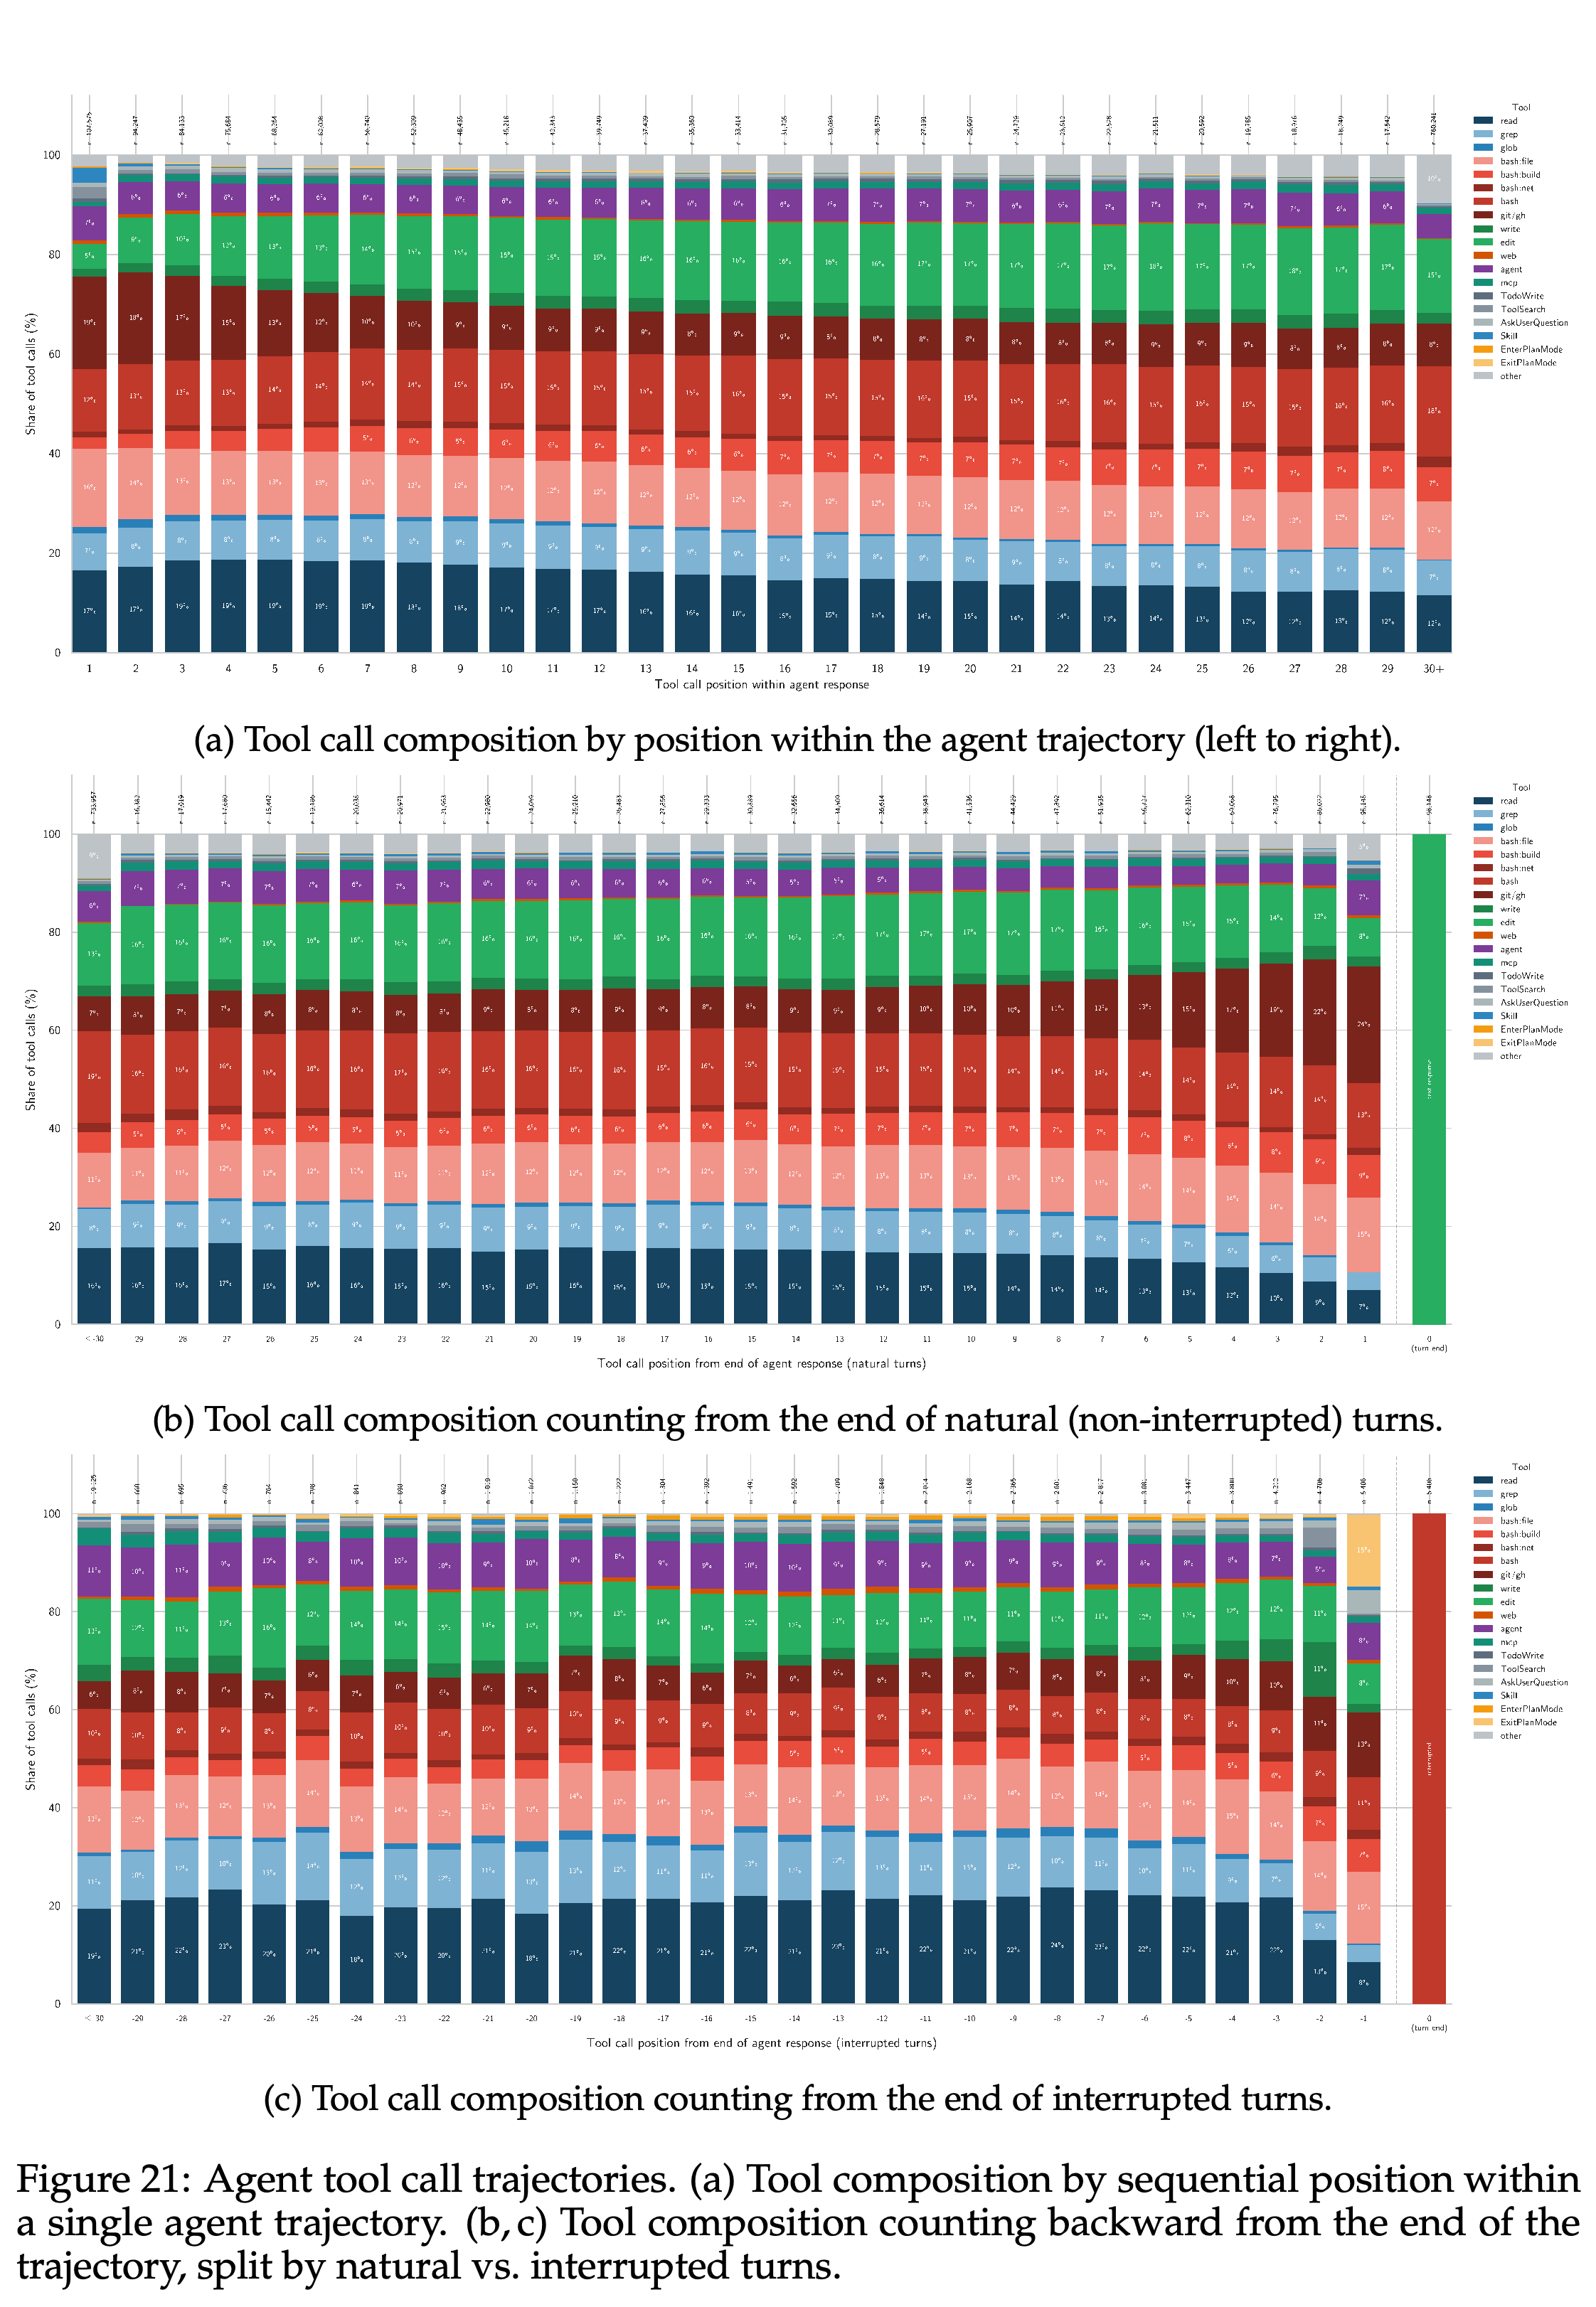
- More than 45% of tool calls are shell commands when the shell categories are combined. Figure 21 shows an early emphasis on reading and searching, followed by editing and build operations.
- In Claude Code sessions, 48% invoke at least one subagent and 28% invoke a skill.
Code understanding is the largest specific request category, and shell, read, edit, and search operations occupy substantial shares of tool use. The repository panels place these interactions mainly in application and developer-tool settings, while the final panel repeats the authorship-mode split.
Forward trajectories shift from reading and searching toward editing and building. Reverse trajectories distinguish natural completion from interruption: ExitPlanMode is disproportionately frequent immediately before interrupted endings, identifying the planning-to-execution transition as a common intervention point.
3.2 Coding modes: vibe coding is increasingly common
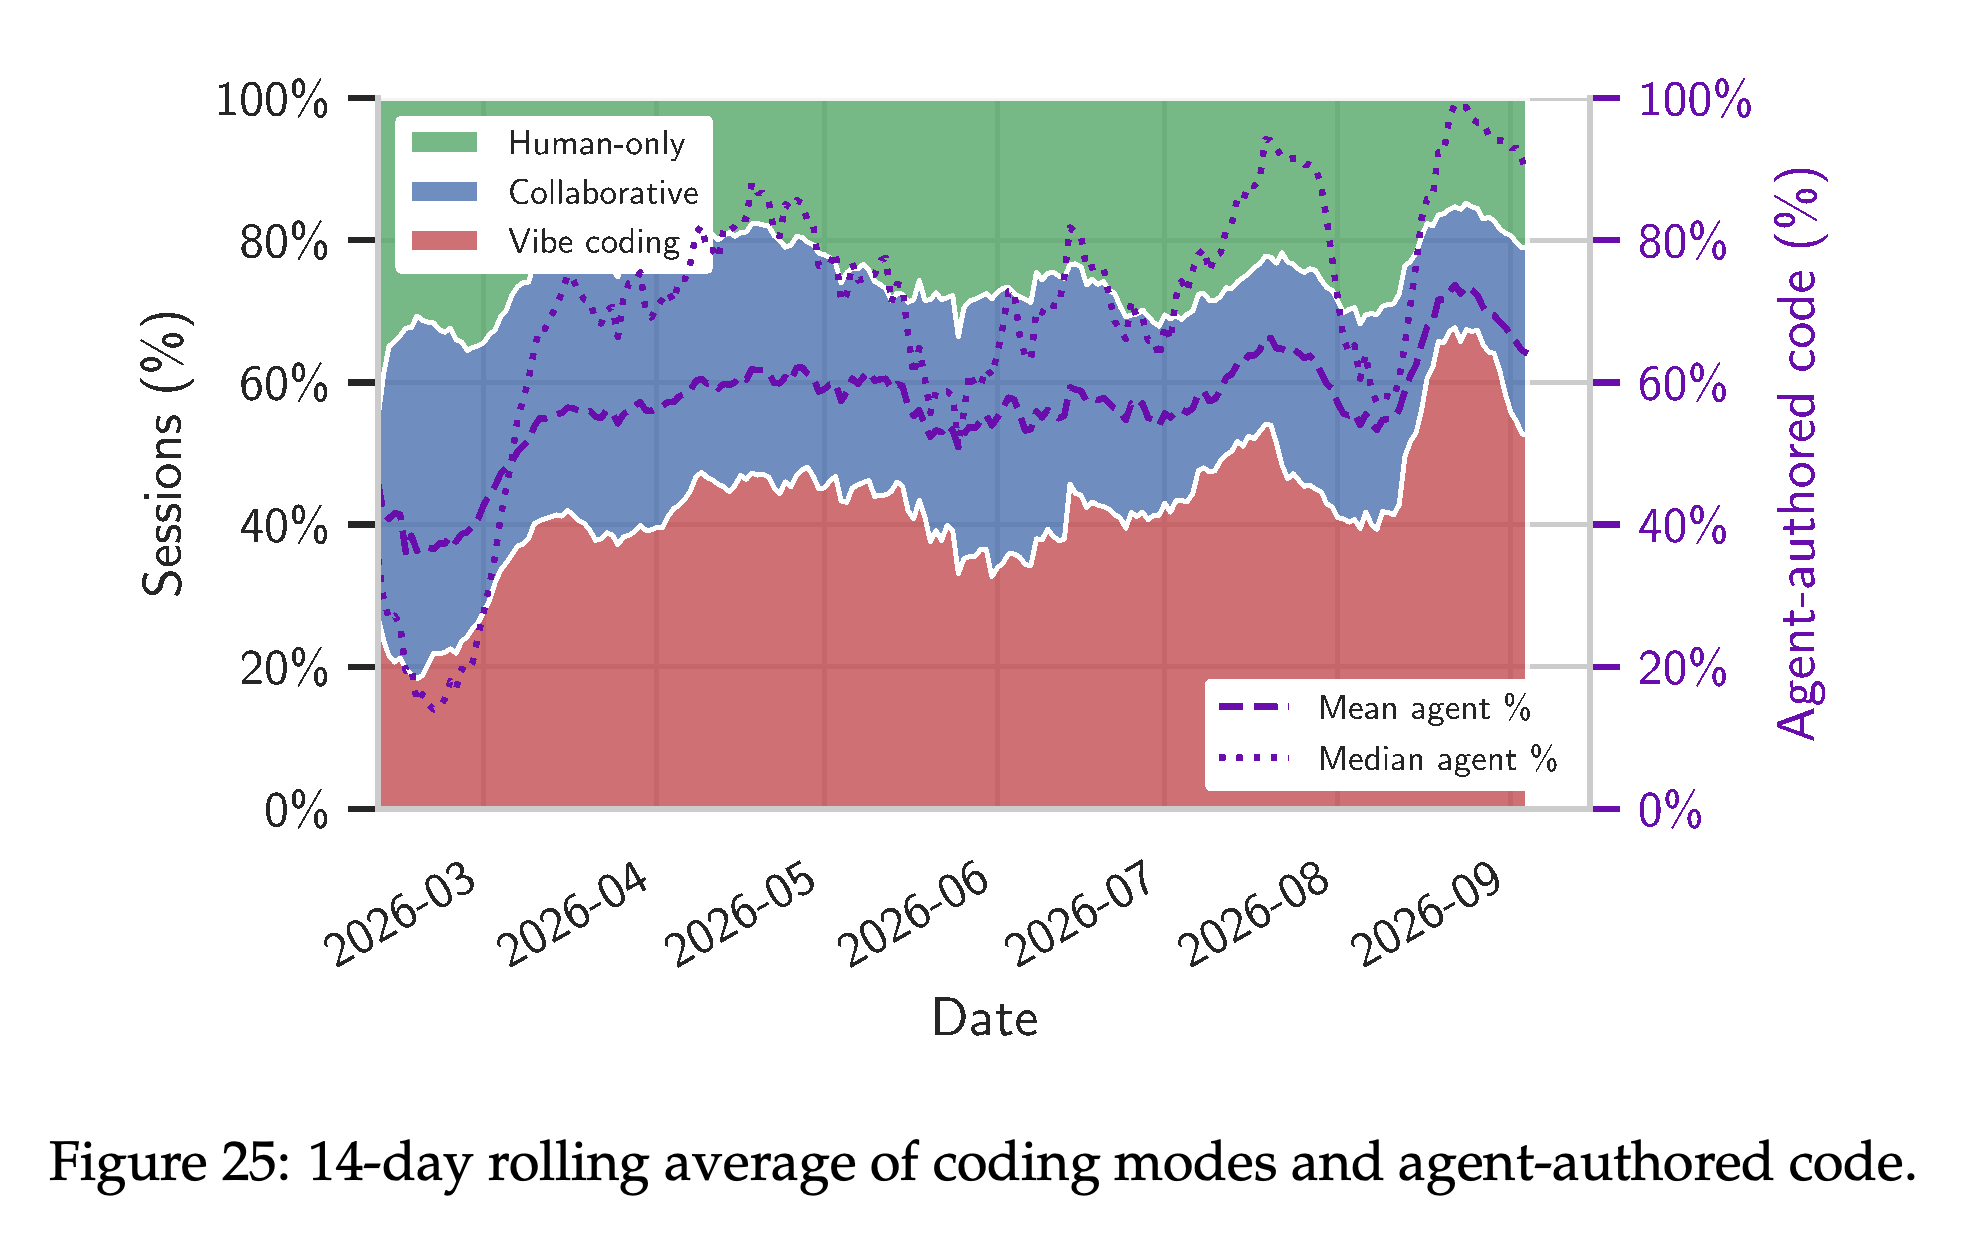
The mean agent-authored percentage is 55.3%, but Figure 5 shows concentrations near 0% and 100%, with a median of 75.6%. Human-only coding accounts for 25.0% of sessions, collaborative coding for 33.9%, and vibe coding for 41.1%.
- Human-only means 0% agent-authored committed lines; collaborative means >0% but <99%. The prose defines vibe coding as >99%, whereas Figure 5 uses ≥99%, leaving an exact-boundary inconsistency.
- Figure 25 shows vibe coding rising from under 20% in February to over 50% in recent months during the eight-month observation window, with substantial intervening fluctuations.
- These modes describe committed-line authorship, not whether humans review code, supply detailed instructions, or intervene during execution.
The 14-day rolling shares show an overall increase in vibe coding from below 20% to above 50%, with substantial fluctuations. Concurrent changes in mean and median agent authorship describe the collected sample, not a controlled within-user adoption effect.
3.3 User types: expert nitpicking behavior dominates
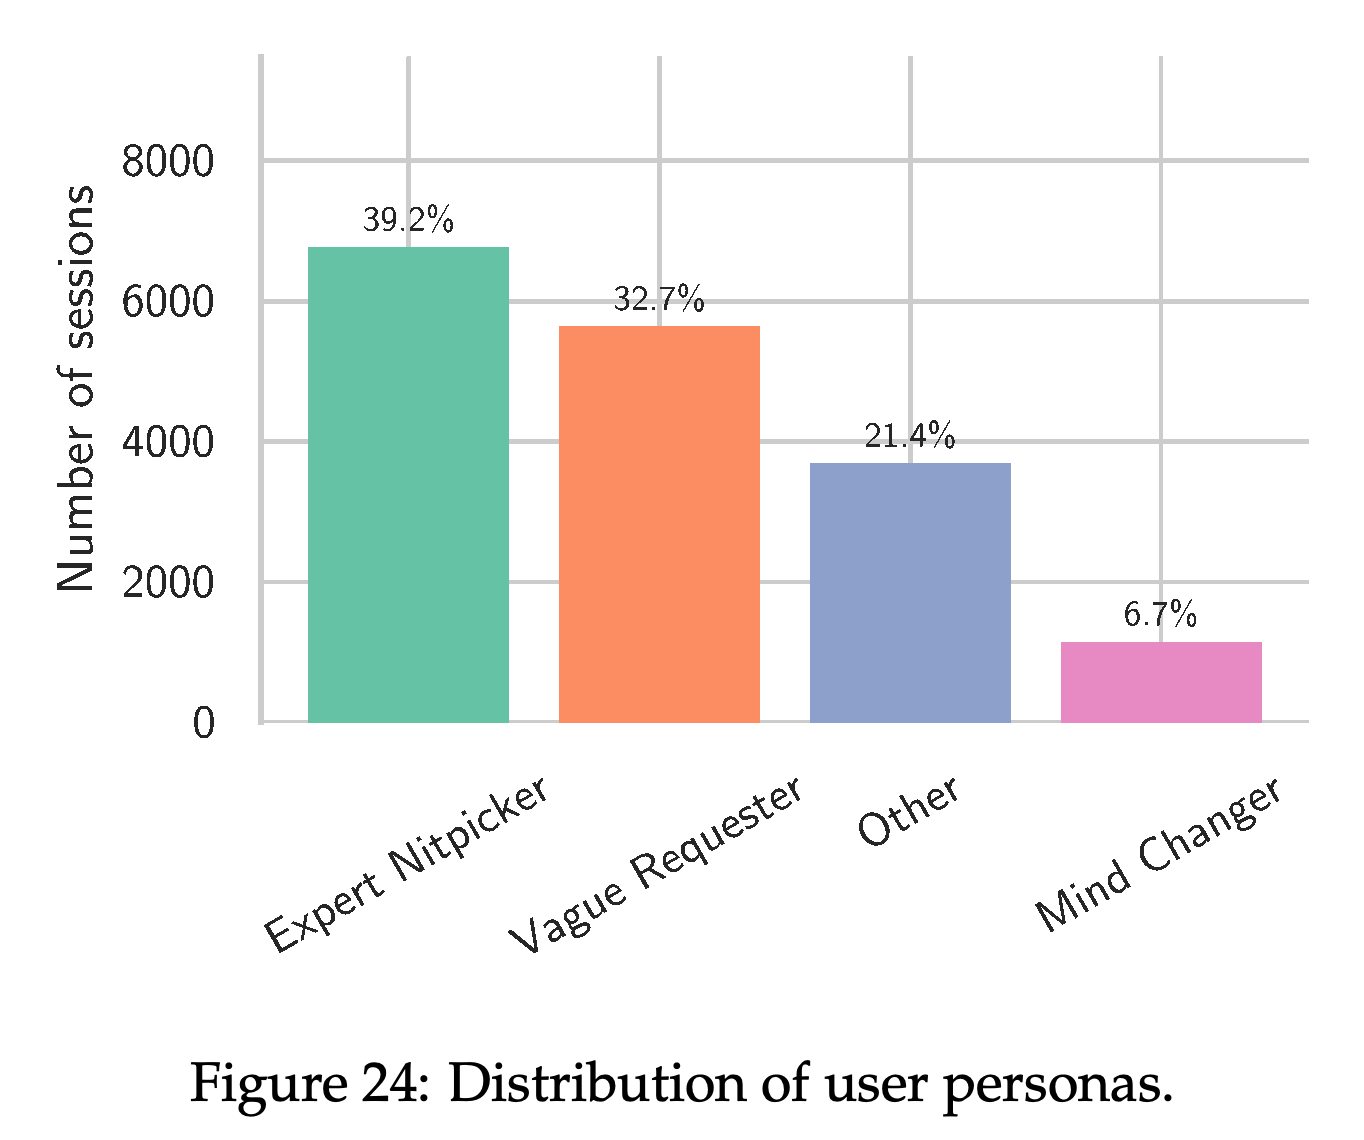
The most common annotated persona is Expert Nitpicker: a user who gives precise corrections while maintaining a stable goal. Figure 24 reports 39.2% Expert Nitpicker, 32.7% Vague Requester, 21.4% Other, and 6.7% Mind Changer.
- Expert Nitpicker remains the largest persona within vibe coding sessions, at 36.7%.
- Mind changing occurs in 4.6% of vibe coding sessions versus 8.0% in other modes.
- The rubric distinguishes refining implementation from changing the goal. Its persona labels are not independently verified measurements of developer expertise.
Expert Nitpicker is the largest annotated group at 39.2%, followed by Vague Requester at 32.7%; Mind Changer accounts for 6.7%. These proportions distinguish precise steering from broad delegation but depend on an imperfect persona classifier.
4 How do coding agents fail and how do users respond? (RQ2)
RQ2 separates session success ratings from efficiency, code safety, and user oversight. A highly rated session can still generate discarded code, consume substantial resources, or require repeated corrections.
4.1 Most coding agent sessions successfully complete user requests
The mean LLM-rated session success is 73.2 on a 0–100 scale, the median is 82.0, and 87.5% of sessions score at least 50. Figure 6 shows the lower-scoring tail; the authors manually inspect the 50 lowest-rated sessions, with scores of 2–15.
- The most common failures in that inspection are interruption before meaningful output and work unrelated to the request. Figure 6 also illustrates blocked execution and unsuccessful delegation.
- The rubric defines 50–69 as meaningful progress with a significant incomplete subtask or known defect. Scoring at least 50 therefore does not establish complete task resolution.
- Ratings are conditional on captured sessions. If unobserved abandoned sessions constitute 10%, 20%, or 30% of all sessions and score zero, the mean becomes 65.9, 58.6, or 51.2, respectively.
4.2 Coding agents are inefficient
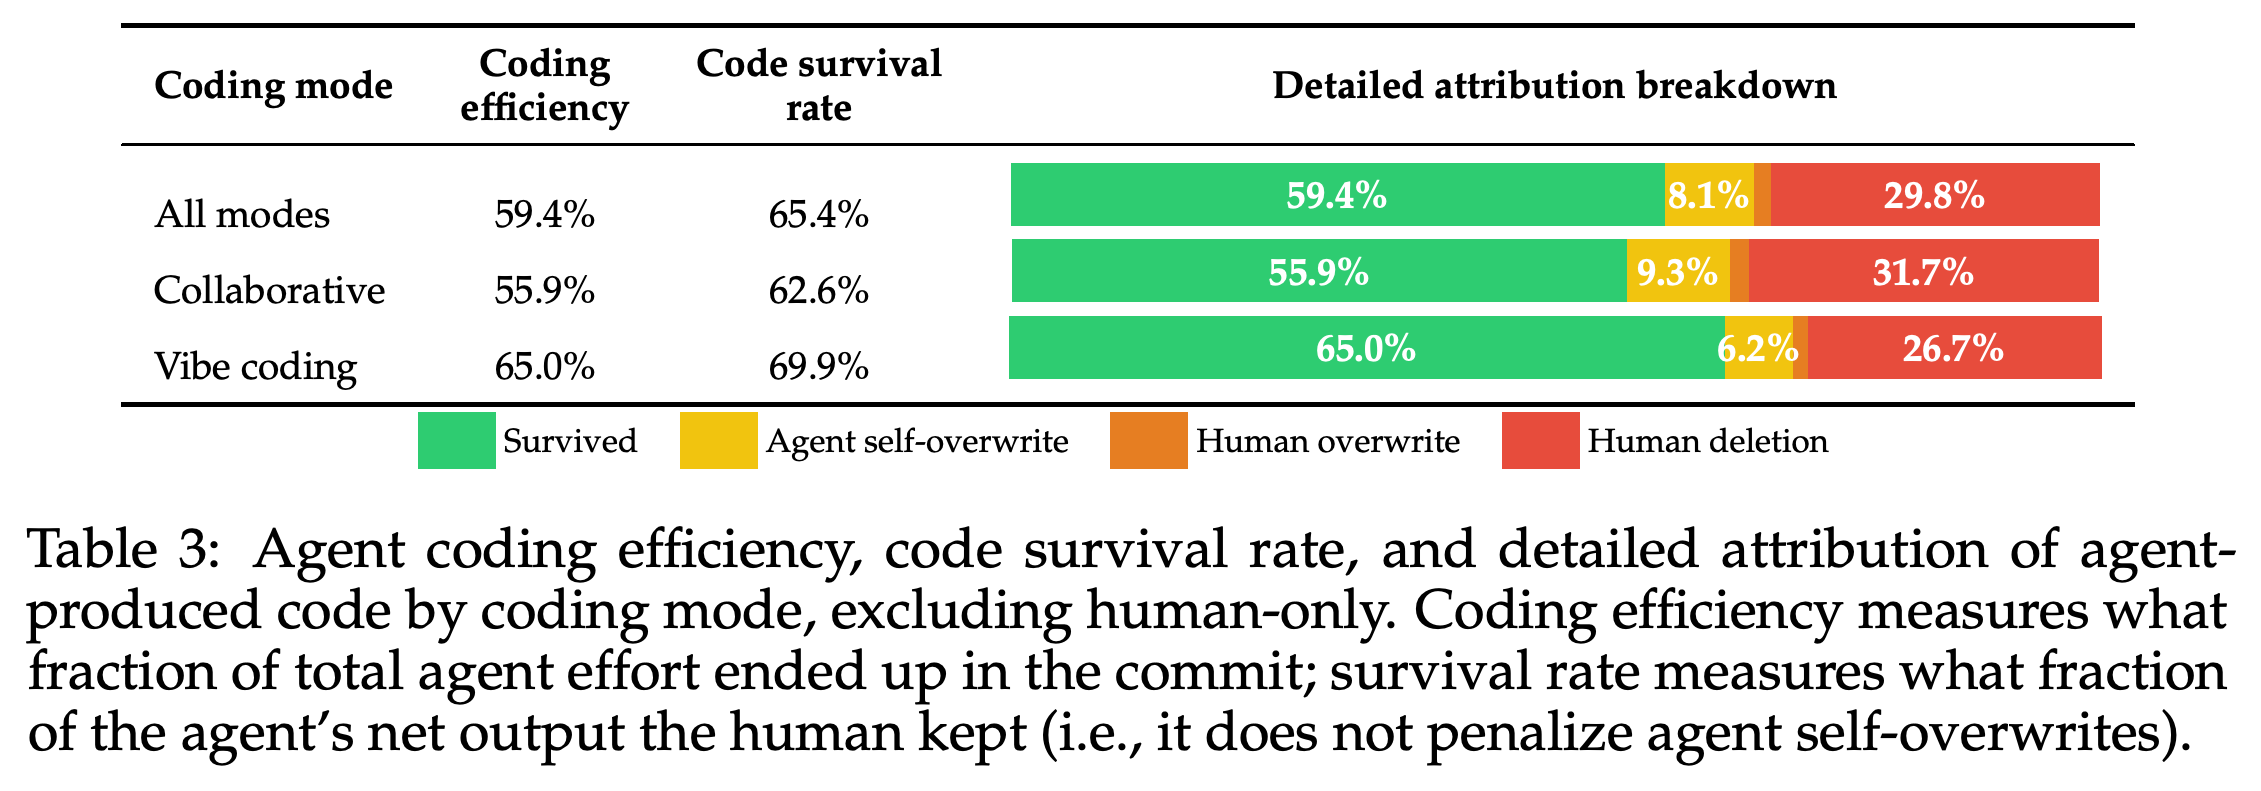
Table 3 distinguishes coding efficiency, whose denominator includes agent self-rewrites, from code survival rate, which measures unchanged retention of final net output. Excluding human-only coding, these values are 59.4% and 65.4%, respectively; human deletion accounts for the largest identified share of lost agent output.
- Collaborative sessions have 55.9% coding efficiency and 62.6% survival; vibe coding sessions have 65.0% efficiency and 69.9% survival.
- Higher retention in vibe coding may reflect better-targeted output or less scrutiny; the data does not distinguish these explanations causally.
- The paper sometimes describes the 59.4% value informally as code that “survives,” but the formal survival-rate metric is 65.4%. Table 3 uses unambiguous session–commit mappings, covering 47.7% of sessions.
The attribution breakdown separates retained lines from agent self-overwrites, human overwrites, and human deletions. Overall coding efficiency is 59.4%, whereas net-output survival is 65.4%, because only the former penalizes agent self-rewrites.
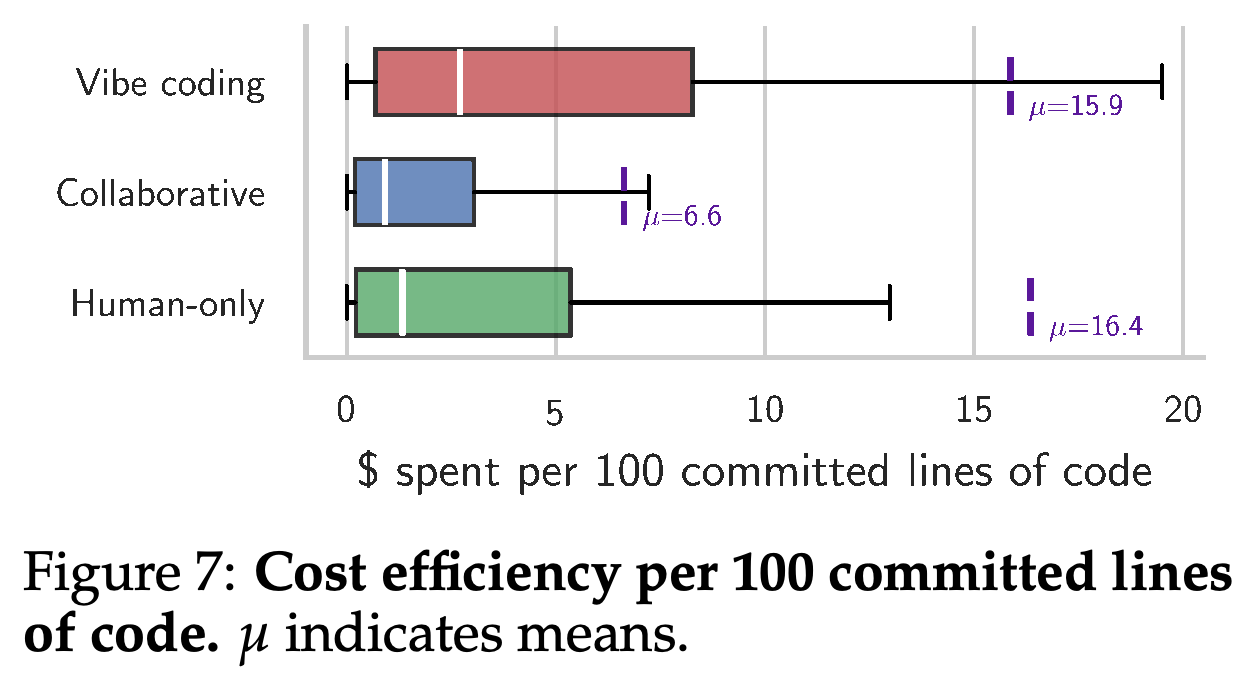
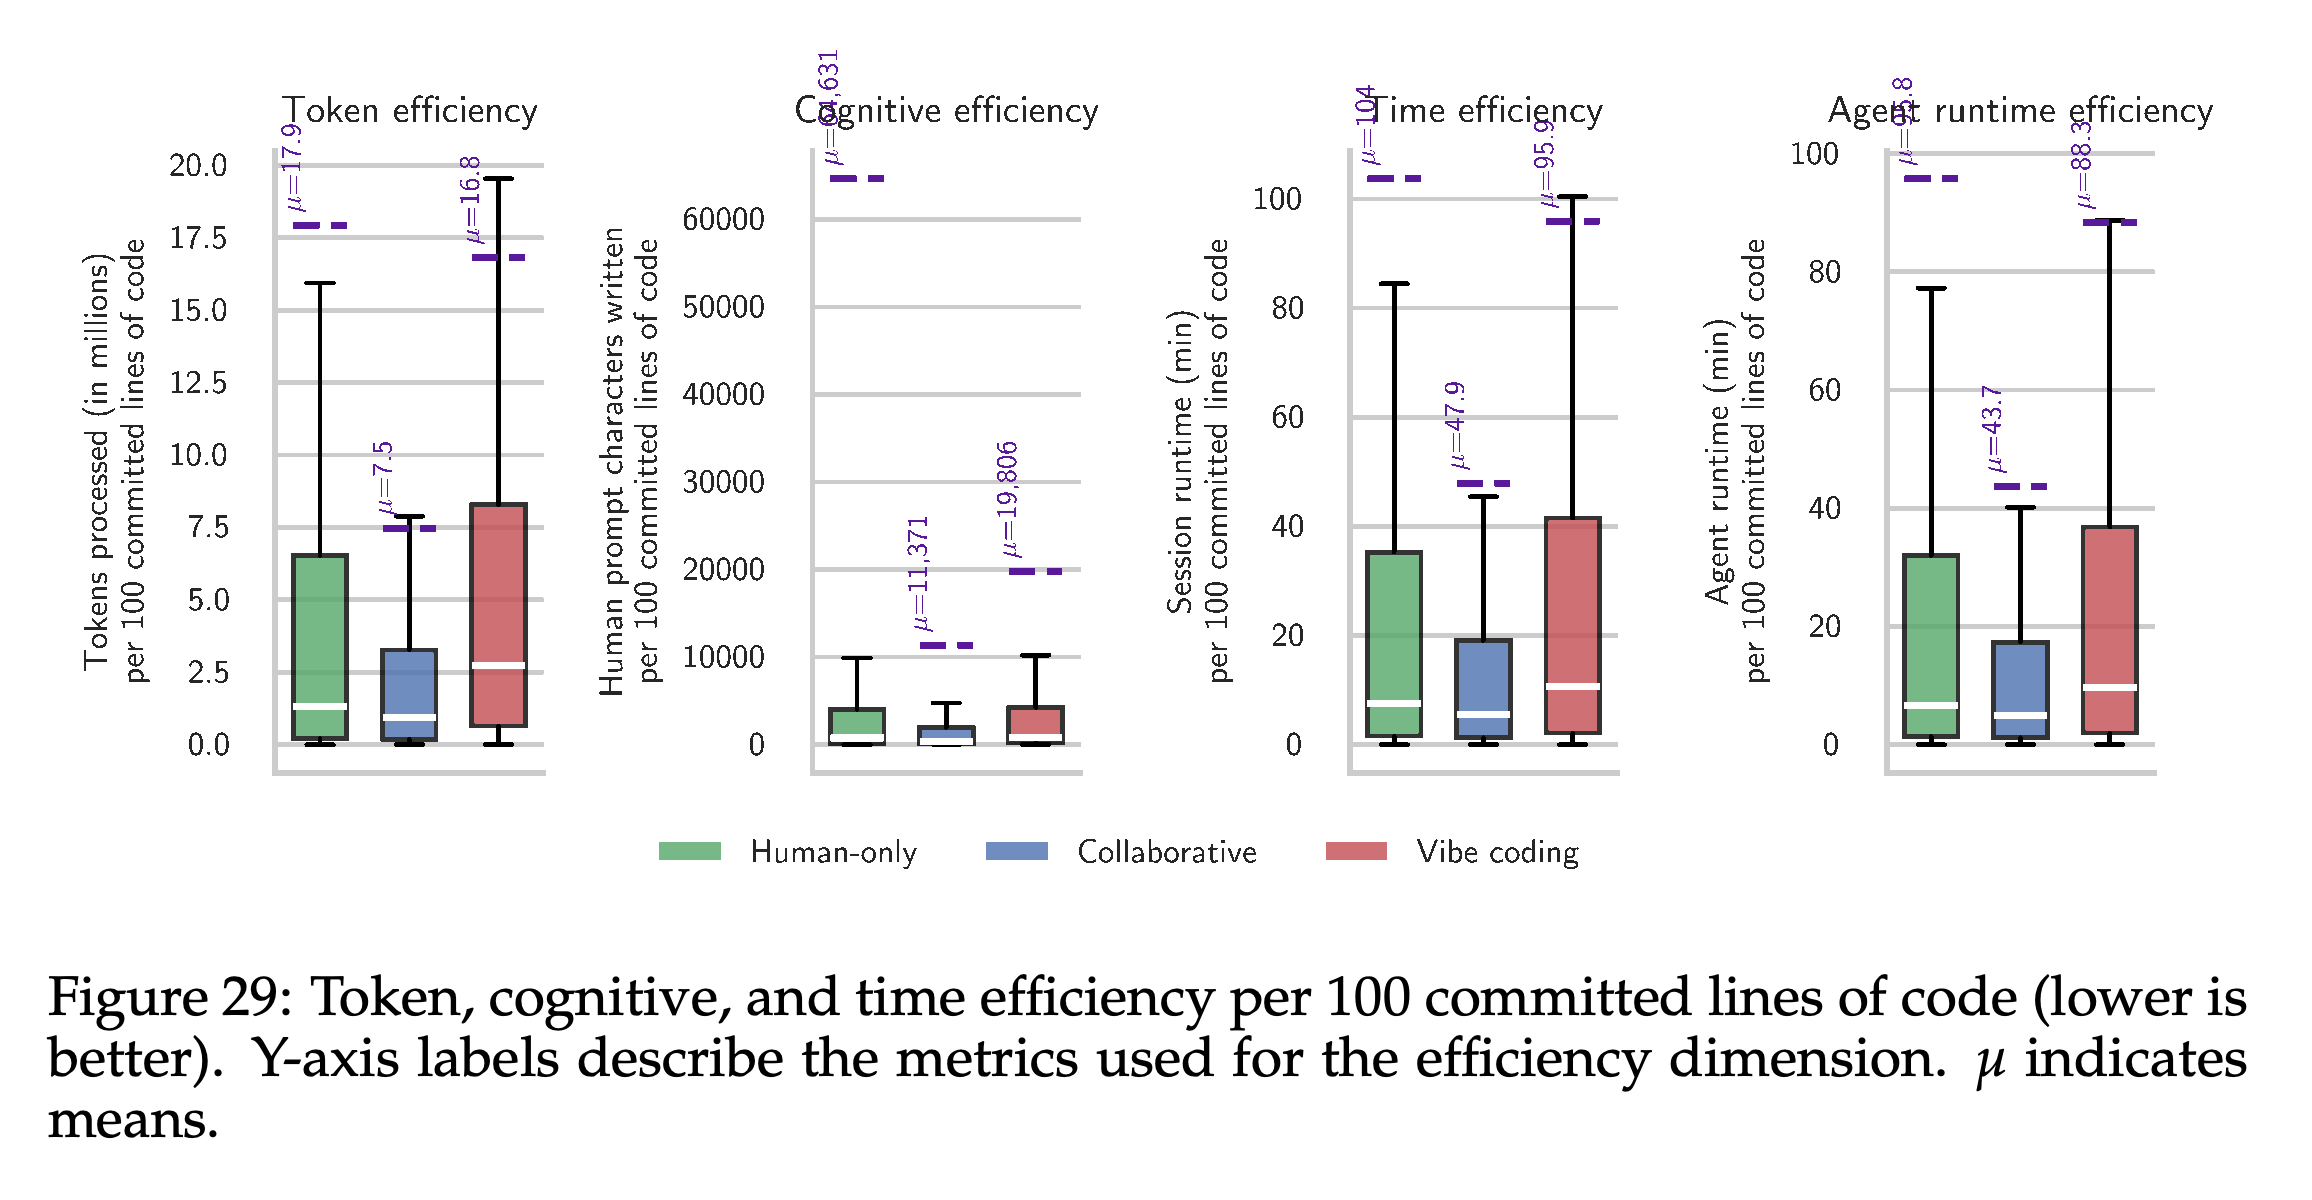
Vibe coding has higher retention but higher median resource costs per committed line. It consumes 2.7M tokens per 100 committed lines, roughly 3× collaborative coding and 2× human-only coding; median dollar costs are $2.71, $0.92, and $1.33, respectively.
- Median session time per 100 committed lines is 5.5 minutes for collaborative coding, 10.7 minutes for vibe coding, and 7.6 minutes for human-only coding.
- Figure 7 shows skewed dollar-cost distributions; Figure 29 compares tokens, prompt characters, session runtime, and agent runtime.
- Prompt characters omit reading and review effort. Session timing excludes idle periods longer than 2 minutes and work before or after the session, so these metrics are resource-per-line proxies rather than complete productivity estimates.
Collaborative coding has the lowest median dollar cost per 100 committed lines. The marked means substantially exceed medians across modes, showing that costly outliers affect mean comparisons and that a single summary cost does not describe every session.
Collaborative coding has lower observed per-line resource costs across tokens, prompt characters, session time, and agent runtime. Marked means reveal heavy tails; prompt characters omit review effort, and runtime omits work outside logged sessions.
4.3 Vibe coding introduces more security vulnerabilities per line
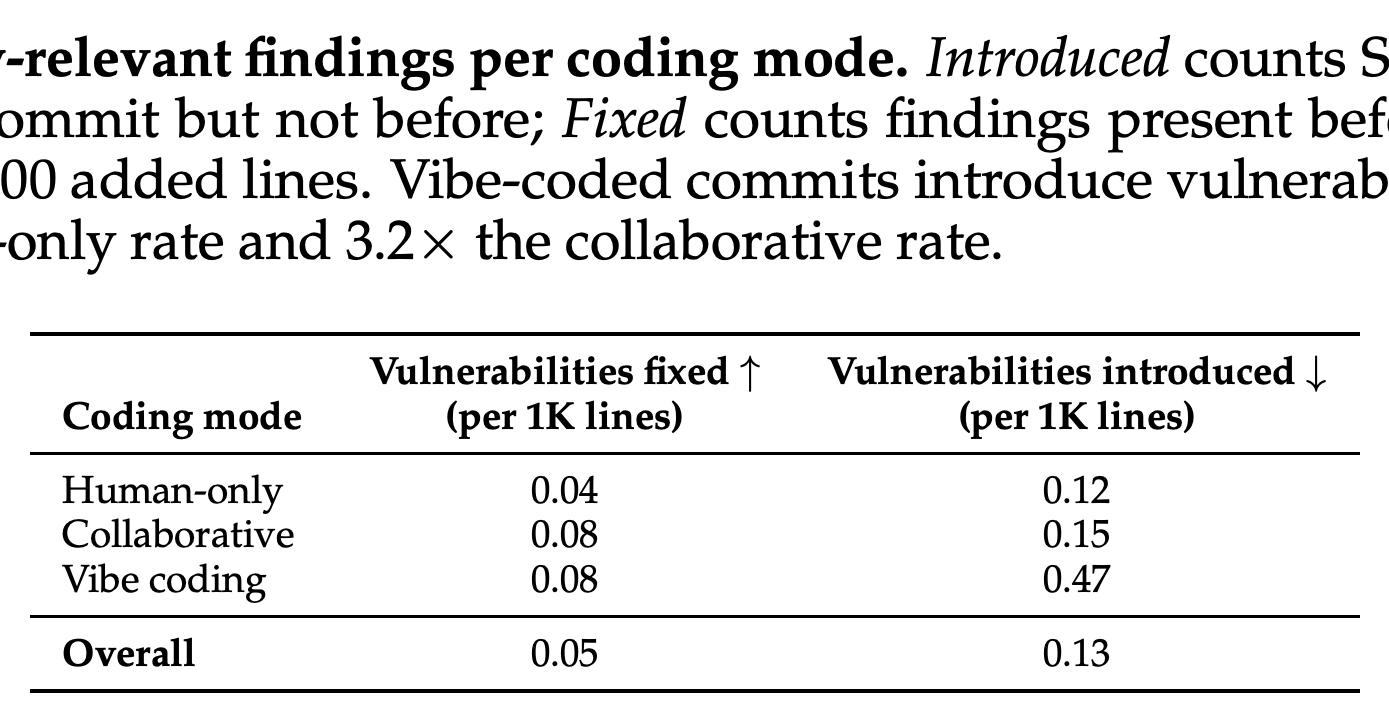
The authors scan pre- and post-commit snapshots with Semgrep and count newly appearing findings in modified files. Table 4 reports 0.12 introduced findings per 1,000 added lines for human-only coding, 0.15 for collaborative coding, and 0.47 for vibe coding—the paper’s roughly 3.8× and 3.2× comparisons.
- Fixed-finding rates are 0.04, 0.08, and 0.08, respectively; introductions exceed fixes in every mode.
- Detected patterns include path traversal, command injection, unsafe format strings, and SQL injection. These are static-analysis findings, not demonstrated exploits.
- The comparison is observational and commit-level. It neither isolates the causal effect of agent authorship nor attributes every finding to an agent-authored line.
Vibe coding introduces 0.47 findings per 1,000 added lines versus 0.12 for human-only and 0.15 for collaborative coding. Introductions exceed fixes in every mode; these commit-level static-analysis rates are neither causal estimates nor counts of confirmed exploits.
4.4 Agents work autonomously for longer, but users push back frequently
The oversight analysis is restricted to Claude Code for comparability with McCain et al. [28]. The median turn lasts about 20 seconds, the 90th percentile is under a minute and a half, and the pooled 99.9th percentile is 55 minutes.
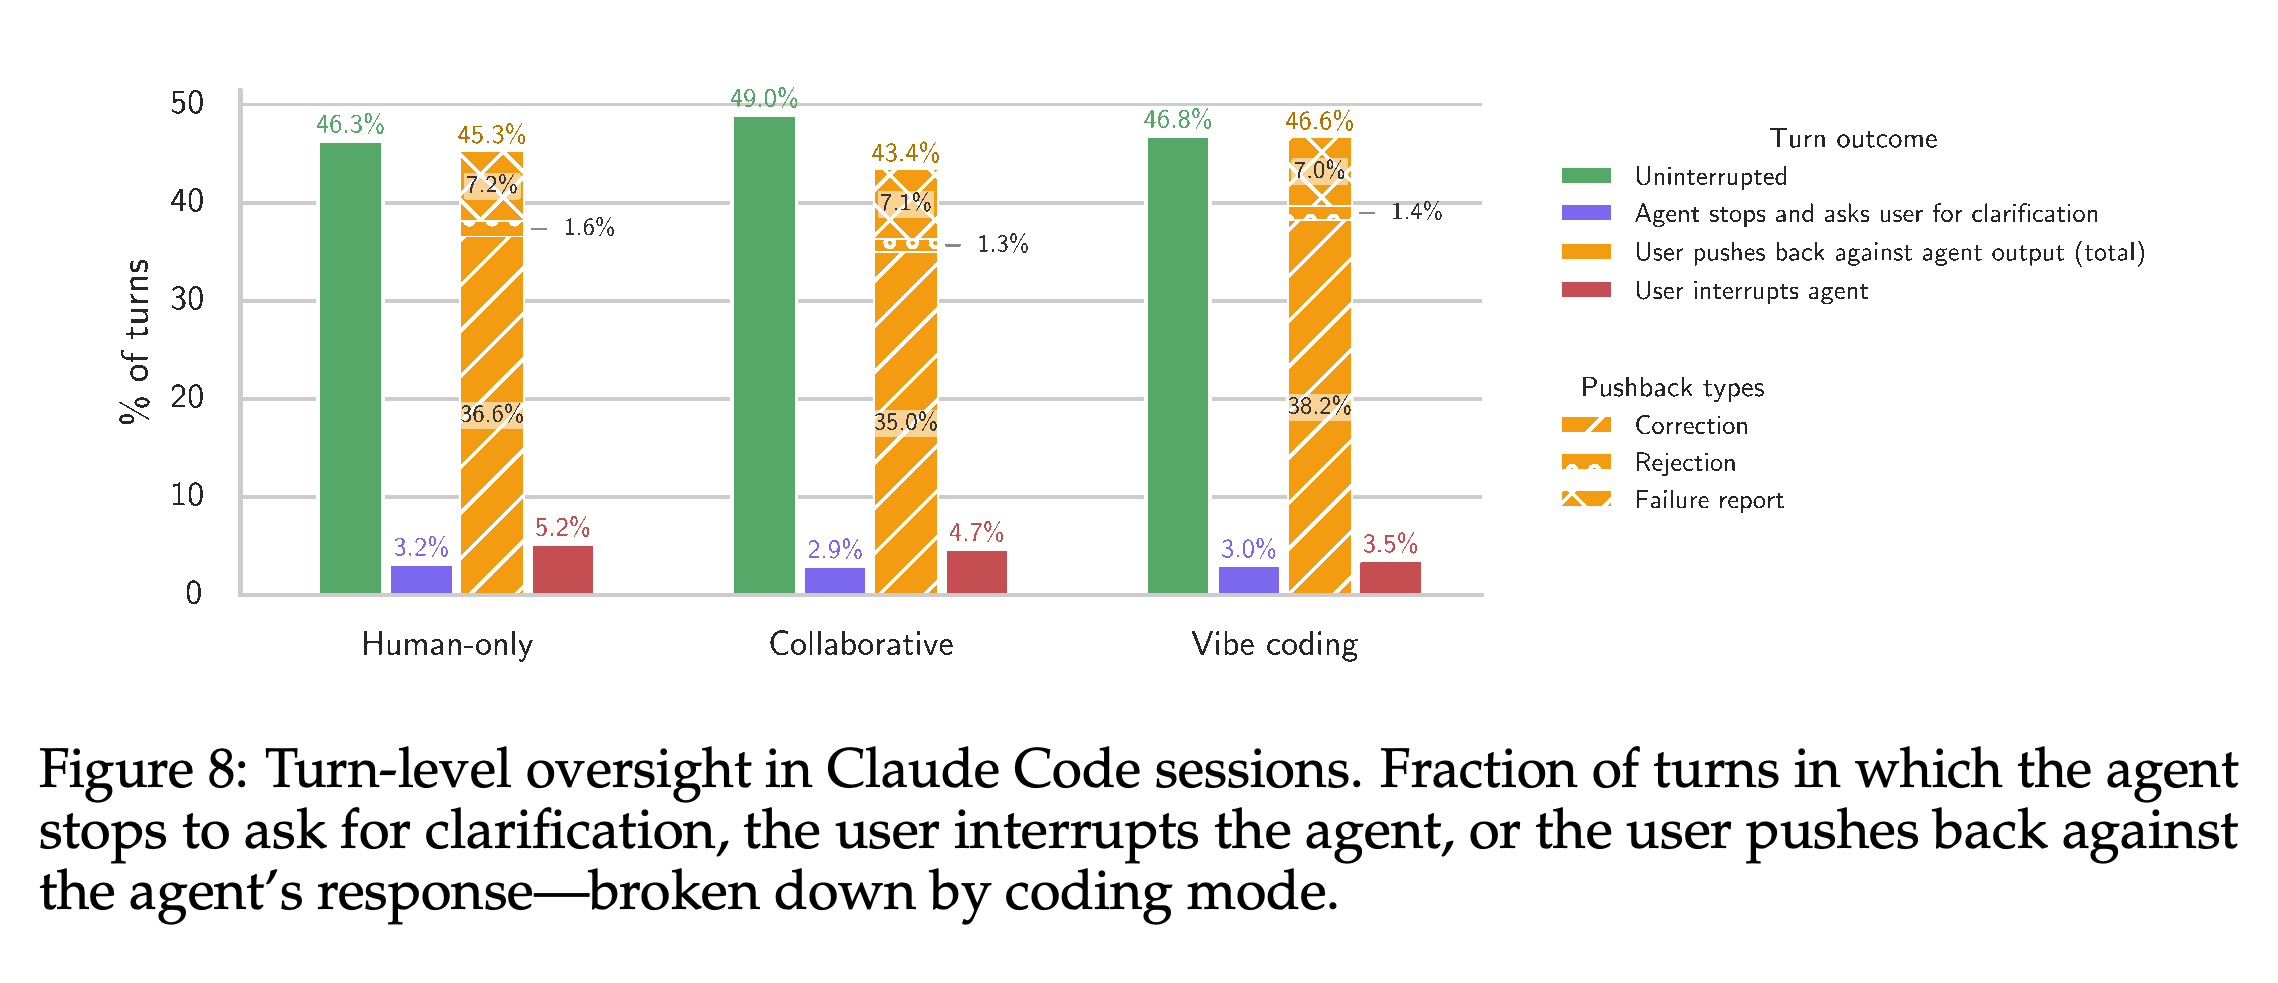
- Clarification calls occur in roughly 3% of turns; users interrupt in 4.5% and provide soft pushback in 45.7%. Interruptions and pushback together cover 50.2% of prompts.
- Figure 8 shows frequent corrections in every coding mode, including vibe coding. Near-total agent authorship therefore does not imply passive human participation.
- Appendix E.1.3 describes AskUserQuestion as non-blocking: a turn ends with an agent response. A clarification call is consequently not a direct measure of an execution-ending stop or of uncertainty expression more generally.
Corrections account for most soft pushback in all three coding modes, while clarification calls and hard interruptions are less common. Substantial pushback during vibe coding shows that near-total agent authorship can coexist with active supervision; clarification-tool detection does not by itself verify an execution stop.
5 Discussion
The discussion interprets near-total agent authorship, infrequent clarification, and frequent user correction as a possible imbalance between autonomy and guidance-seeking. Collaborative sessions have the lowest observed resource costs per committed line, while vibe-coded commits have the highest rate of new Semgrep findings.
- These measurements expose interaction and delivery costs absent from final-patch evaluations.
- The authors present an initial characterization of the SWE-chat population, not definitive findings about all coding-agent users.
- The evidence motivates evaluating autonomy alongside oversight, retention, and safety, but does not show that reducing autonomy would improve outcomes on the same tasks.
5.1 Outlook: implications for building better coding agents
The research agenda proposes realistic workflow-based benchmarks, adaptive human–agent interaction, and user simulators grounded in real trajectories. The paper does not experimentally evaluate these proposed interventions.
- Contextual next-action evaluation could include code comprehension and iterative interaction rather than only final patch correctness.
- Correction–response sequences provide data for studying when agents should ask questions, accept redirection, or change strategy.
- User simulators could support offline evaluation, but their fidelity would need validation against real interaction data.
5.2 SWE-chat downstream use and impact
Following the April 2026 release, SWE-Together [53] and SWE-INTERACT [42] used SWE-chat to construct interactive benchmarks and grounded user simulators. SecureForge [25] distilled Python tasks for security-hardening evaluation, and SLEIGHT-Bench [34] used transcripts as a benign baseline for agent monitors.
- The cited Transluce Docent Team [49] analysis reports severe monitor evasion in 1.9% and overselling of task success in 1.8% of SWE-chat sessions.
- Hitzig et al. [20] use SWE-chat to illustrate developer expertise levels in agentic coding.
- Continual collection enables longitudinal analysis, but release comparisons must account for changes in contributing repositories, users, and agents.
Ethics statement
SWE-chat includes public logs from developers who enable Entire CLI tracking and publish them, restricted to repositories with redistribution-compatible licenses. Attached images are not collected; user prompts and assistant responses undergo PII redaction with Microsoft Presidio and a spaCy transformer model, followed by credential removal with TruffleHog.
- The study procedure was reviewed and deemed exempt by the Stanford Institutional Review Board.
- These are the stated collection and release safeguards; automated redaction should not be assumed error-free.
Appendix
- A Limitations: Public Entire CLI users are an early-adopter sample that excludes proprietary enterprise codebases; about 16% of sessions originate from Entire.io’s own repository. Missing entirely abandoned outputs may inflate observed success and efficiency. Line-level attribution can miss semantic reuse: among 100 audited agent-code deletions, 92 did not reappear, 4 reappeared with few changes, and 4 resembled committed code. Committed lines, prompt characters, and logged runtime are incomplete proxies for usefulness and human effort, and LLM labels require further validation.
- B Differences between the SWE-chat v1 and v2 releases: September 2026 data contains more than three times as many sessions as the April release. Repository coverage grows from 205 to 707, Claude Code’s share falls from 85% to 68.8%, and coding efficiency increases from 44.3% to 59.4%. Changing sample composition prevents interpreting the efficiency difference alone as model improvement.
- C SWE-chat examples and C.1 Low session success score: A nuttycc/LuminTime session scores 10/100 after repeated changes to item animation timing in HistoryListView.swift fail to address the container timing identified by the user; the session ends without resolution or commits. C.2 User pushback distinguishes C.2.1 Correction, illustrated by pointing out session.CondensedTranscriptLines; C.2.2 Rejection, illustrated by undoing commit 766901b; and C.2.3 Failure report, illustrated by reporting a broken ChartExport.tsx change. The examples distinguish missing-context corrections, unwanted work, and nonfunctional output.
- C.3 Hard user interruptions shows installation commands executed in response to a README-update request, followed by interruption and repetition of the request. C.4 Agent stops to ask for clarification (AskUserQuestion) illustrates a workflow-choice question when changing .graph.md output to raw .mmd output. C.5 Prompt intent categories illustrates create, refactor, debug, understand, connect, git, test, and other. C.6 User persona categories contrasts precise refinements of a stable goal, underspecified delegation, and changing a CLI-command request from hiding to removal.
- D Experimentation details and D.1 Data processing pipeline: GitHub Code Search API queries discover repositories, and checkpoint directories are downloaded from the entire/checkpoints/v1 branch. Transcripts are parsed into turns, thinking traces, tool calls and results, token usage, paths, and commands. D.2 Metrics uses temporary shadow-branch checkpoints for committed authorship and chronologically replays file-modifying calls with Python’s difflib.SequenceMatcher to reconstruct line provenance; concurrent human and agent edits can yield inconsistent states.
- D.2 Metrics defines Agent-authored % = agent lines survived / total committed lines × 100; Coding efficiency = agent lines survived / agent cumulative lines produced × 100; and Code survival rate = agent lines survived / agent lines in final state × 100. Token efficiency = total tokens (in + out + cache) / total committed lines × 100; Cost efficiency = ∑API call tokens × pricemodel / total committed lines × 100; Cognitive efficiency = ∑ user prompt characters / total committed lines × 100; Time efficiency = ∑ session runtimes / total committed lines × 100; and Agent runtime efficiency = ∑ agent runtimes / total committed lines × 100. Session runtime excludes idle periods longer than 2 minutes, while agent runtime sums turn completion times. D.3 Combining session-level statistics with commit-level outcomes restricts Table 3 and Figure 29 to unambiguous mappings, retaining 47.7% of sessions.
- E Additional results and E.1 Dataset statistics: E.1.1 Prompt languages uses lingua-py, retains languages appearing in at least 100 prompts, and manually checks 2,000 low-confidence or suspicious classifications; English predominates. E.1.2 Tool calls groups 1,996,558 calls into cross-harness categories. E.1.3 Agent trajectories shows increasing editing and building after initial orientation; ExitPlanMode constitutes 14.7% of final calls before hard interruptions despite representing only 0.1% of calls overall. E.1.4 Code repository types reports 51.8% application and 42.1% devtools domains, with 64.4% targeting developers. E.1.5 Dataset diversity over time tracks Entire.io’s cumulative session share falling to about 16%.
- E.2 Topic distribution and E.2.1 Topic clustering methodology: English prompts are stripped of interruption signals, system-injected content, skill invocations, image references, and code blocks; texts of 30–1,500 characters are retained and deduplicated case-insensitively. all-mpnet-base-v2 embeddings are reduced from 768 to 20 dimensions with UMAP, then clustered using HDBSCAN* with min_cluster_size=520 and min_samples=5. The 100 highest-membership prompts per cluster inform gpt-5.6-sol topic labels. E.2.2 Findings reports 20 clusters covering 47.6% of analyzed prompts and 32,835 noise prompts, or 52.4%; frontend UI refinement and version-control metadata debugging have 74% pushback. Some clusters are dominated by individual repositories.
- E.3 Distribution of user personas: The dataset contains 589 users, 78% contributing multiple sessions; a user’s majority-session persona matches their individual-session persona 74.5% of the time on average. E.4 Coding mode distribution over time uses 14-day rolling averages and shows vibe coding rising from below 20% to above 50%. These aggregates do not separate within-user changes from changes in the contributor population.
- E.5 Code vulnerability analysis with Semgrep scans pre- and post-commit snapshots using the default –config=auto ruleset and retains findings in modified files. Mutable GitHub Actions tags account for 33% of introduced findings and unsanitized JavaScript path joining for 13%; other categories include CWE-1333, CWE-134, CWE-353, CWE-78, and CWE-89. The Python example interpolates target into a command passed to subprocess.run with shell=True; the stated fix passes [“make”, target] with shell=False to avoid shell reparsing.
- E.6 Agent efficiency compares tokens, prompt characters, session time, and agent runtime per 100 committed lines, with collaborative coding having the lowest observed resource costs. E.7 Agent turn duration over time reports stable medians and fluctuating upper tails, with a pooled 99.9th percentile of 55 minutes. E.8 Oversight rates over time characterizes the rates as relatively stable and plots 7-day rolling averages across January–September 2026. E.9 Development activities compares code writing (create, refactor, connect) with reviewing (understand, test): mean turns last 6.3 versus 3.5 minutes, and clarification occurs in 6.8% versus 2.7% of turns.
- F Data annotation and F.1 Validation: Two author-annotators refine codebooks on 10 examples and independently label 90 more for non-repository tasks; categorical disagreements are reconciled to construct 100 gold labels. Success gold scores use the two human ratings’ average, with joint decisions when ratings differ by >20; repository labels instead undergo second-annotator review. Human Cohen’s κ is 0.709 for intent, 0.832 for pushback, 0.888 for binary pushback, and 0.662 for persona; success agreement is Spearman ρ = 0.757 and ICC(2,1) = 0.503. Testing 9–11 models and 2–4 prompt paraphrases per task yields selected-model accuracies of 0.76, 0.67, 0.79, 0.69, 0.81, and 0.84 for intent, pushback, binary pushback, persona, repository domain, and audience, respectively; the success judge has ICC(2,1) = 0.60 in Table 8.
- F.2 Annotation prompts documents F.2.1 Repository type classifier, F.2.2 Session persona classifier, F.2.3 Prompt intent classifier, F.2.4 User pushback classifier, and F.2.5 Session success rating. Repository classification merges library with devtools; persona classification uses gpt-5.4-2026-03-05 with reasoning_effort = low. Both Qwen classifiers use temperature = 0.7, top_p = 0.8, top_k = 20, and presence_penalty = 1.5. Intent uses the prompt alone, whereas pushback uses preceding context and includes redirection that need not indicate a technical failure. The 0–100 success rubric considers goal completion, final state, efficiency, code and commit quality, and user experience.
Brief Thoughts
The dataset’s strongest contribution is linking interaction traces with committed-code provenance. This separates generated code from retained output and reveals active human steering even when agents author nearly all committed lines—distinctions unavailable from final patches alone.
The efficiency and security comparisons are useful descriptive evidence, not causal estimates of vibe coding’s effect on productivity or safety. The 47.7% mapping restriction, missing abandoned sessions, per-line denominators, static-analysis coverage, and annotation errors should remain explicit in downstream evaluations.