


AutoLab: Can Frontier Models Solve Long-Horizon Auto Research and Engineering Tasks? | Summary
03 Jun 2026 | Paper Review AI Research Agents LLM Evaluation Harness OptimizationContents
- Summary
- 1 Introduction
- 2 The AUTOLAB Benchmark
- 3 Benchmark Results
- 4 Analysis
- 5 Related Work
- 6 Conclusion
- Limitations and Broader Impact
- Appendix
- Brief Thoughts
This article explains the key points of AutoLab: Can Frontier Models Solve Long-Horizon Auto Research and Engineering Tasks?.
- 2026-06-03 (arXiv)
- Xu, Zhangchen, Chen, Junda, Huang, Yue, Jiang, Dongfu, Chen, Jiefeng, Hua, Hang, Wu, Zijian, Liu, Zheyuan, He, Zexue, Li, Lichi, et al.
- University of Washington, Stanford University, UCSB, UCSD, University of Notre Dame, Princeton University, NUS, University of Waterloo, MIT, NVIDIA, Bake AI, Google, MIT-IBM Computing Research Lab, Independent Researcher
- Paper
- Github
- Project Page
Summary
- AutoLab: Can Frontier Models Solve Long-Horizon Auto Research and Engineering Tasks? introduces AUTOLAB, a benchmark of 36 executable optimization tasks across system optimization, puzzle & challenge, model development, and CUDA kernel optimization. Agents improve supplied baselines through empirical iteration under wall-clock budgets of 2–12 hours, with continuous scoring and held-out verification.
- The study evaluates 17 models using a standardized default harness and three independent rollouts per model–task pair. On the 11-model main leaderboard, claude-opus-4.6 leads with Avg@3 = 0.68, Best@3 = 0.76, and Dominance = 0.93; gemini-3.1-pro follows with Avg@3 = 0.50.
- Trajectory inspection associates strong performance with repeated measurement and refinement, while failures frequently involve premature submission or budget exhaustion. A 25-task harness ablation changes kimi-k2.6’s mean score from 0.21 under pi-mono to 0.64 under optimization-prompted mini-swe-agent*, showing that measured performance depends substantially on the model–harness configuration.
1 Introduction
Research and engineering optimization require agents to inspect artifacts, propose changes, execute experiments, measure outcomes, and revise over hours. The paper argues that single-turn coding tests and short interactive benchmarks inadequately assess sustained optimization, while specialized research systems make the model’s contribution difficult to separate from bespoke tools and search strategies.
- AUTOLAB combines heterogeneous engineering domains under common budget and scoring rules rather than evaluating only ML development or kernel optimization.
- The reported evaluation consumed 2,544 wall-clock hours and 8.60 billion tokens. The released resources are identified as autolabhq/autolab and autolab.moe.
- The contributions include the benchmark, a standardized 17-model evaluation, and trajectory analysis with manual inspection of 302 zero-score rollouts. The claim that persistence is the dominant predictor is stronger than the controlled evidence presented.
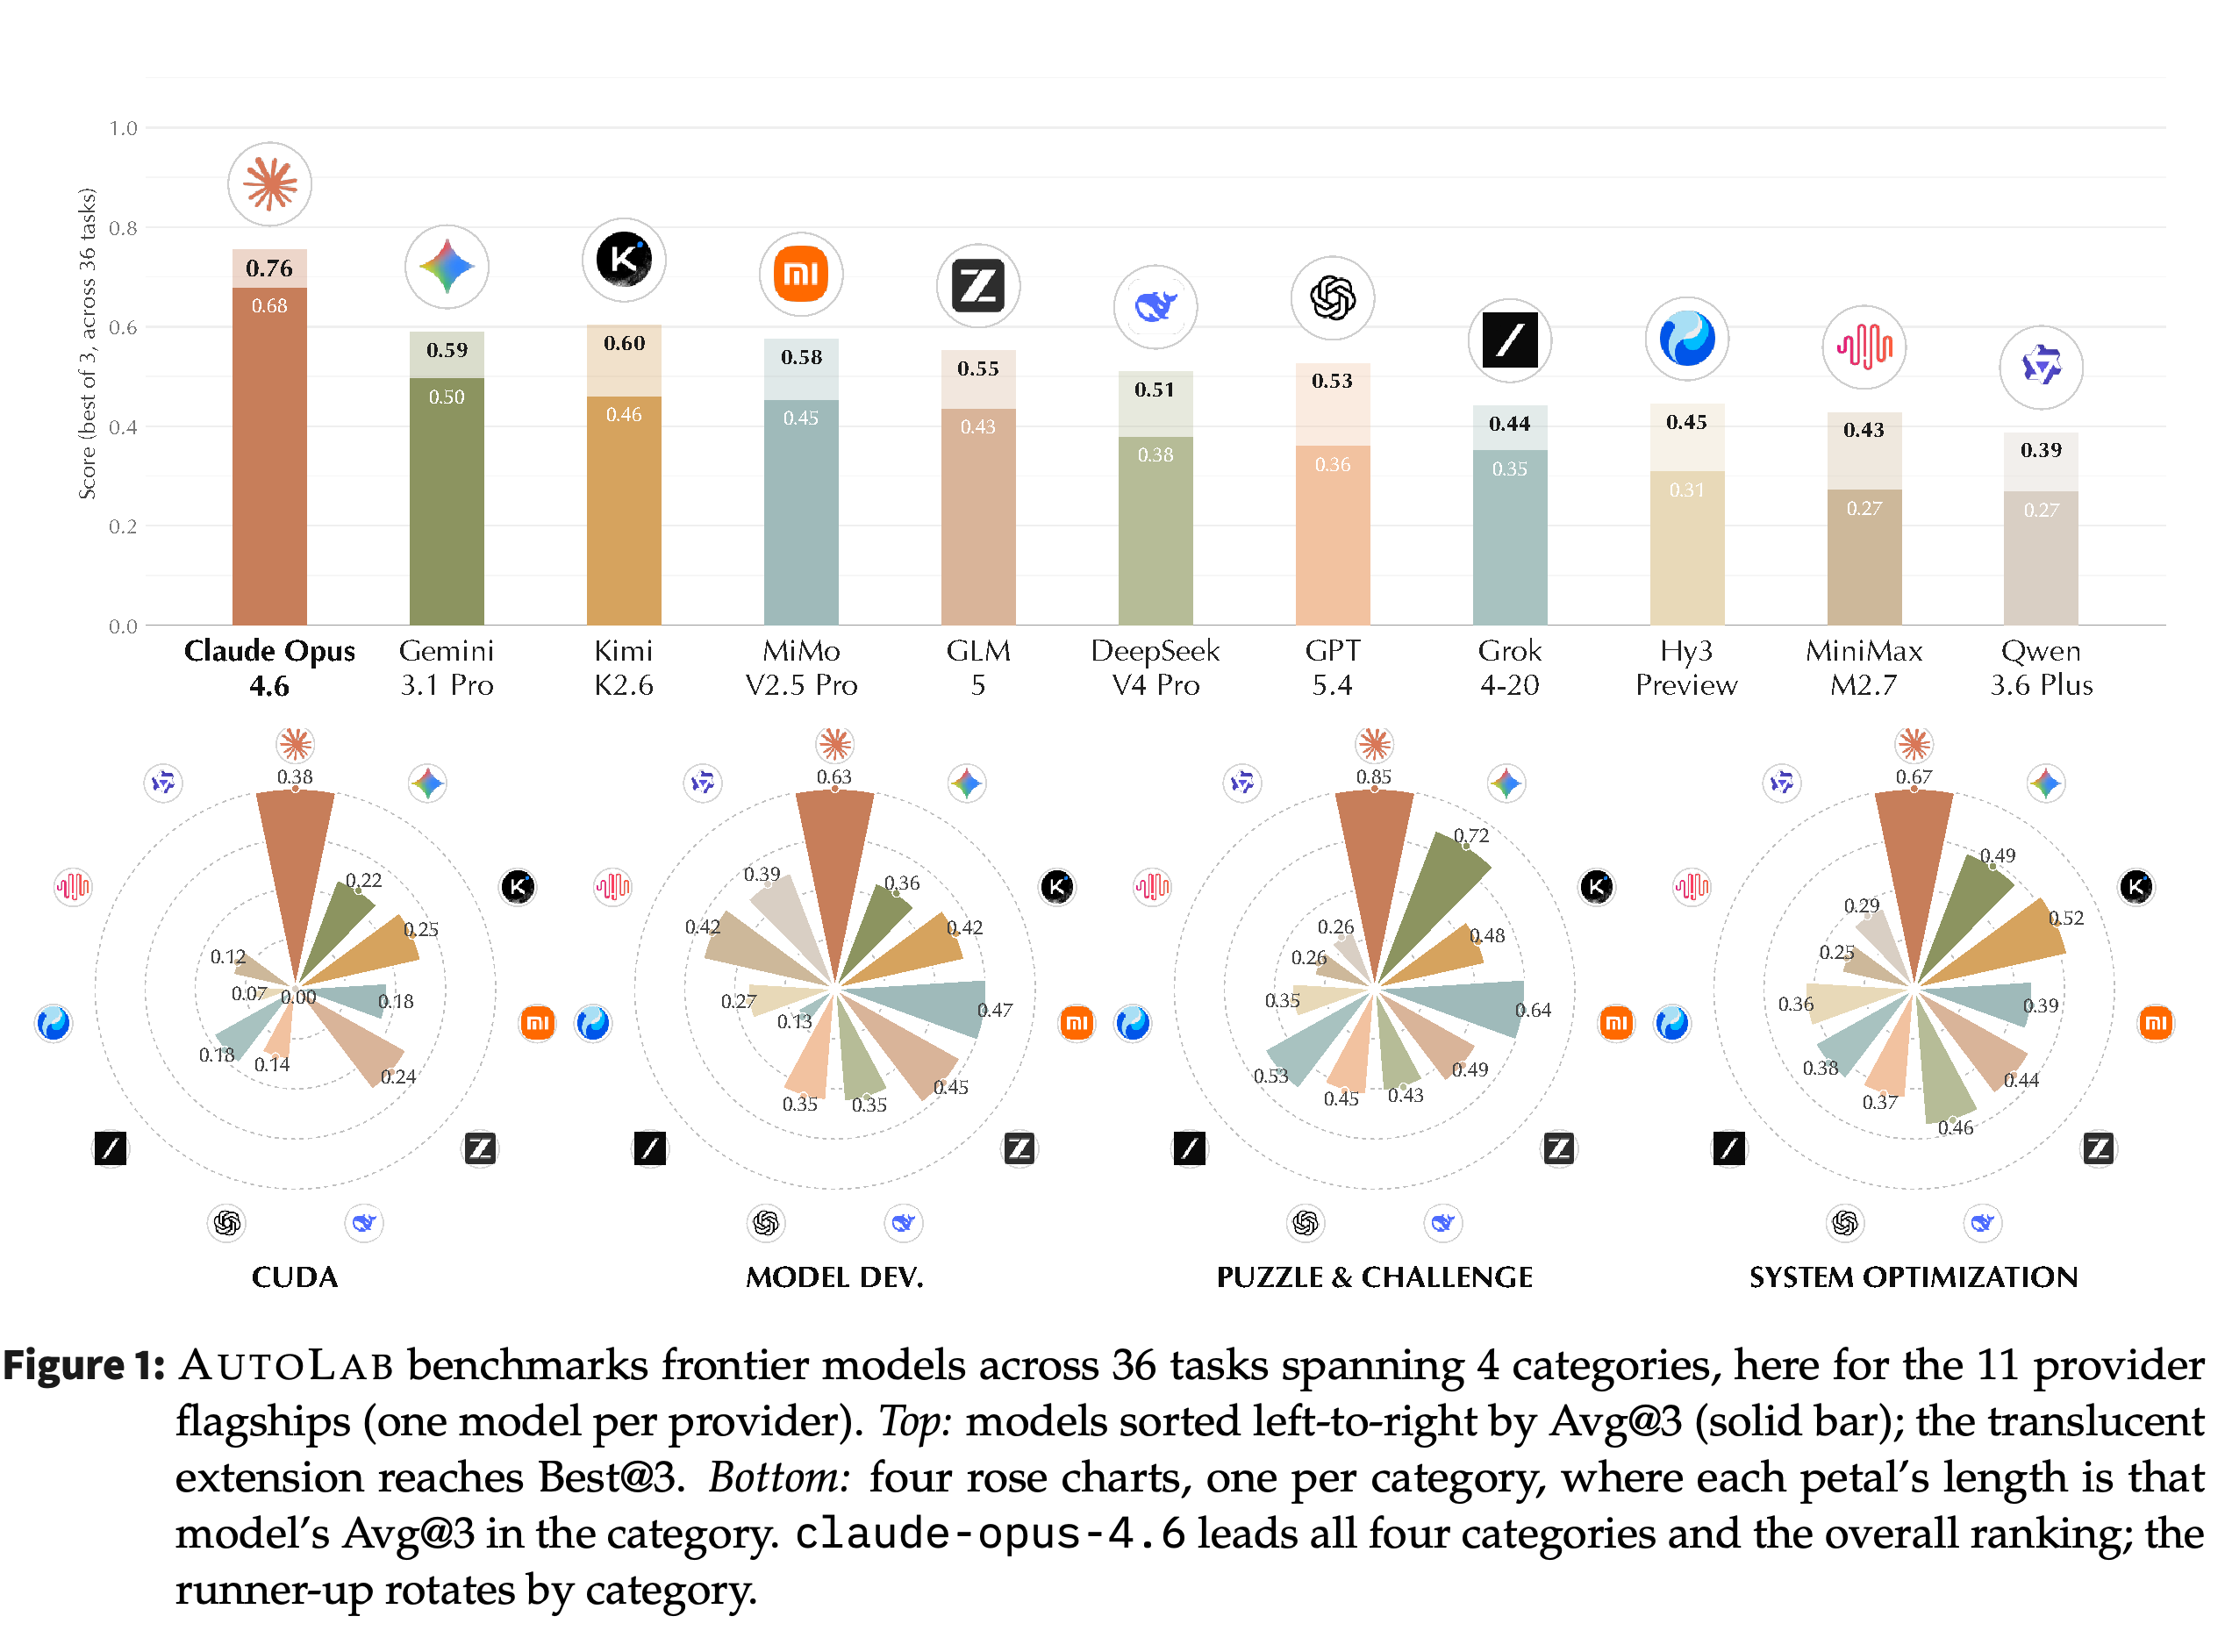
The overall bars separate claude-opus-4.6’s 0.68 Avg@3 from gemini-3.1-pro’s 0.50, while the translucent extensions show gains from selecting the best of three runs. The category charts show different runners-up across domains, so the overall ordering obscures specialization.
2 The AUTOLAB Benchmark
AUTOLAB is organized around three design commitments: sustained empirical iteration, continuous calibrated scoring, and hack-resistant verification. These address the need to reward partial optimization progress across heterogeneous metrics and to restrict shortcuts that exploit performance measurement rather than improve the implementation.
2.1 Task Formulation
Each task contains an instruction, a containerized CPU or single-GPU environment, a verifier, a hidden human-written reference solution, and a wall-clock budget. Agents can edit code, execute and profile implementations, invoke local evaluation, and inspect intermediate results; final scoring uses held-out inputs rather than the development evaluator.
- The general design calls for correct but suboptimal baselines and references with meaningful improvement headroom, typically at least an order of magnitude for system optimization and a statistically clear gain for model development. The appendix documents an exception: flux2_klein_lora ships an OOM-prone configuration.
- Budgets range from 2 hours for smaller puzzles to 12 hours for end-to-end language-model development. Smaller training workloads permit several experimental iterations without frontier-scale training costs.
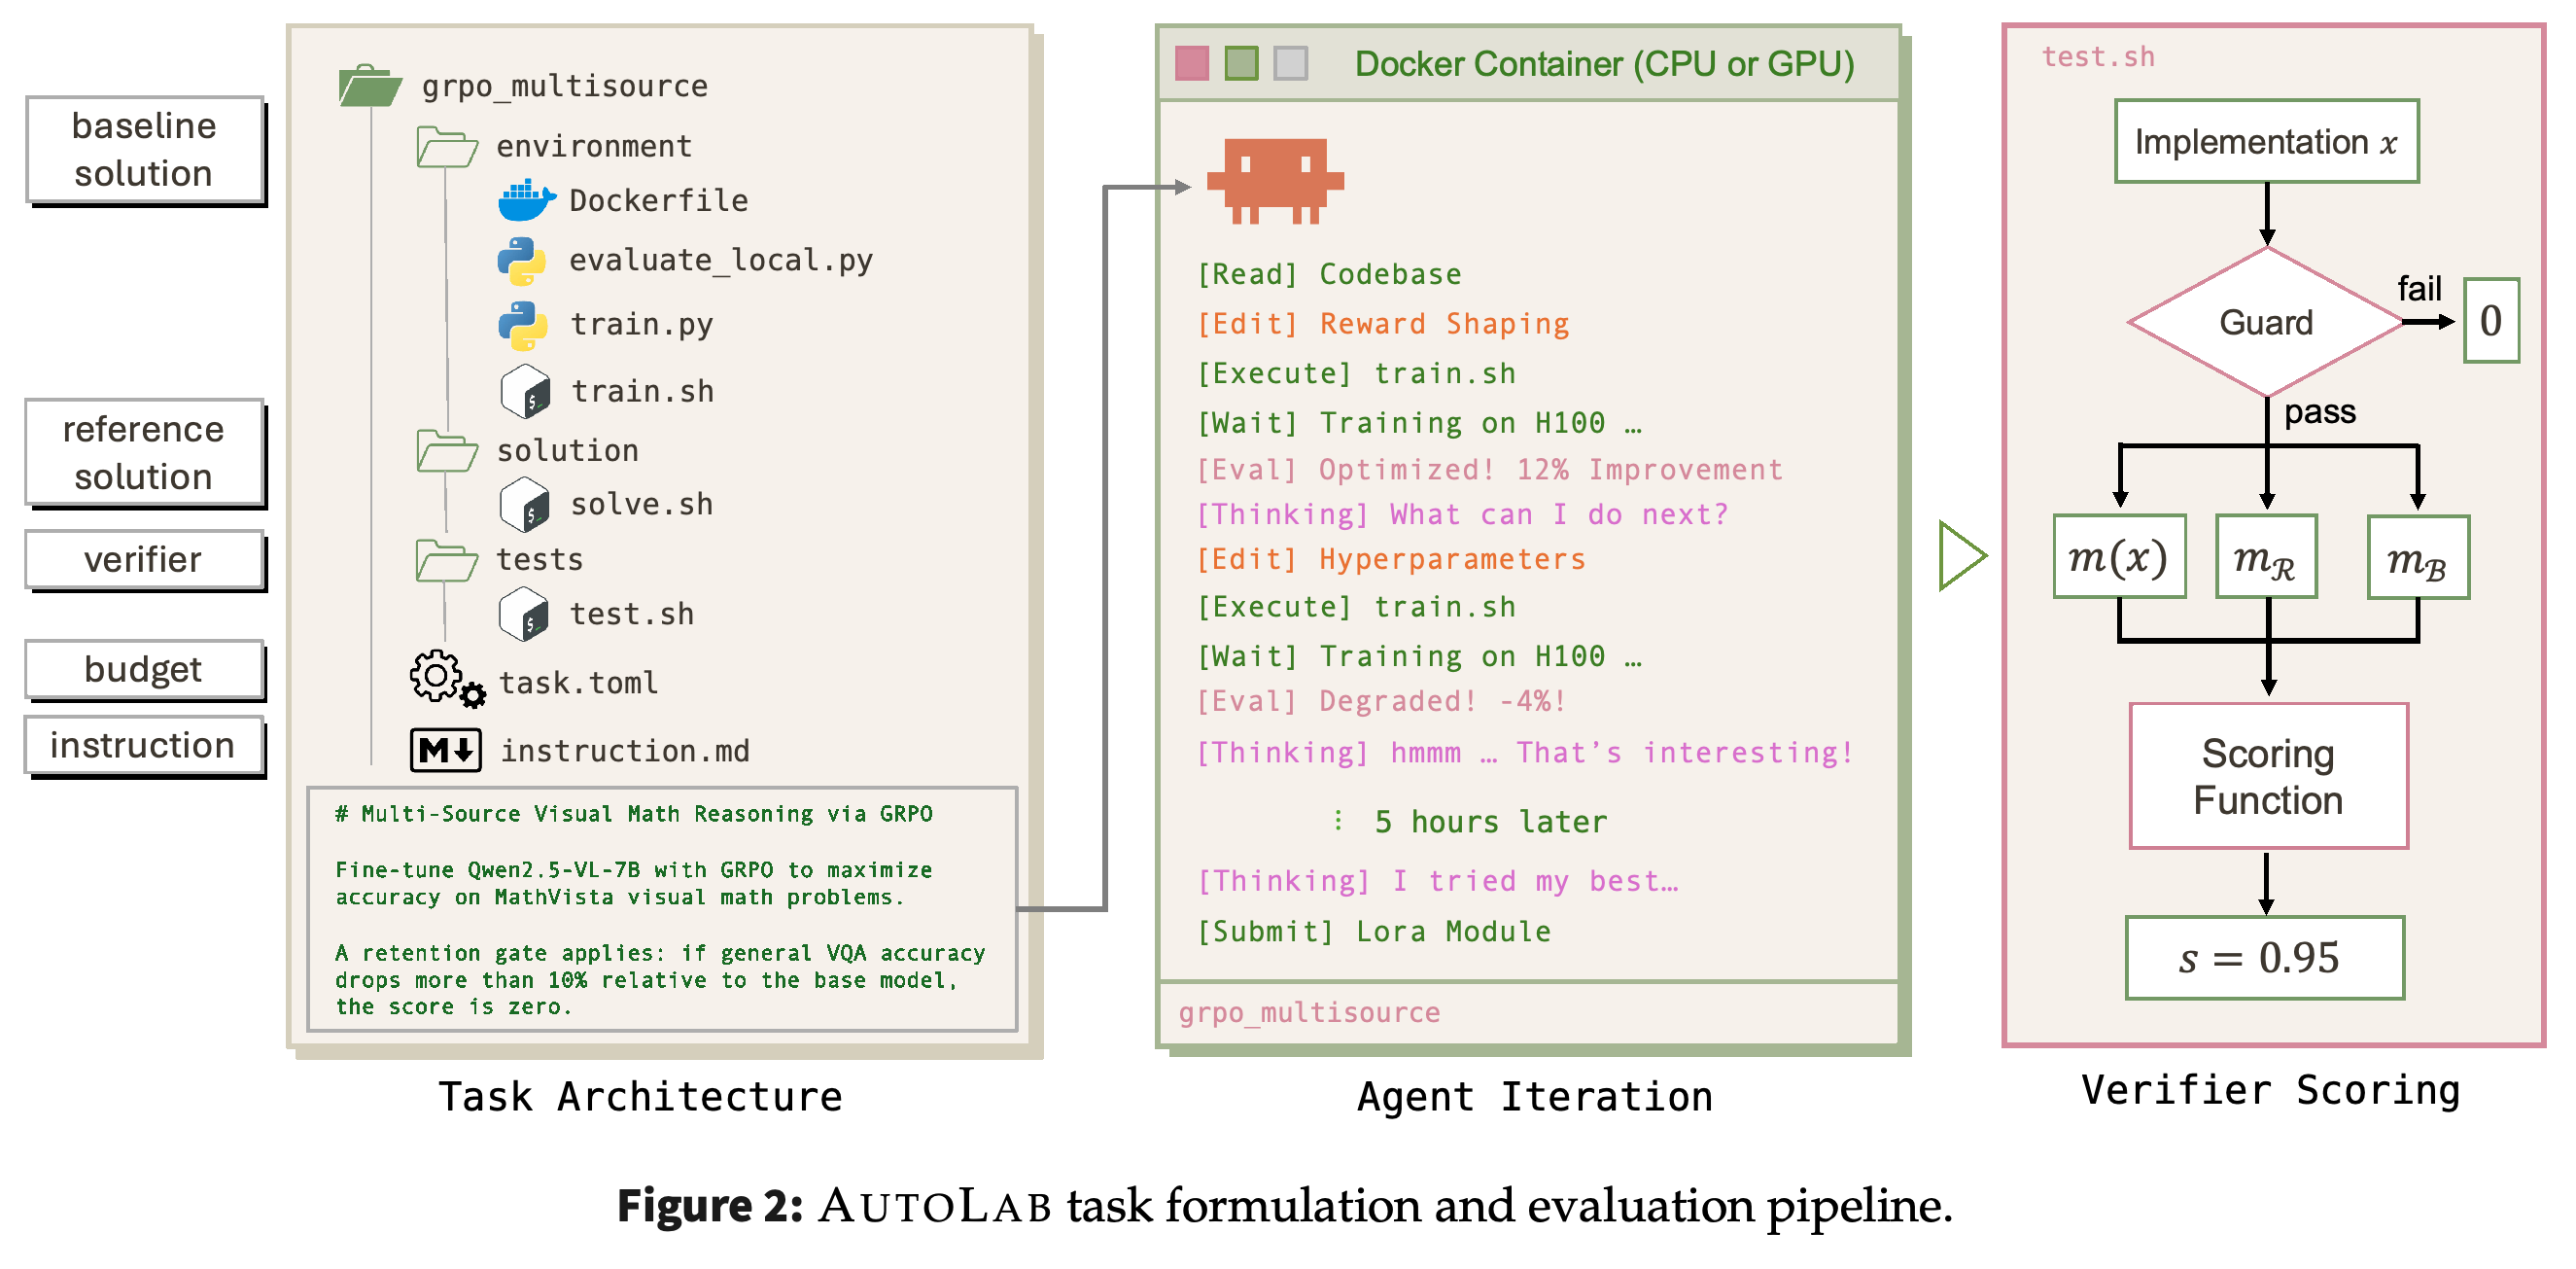
- Figure 2 distinguishes development feedback from final verification: a failed guard yields zero before the optimization metric is scored.
The workflow separates editable development artifacts and local feedback from guarded final scoring. Its score of 0.95 is illustrative, not a reported experimental result; feasibility failure produces zero before metric normalization. The schematic names H100 for grpo_multisource training, whereas Appendix A.1 specifies L40S for the task.
For lower-is-better metrics, log-stretch scoring is (s(x)=\operatorname{clip}\left(\frac{1}{2}\frac{\log(m_B/m(x))}{\log(m_B/m_R)},0,1\right)), whereas anchored linear scoring is (s(x)=\operatorname{clip}\left(\frac{m_B-m(x)}{m_B-m_R},0,1\right)). Here m(x), mB, and mR denote implementation, baseline, and reference metrics; higher-is-better metrics use directional analogues.
- Log-stretch assigns 0 to the baseline and 0.5 to the reference, leaving room to reward performance beyond the reference. A minimum-improvement gate prevents unchanged baselines from earning credit.
- Linear scoring assigns 0 to the baseline and 1.0 to the reference. Thus, equal numerical scores need not represent equal relationships to the reference across scoring families.
- Runtime anchors are calibrated to the benchmark hardware and sandbox. Their values and task-specific feasibility gates are documented in Appendix A.2.
2.2 Benchmark Construction
Senior researchers and engineers contributed tasks drawn from workflows they had encountered, prioritizing realism and diversity rather than artificial difficulty. Each task underwent review by at least 2 experts independent of its contributor and a format audit agent, assessing validity, solvability within budget, integrity, and measurement stability.
- The final verifier’s held-out inputs and reference outputs are sealed, while agents retain access to local development evaluation.
- ML correctness gates use inputs drawn from a distribution disjoint from visible development data. Dedicated adversarial auditing searches for shortcuts, and unauthorized changes to SHA-pinned critical files receive zero.
- Newly discovered exploits trigger verifier patches and task re-validation. These safeguards reduce opportunities for reward hacking but do not establish that every possible exploit has been eliminated.
2.3 Benchmark Composition
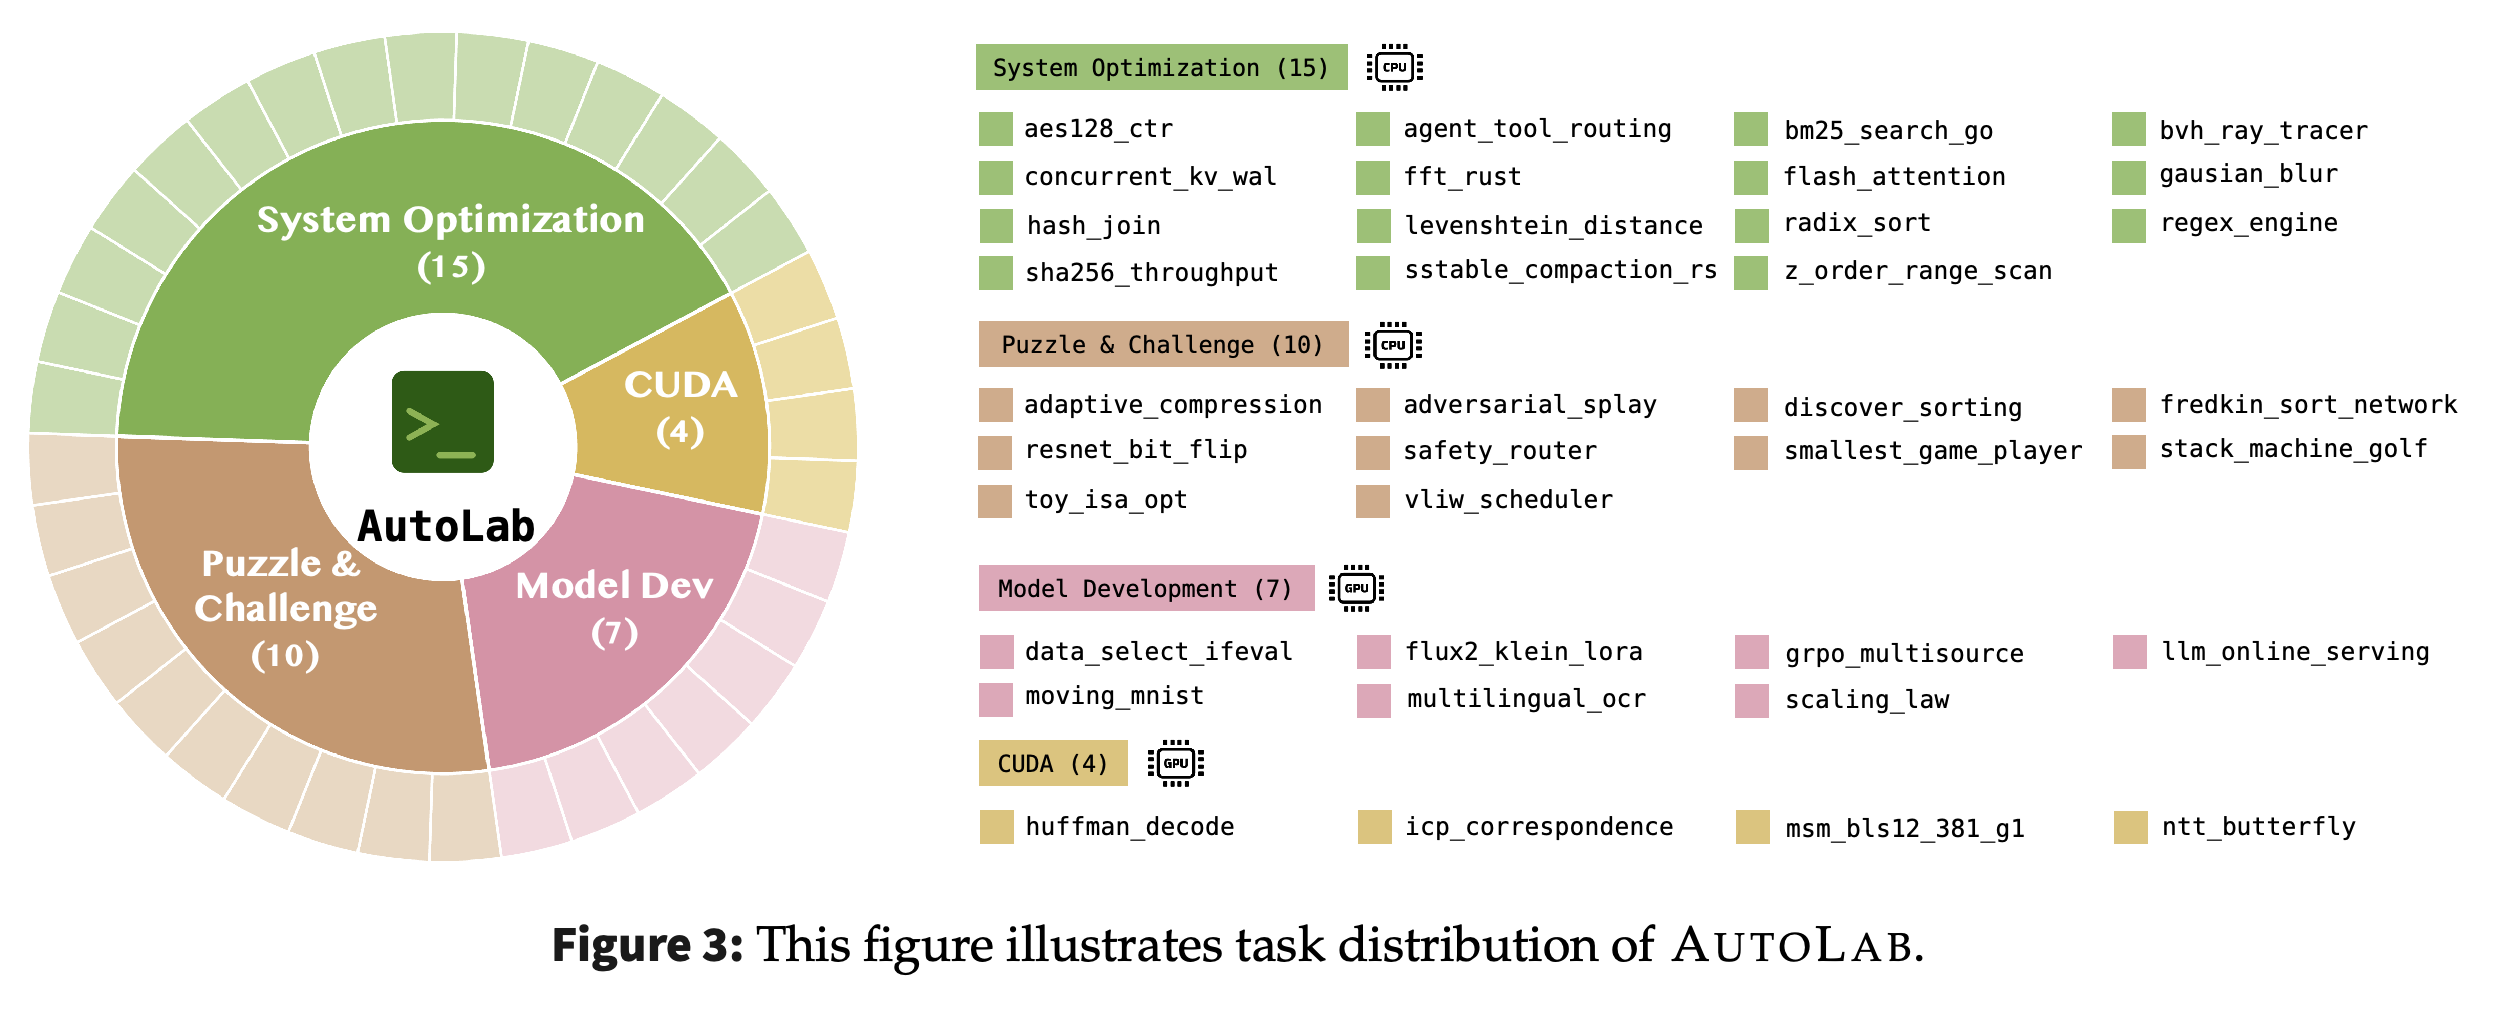
The benchmark contains 15 System Optimization tasks, 10 Puzzle & Challenge tasks, 7 Model Development tasks, and 4 CUDA tasks. The distribution in Figure 3 means that system optimization contributes more tasks to the overall mean than any other category.
- System Optimization covers low-level performance engineering in C, C++, Rust, Go, and Python, including sorting, hashing, search, cryptography, and storage primitives.
- Puzzle & Challenge emphasizes algorithmic insights, reversible sorting, adversarial constructions, compact learned models, and instruction scheduling.
- Model Development spans pretraining, post-training, data selection, parameter-efficient fine-tuning, video prediction, OCR, and serving; CUDA covers cryptographic primitives, point-cloud correspondence, and compression.
The category proportions expose unequal coverage: 15 system tasks versus 4 CUDA tasks. Overall task-averaged performance therefore weights system optimization more heavily than CUDA; the appendix supplies full task identifiers where the diagram uses abbreviations or variant spellings.
3 Benchmark Results
The evaluation reports overall and category-specific outcomes alongside an attention-kernel optimization case study. Eleven provider flagships form the main comparison set, and six older or smaller variants support additional analyses.
3.1 Experimental Setup
All models use HARBOR with terminus-2 as the default agent. CPU tasks run in Docker on an AMD Ryzen 9 9950X workstation with 16 cores / 32 threads and 64 GB RAM; GPU tasks use Modal sandboxes with H100 or L40S GPUs, and task metadata enforces CPU and memory caps.
- The four proprietary models are claude-opus-4.6, gemini-3.1-pro, gpt-5.4, and grok-4-20. The paper groups qwen-3.6-plus, deepseek-v4-pro, glm-5, kimi-k2.6, hunyuan-3-preview, mimo-v2.5-pro, and minimax-m2.7 as its open-weight main models.
- Six ablation models are kimi-k2.5, minimax-m2.5, mimo-v2-pro, mimo-v2.5, deepseek-v4-flash, and qwen-3.5-plus.
- The paper excludes small open-weight models with <200B parameters because of benchmark difficulty, limiting conclusions about smaller-model agents.
Every model–task pair receives three independent rollouts. Avg@3 averages their scores, Best@3 takes their maximum, and Dominance averages task-level head-to-head wins against other models using Avg@3, assigning half credit to ties.
- Best@3 is the best observed result from three trials, not an established ceiling on the agent’s capability.
- Dominance lies in [0, 1]; 1 indicates strict superiority to every opponent on every task, while 0.5 represents average head-to-head performance. It depends on within-task ordering rather than score-difference magnitude.
- Table 1 reports Dominance for the main set, not the six ablation variants.
3.2 Main Results
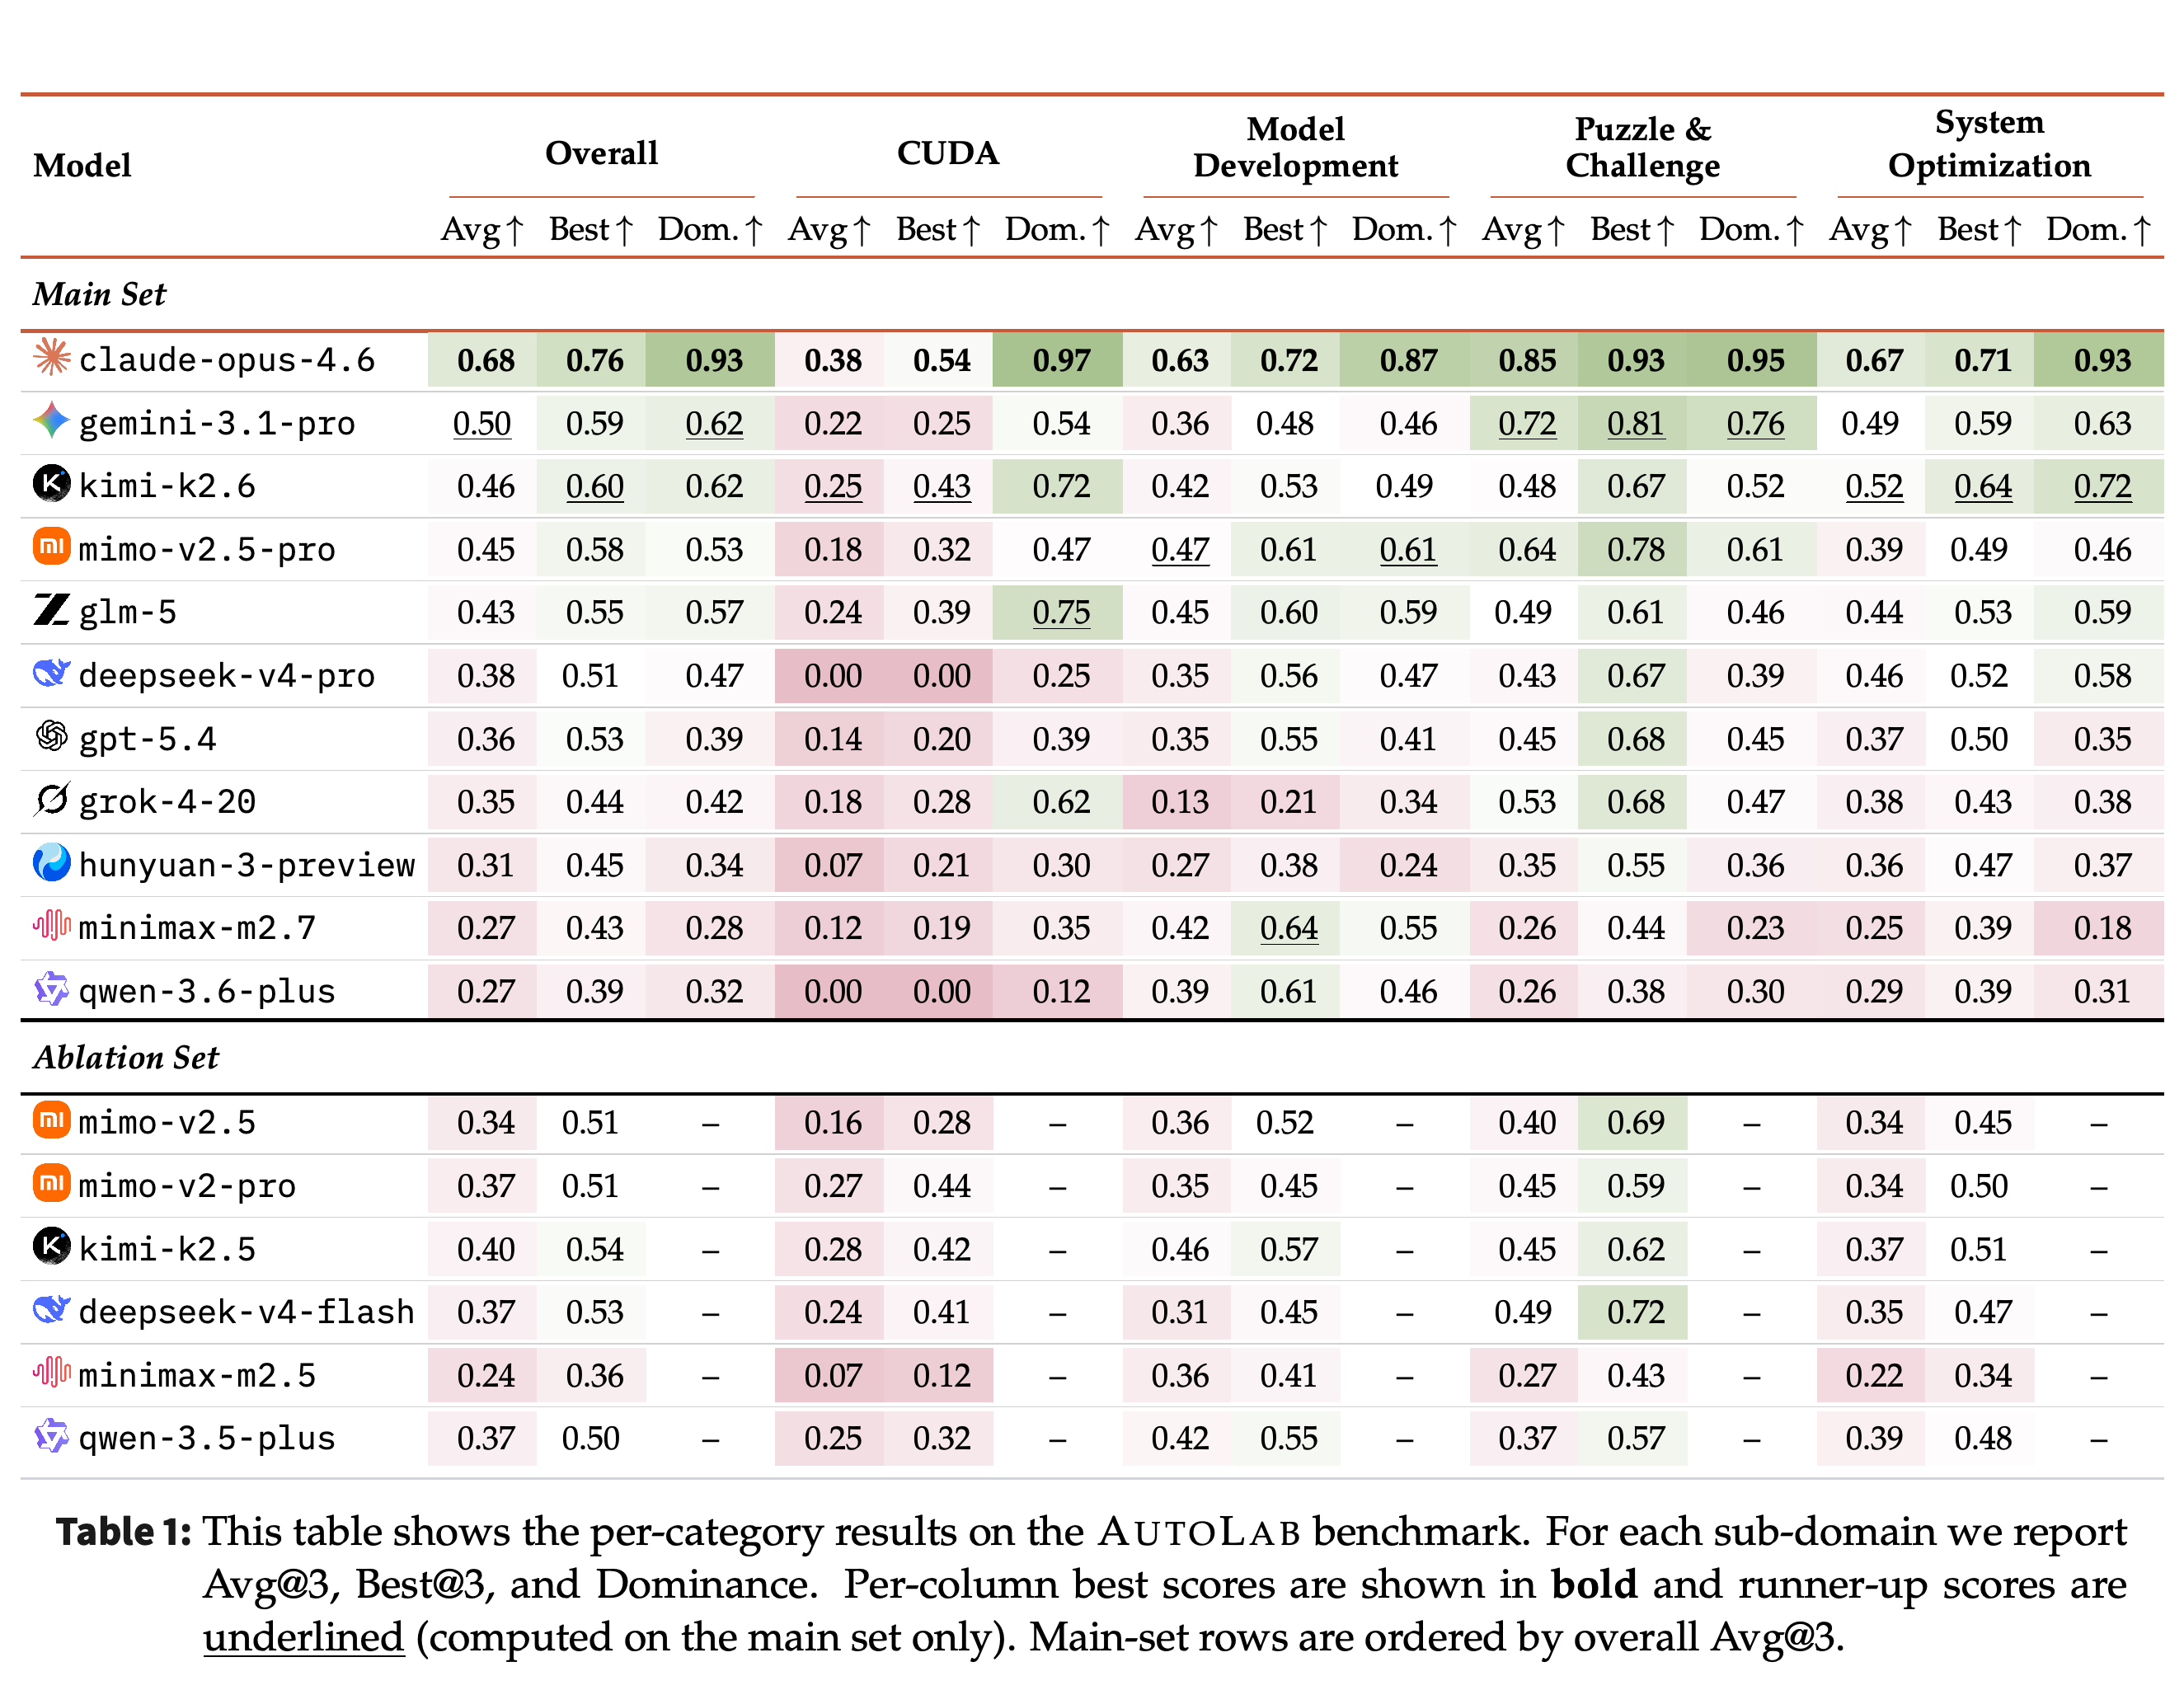
Table 1 places claude-opus-4.6 first overall and in all four categories. Its category Avg@3 scores are 0.38 for CUDA, 0.63 for Model Development, 0.85 for Puzzle & Challenge, and 0.67 for System Optimization; its overall lead over gemini-3.1-pro is 0.18.
- Among the paper’s open-weight main models, kimi-k2.6, mimo-v2.5-pro, and glm-5 cluster at overall Avg@3 values of 0.46, 0.45, and 0.43.
- gpt-5.4 and grok-4-20 score 0.36 and 0.35. The authors associate their lower rankings with premature termination, based on trajectory inspection rather than a controlled isolation of coding ability.
- deepseek-v4-flash scores 0.37 versus deepseek-v4-pro’s 0.38, while outperforming it on CUDA and puzzles. gemini-3.1-pro’s strongest category is puzzles; the paper reports median rollout lengths of 12 steps for this model and 57 for claude-opus-4.6.
The main-set rows establish claude-opus-4.6’s lead in mean performance and head-to-head Dominance. The ablation rows show that deepseek-v4-flash nearly matches deepseek-v4-pro overall while exceeding it in CUDA and puzzles, so scale alone does not determine the ordering under this harness.
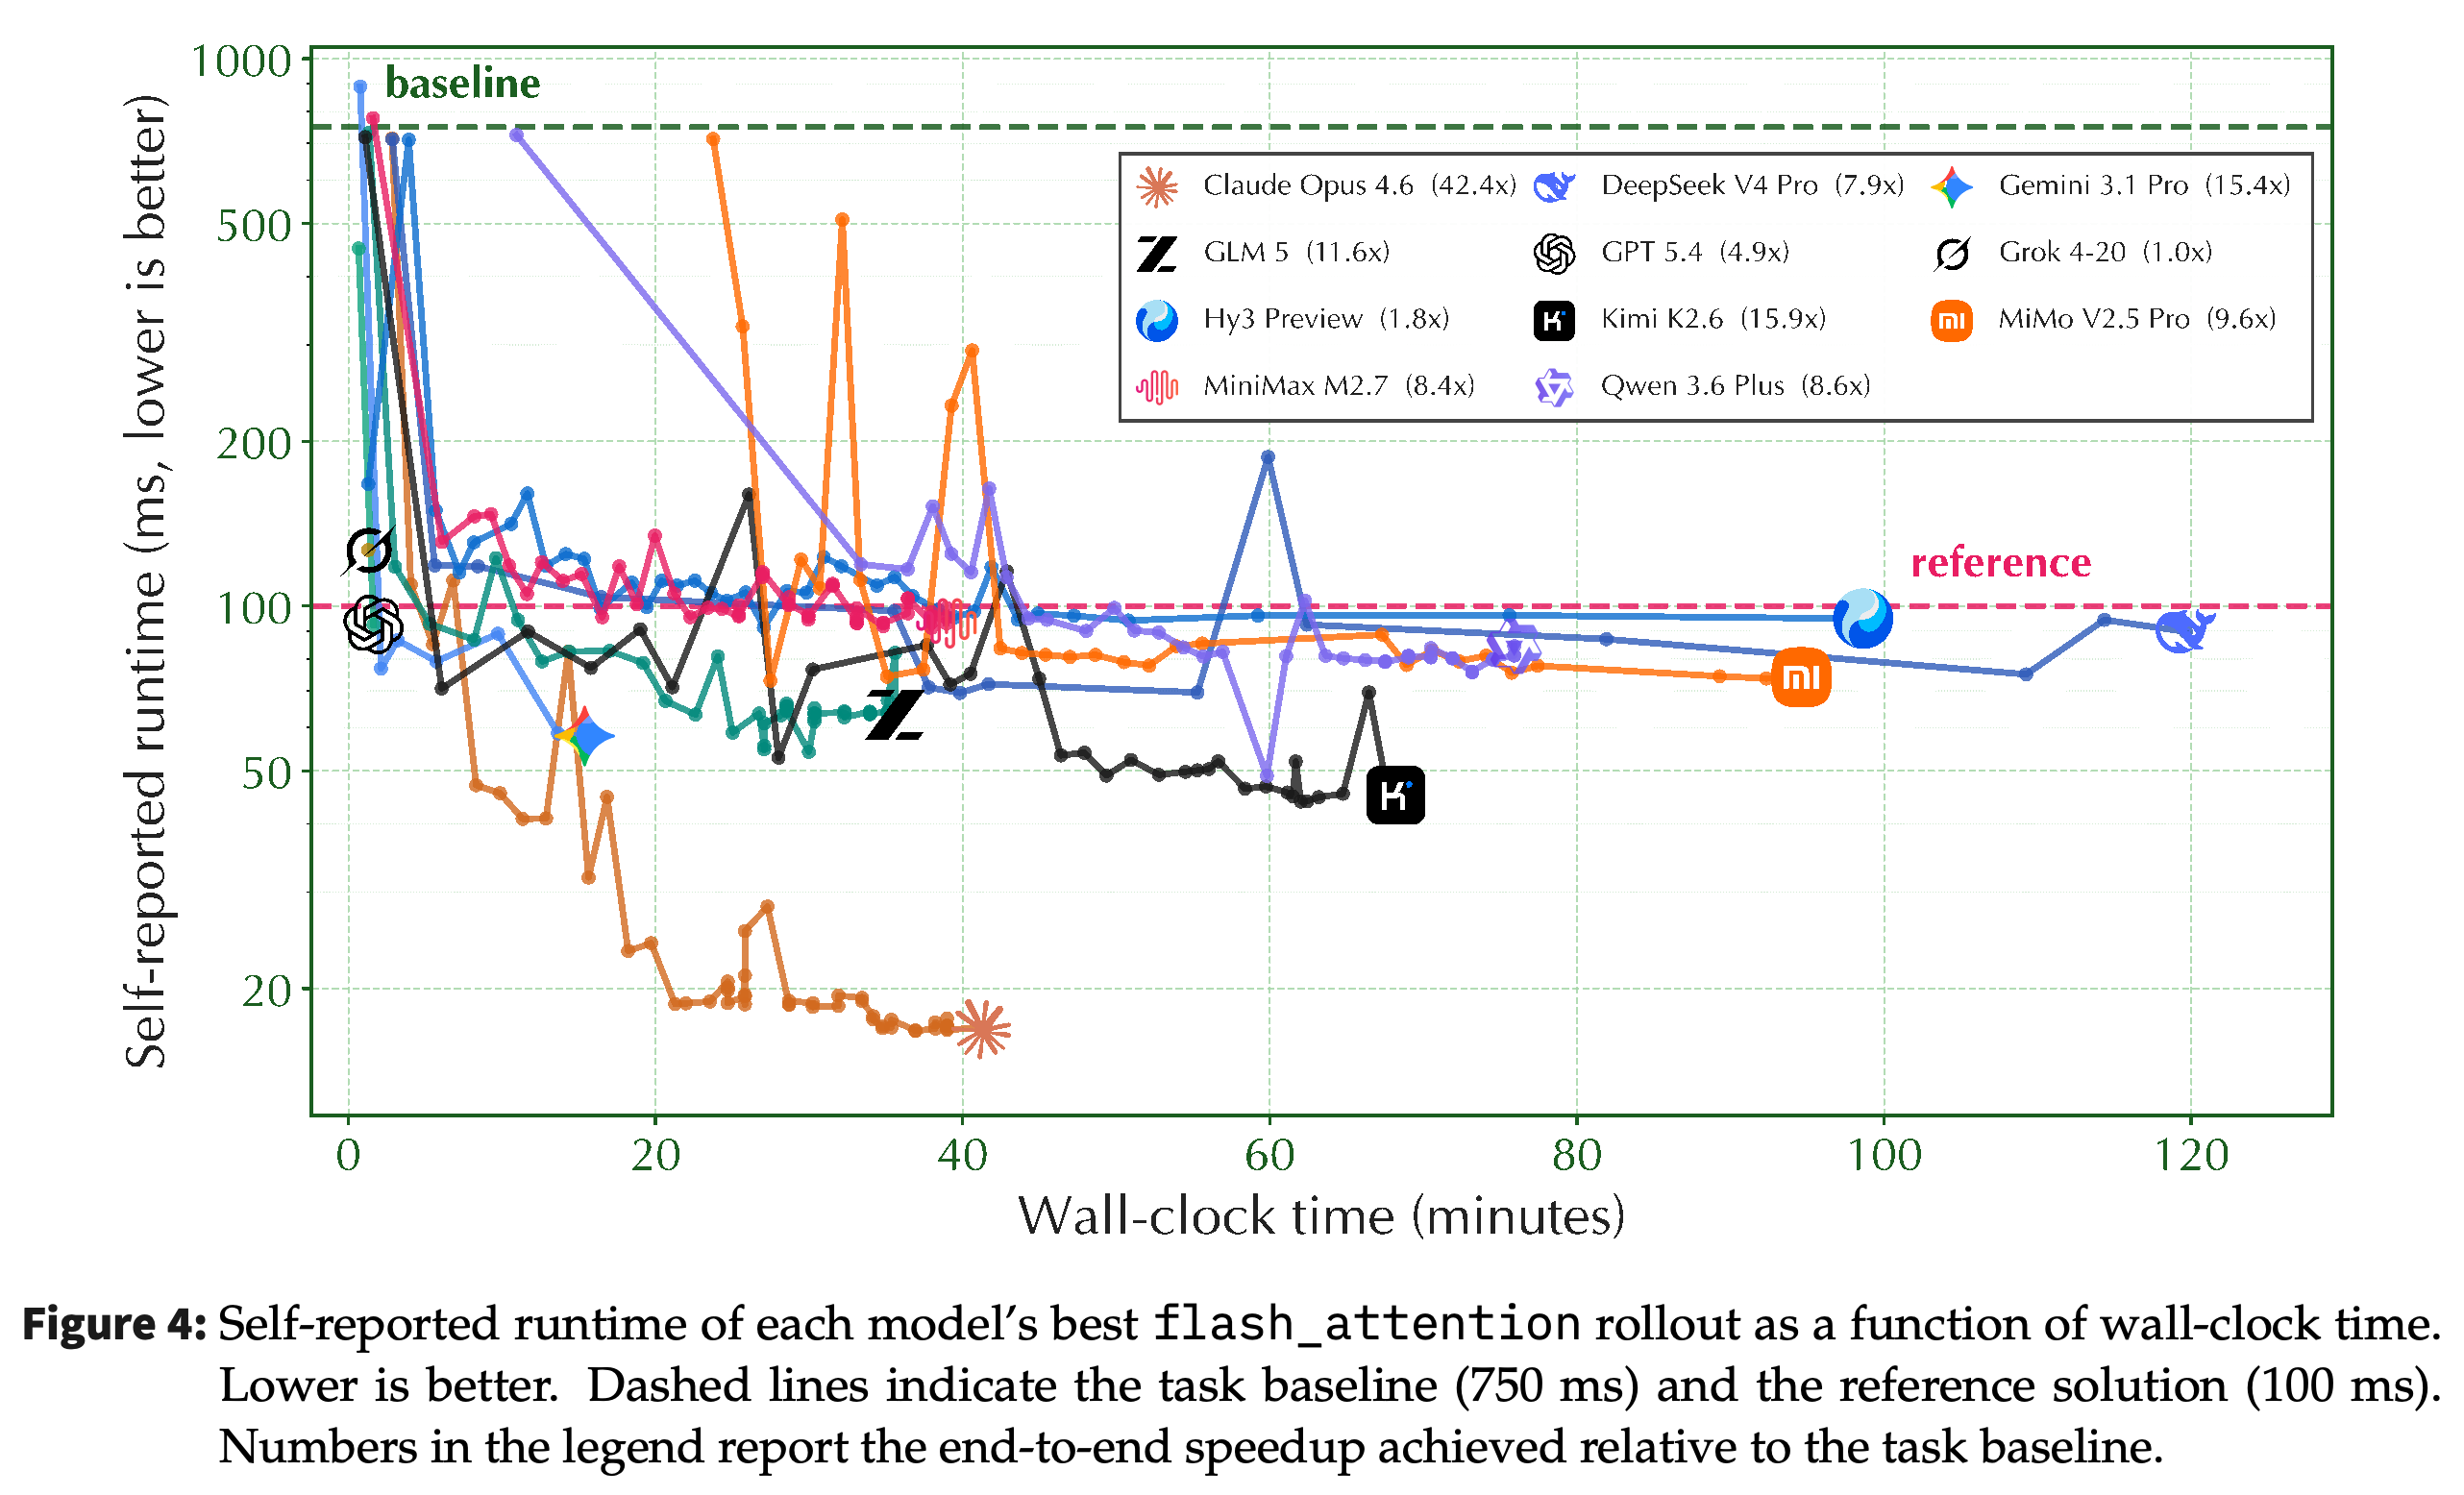
The flash_attention case study examines each model’s best rollout on a two-hour, single-threaded C attention-kernel task. Starting from approximately 750 ms, claude-opus-4.6 reaches 18 ms through 44 feedback-driven iterations over roughly 40 minutes, yielding the reported 42.4× speedup and exceeding the 100 ms reference.
- Figure 4 plots self-reported development runtimes, not a complete held-out score trajectory. It illustrates development behavior but does not independently verify every intermediate implementation.
- kimi-k2.6, gemini-3.1-pro, and glm-5 reach approximately 50–80 ms but plateau. Prolonged per-step reasoning delays experimentation for mimo-v2.5-pro and deepseek-v4-pro; the latter does not submit its best intermediate result.
- qwen-3.6-plus discards a stronger intermediate result after incorrectly judging it illegal, while grok-4-20 evaluates only once before stopping. The example separates iteration, retention of good candidates, timely submission, and self-verification.
claude-opus-4.6 continues improving well below the 100 ms reference, while several models plateau or stop earlier. The self-reported curves from each model’s best rollout illustrate development behavior rather than independently verified performance at every point.
4 Analysis
The analysis examines resource utilization, zero-score failure modes, harness effects, model-generation changes, and across-trial stability. Together, these diagnostics distinguish configurations that stop early from those that spend their budgets without submitting a valid improvement.
4.1 Cost Analysis
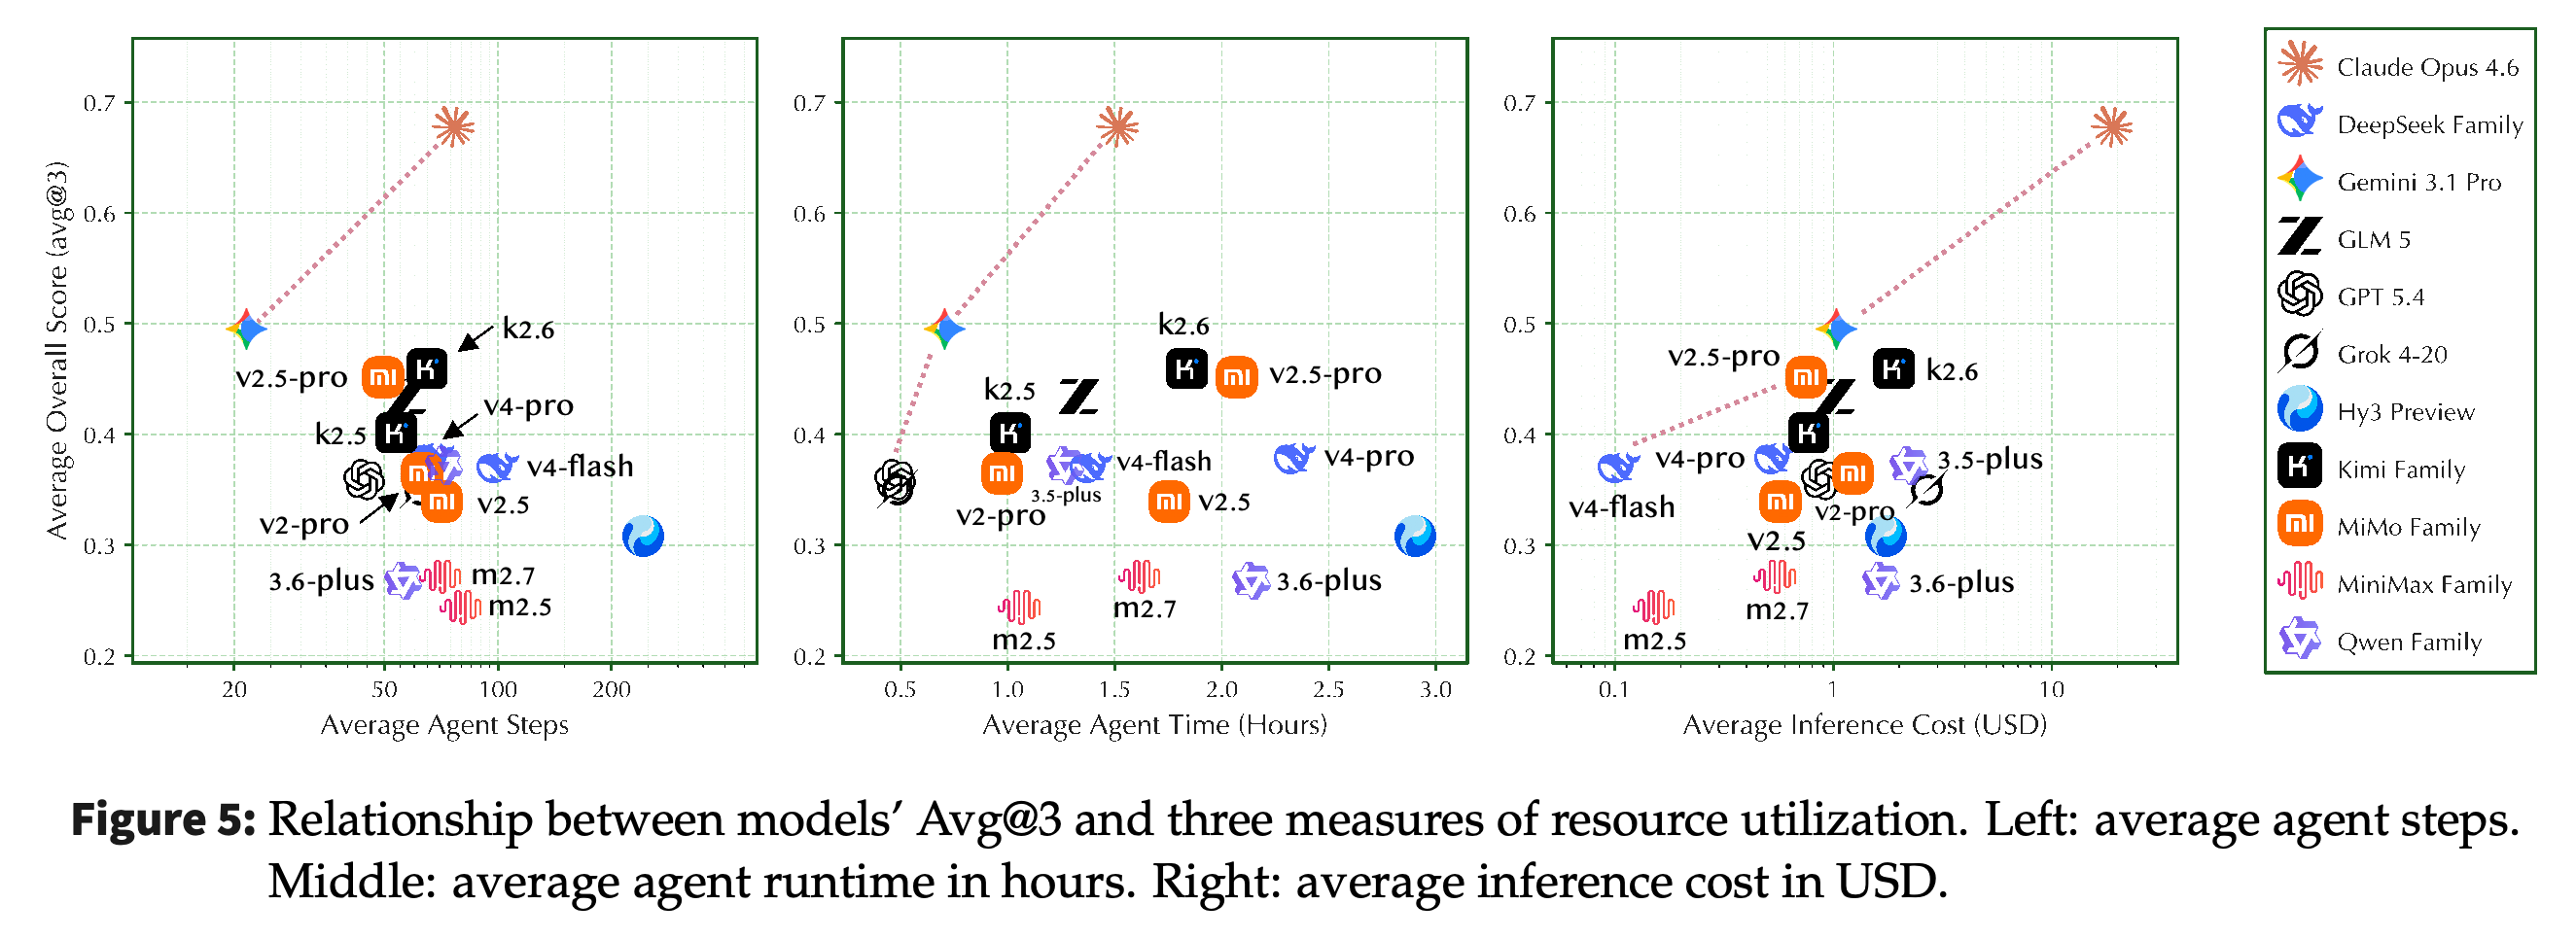
Figure 5 shows a positive association between Avg@3 and both agent steps and runtime. claude-opus-4.6 combines the highest score with substantial iteration, whereas gpt-5.4 and grok-4-20 occupy the short-runtime region consistent with early stopping.
- Higher scores generally accompany higher inference spending, but deepseek-v4-flash and mimo-v2.5-pro achieve competitive scores at lower inference costs.
- The monetary measure is inference cost, not a complete accounting of CPU/GPU execution and infrastructure costs.
- These cross-model associations do not establish that increasing runtime or step count alone improves outcomes; model quality, action efficiency, and harness behavior also vary.
The step and runtime panels associate greater iteration effort with higher scores, while showing substantial differences among models. The inference-cost panel identifies competitive lower-priced configurations but does not include the complete cost of executing the tasks or establish a causal benefit from greater spending.
4.2 Failure Case Analysis
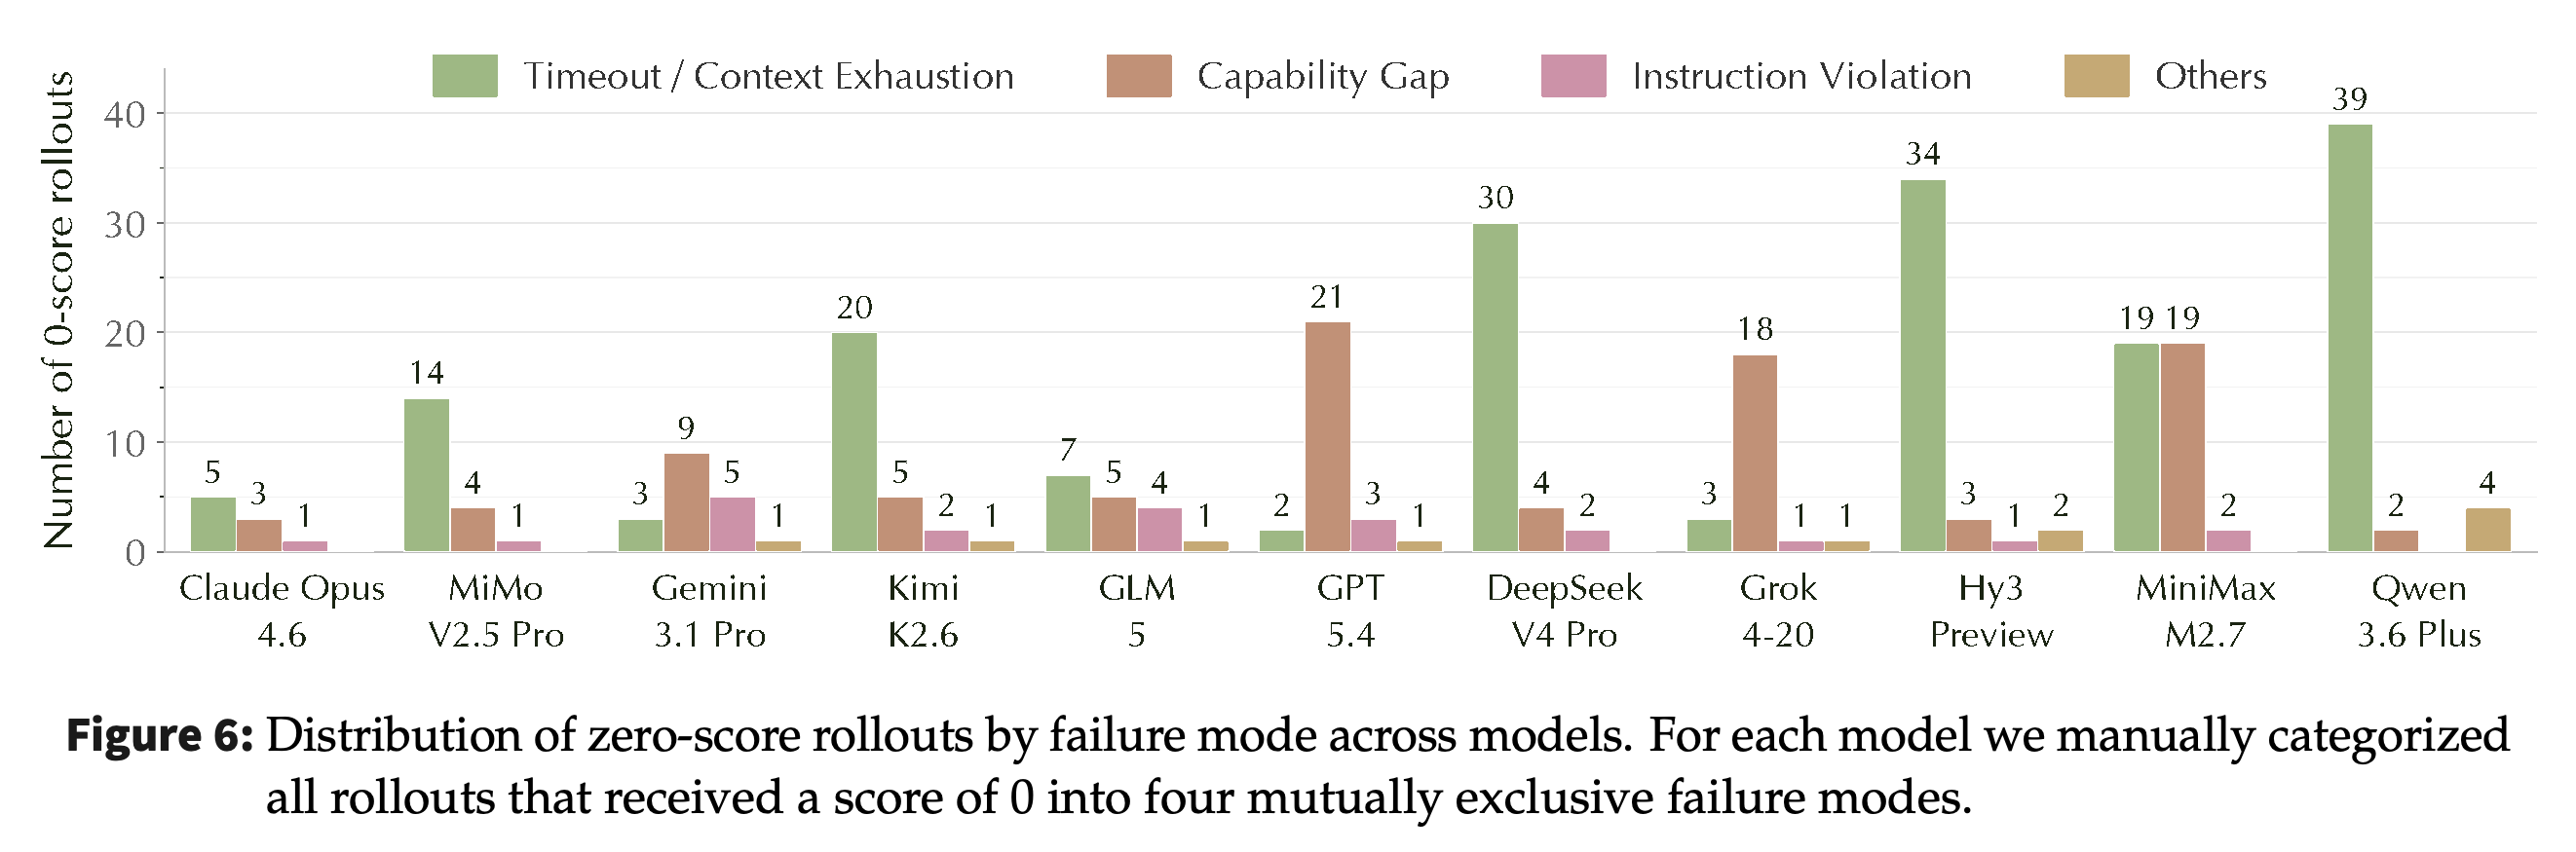
The authors manually classify all 302 zero-score rollouts from the 11 main models into four mutually exclusive categories: Timeout / Context Exhaustion, Capability Gap, Instruction Violation, and Others. The taxonomy distinguishes failure to submit from submitted artifacts that fail correctness, improvement thresholds, or explicit constraints.
- Timeout / Context Exhaustion includes AgentTimeoutError and individual LLM calls lasting 1,500+ seconds.
- Capability Gap includes incorrect outputs, insufficient improvement, early give-ups, and missing required artifacts such as LoRA adapters; it combines several behavioral and technical causes.
- Instruction Violation covers banned APIs, disallowed imports, protected-file edits, or forbidden workspace contents. Others includes server errors, malformed responses, and sandbox failures.
Failure inspection identifies two opposing time-allocation patterns: deepseek-v4-pro, hunyuan-3-preview, and qwen-3.6-plus frequently exhaust the budget, while gpt-5.4 and grok-4-20 often stop with substantial time remaining. Figure 6 shows 30, 34, and 39 timeout/context failures for the first group, respectively.
- All three kimi-k2.6 trials on toy_isa_opt time out after only 2–11 steps. On CUDA, 9 of 12 deepseek-v4-pro trials emit fewer than 10 actions before timeout.
- The extremely long reasoning-chain pattern appears only among the open-weight models in this evaluated roster; this does not establish a general open-versus-closed distinction.
- gemini-3.1-pro and glm-5 have 5 and 4 instruction-violation cases. ntt_butterfly_cuda accounts for half of all such violations, showing how constraint compliance can determine whether an implementation earns any score.
Timeout/context failures dominate deepseek-v4-pro, hunyuan-3-preview, and qwen-3.6-plus, whereas Capability Gap failures dominate gpt-5.4 and grok-4-20. The categories distinguish failures to reach submission from submitted artifacts that earn zero, motivating different remedies.
4.3 Harness Ablation Analysis
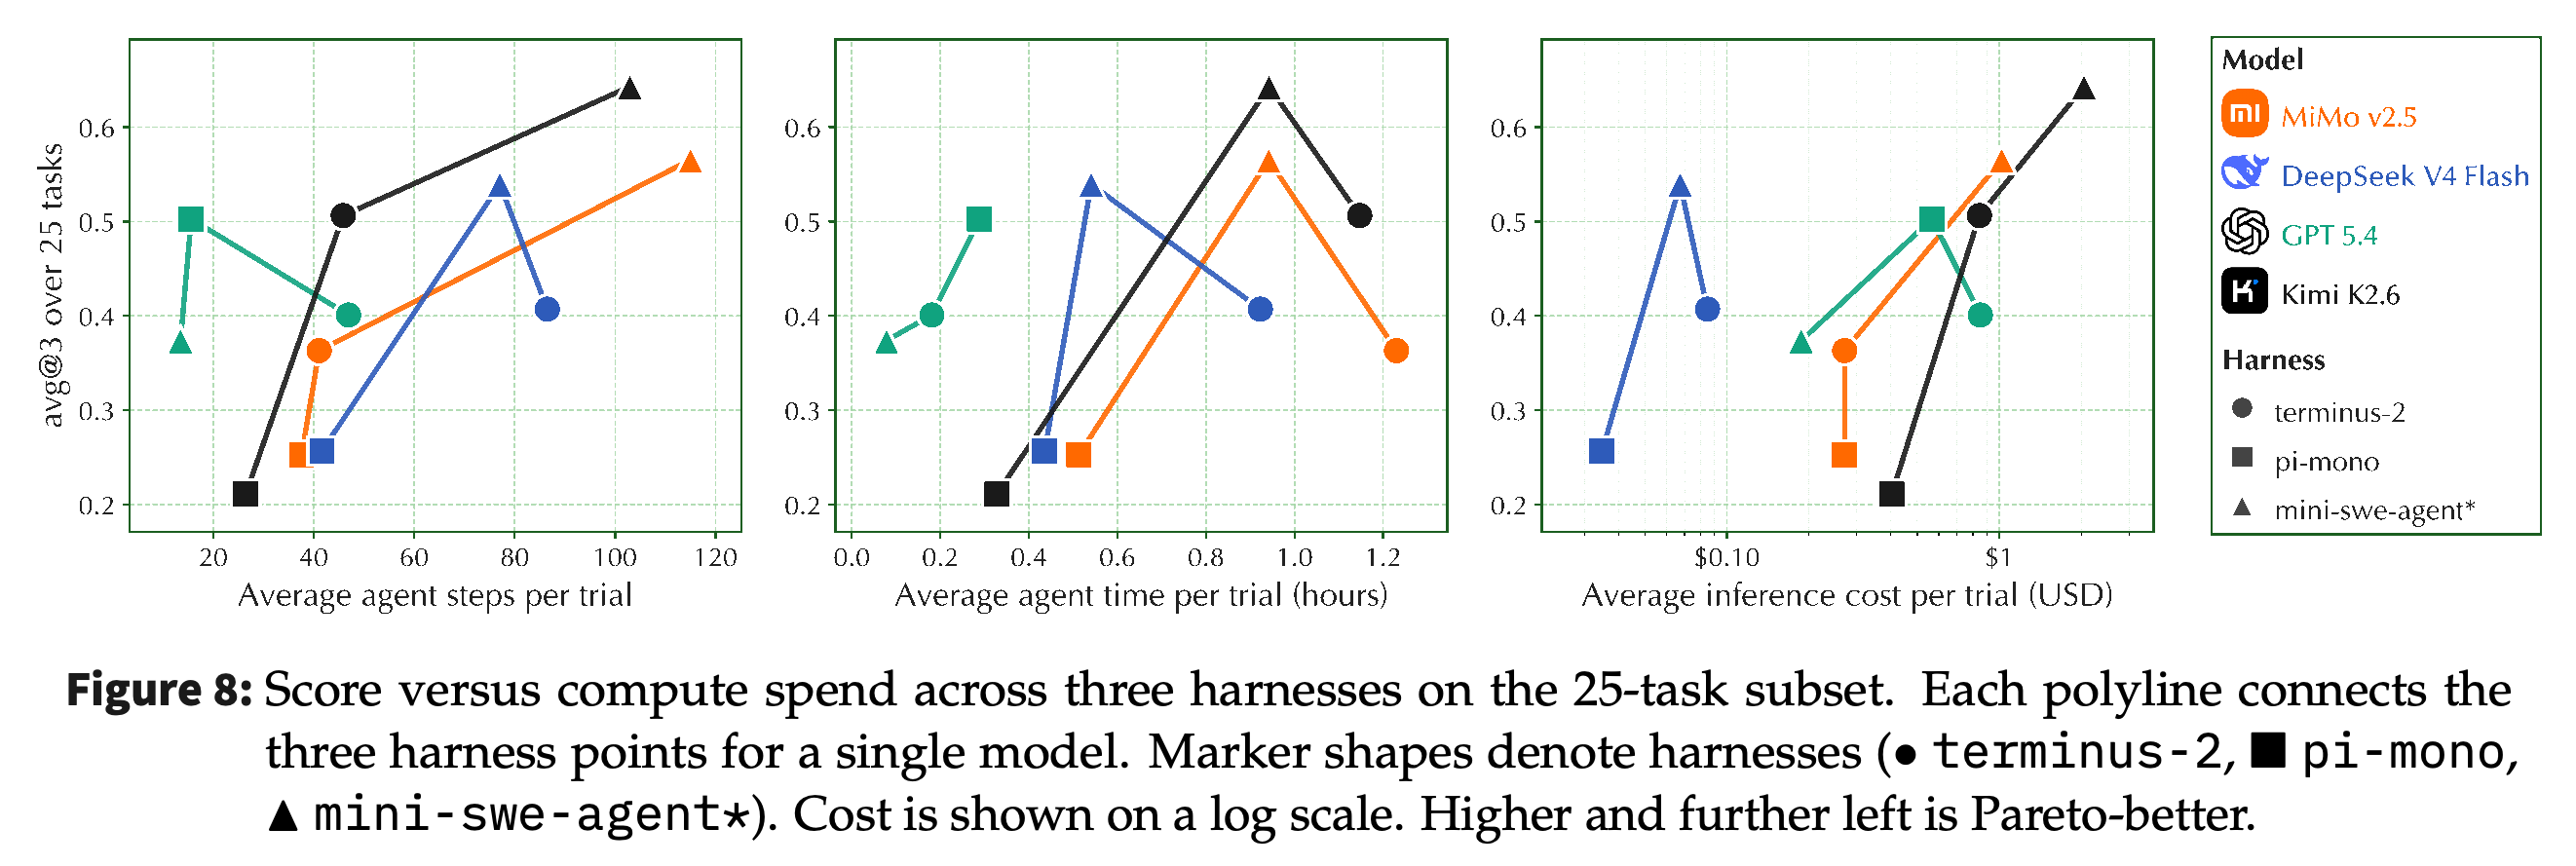
The harness ablation re-evaluates mimo-v2.5, deepseek-v4-flash, gpt-5.4, and kimi-k2.6 on 25 CPU tasks from system_optimization and puzzle_and_challenge. It compares terminus-2 with pi-mono and mini-swe-agent*, where the asterisk denotes a custom optimization-oriented prompt encouraging continued measurement, revision, and verified submission.
- The modified prompt encourages checking the baseline, retaining improvements, reverting regressions, and avoiding submission after the first successful attempt. This condition changes prompting as well as the harness, so it does not isolate interface effects.
- The subset excludes all Model Development and CUDA tasks. Its rankings and costs should not replace the full 36-task leaderboard.
Figure 7 shows large, model-specific harness effects. Across terminus-2, pi-mono, and mini-swe-agent*, the means are 0.36/0.25/0.57 for mimo-v2.5, 0.41/0.26/0.54 for deepseek-v4-flash, 0.40/0.50/0.37 for gpt-5.4, and 0.51/0.21/0.64 for kimi-k2.6.
- kimi-k2.6’s 0.43 difference between pi-mono and mini-swe-agent* exceeds many between-model gaps in the main leaderboard.
- mini-swe-agent* benefits three of the four models relative to terminus-2, whereas gpt-5.4 performs best under pi-mono. No harness is uniformly superior.
- The crossing mean lines and task-level variation support reporting performance as conditional on harness configuration.
The mean lines cross rather than preserve a universal harness ranking. kimi-k2.6 varies from 0.21 under pi-mono to 0.64 under mini-swe-agent*, while gpt-5.4 performs best under pi-mono, demonstrating model-specific sensitivity to harness and prompt configuration.
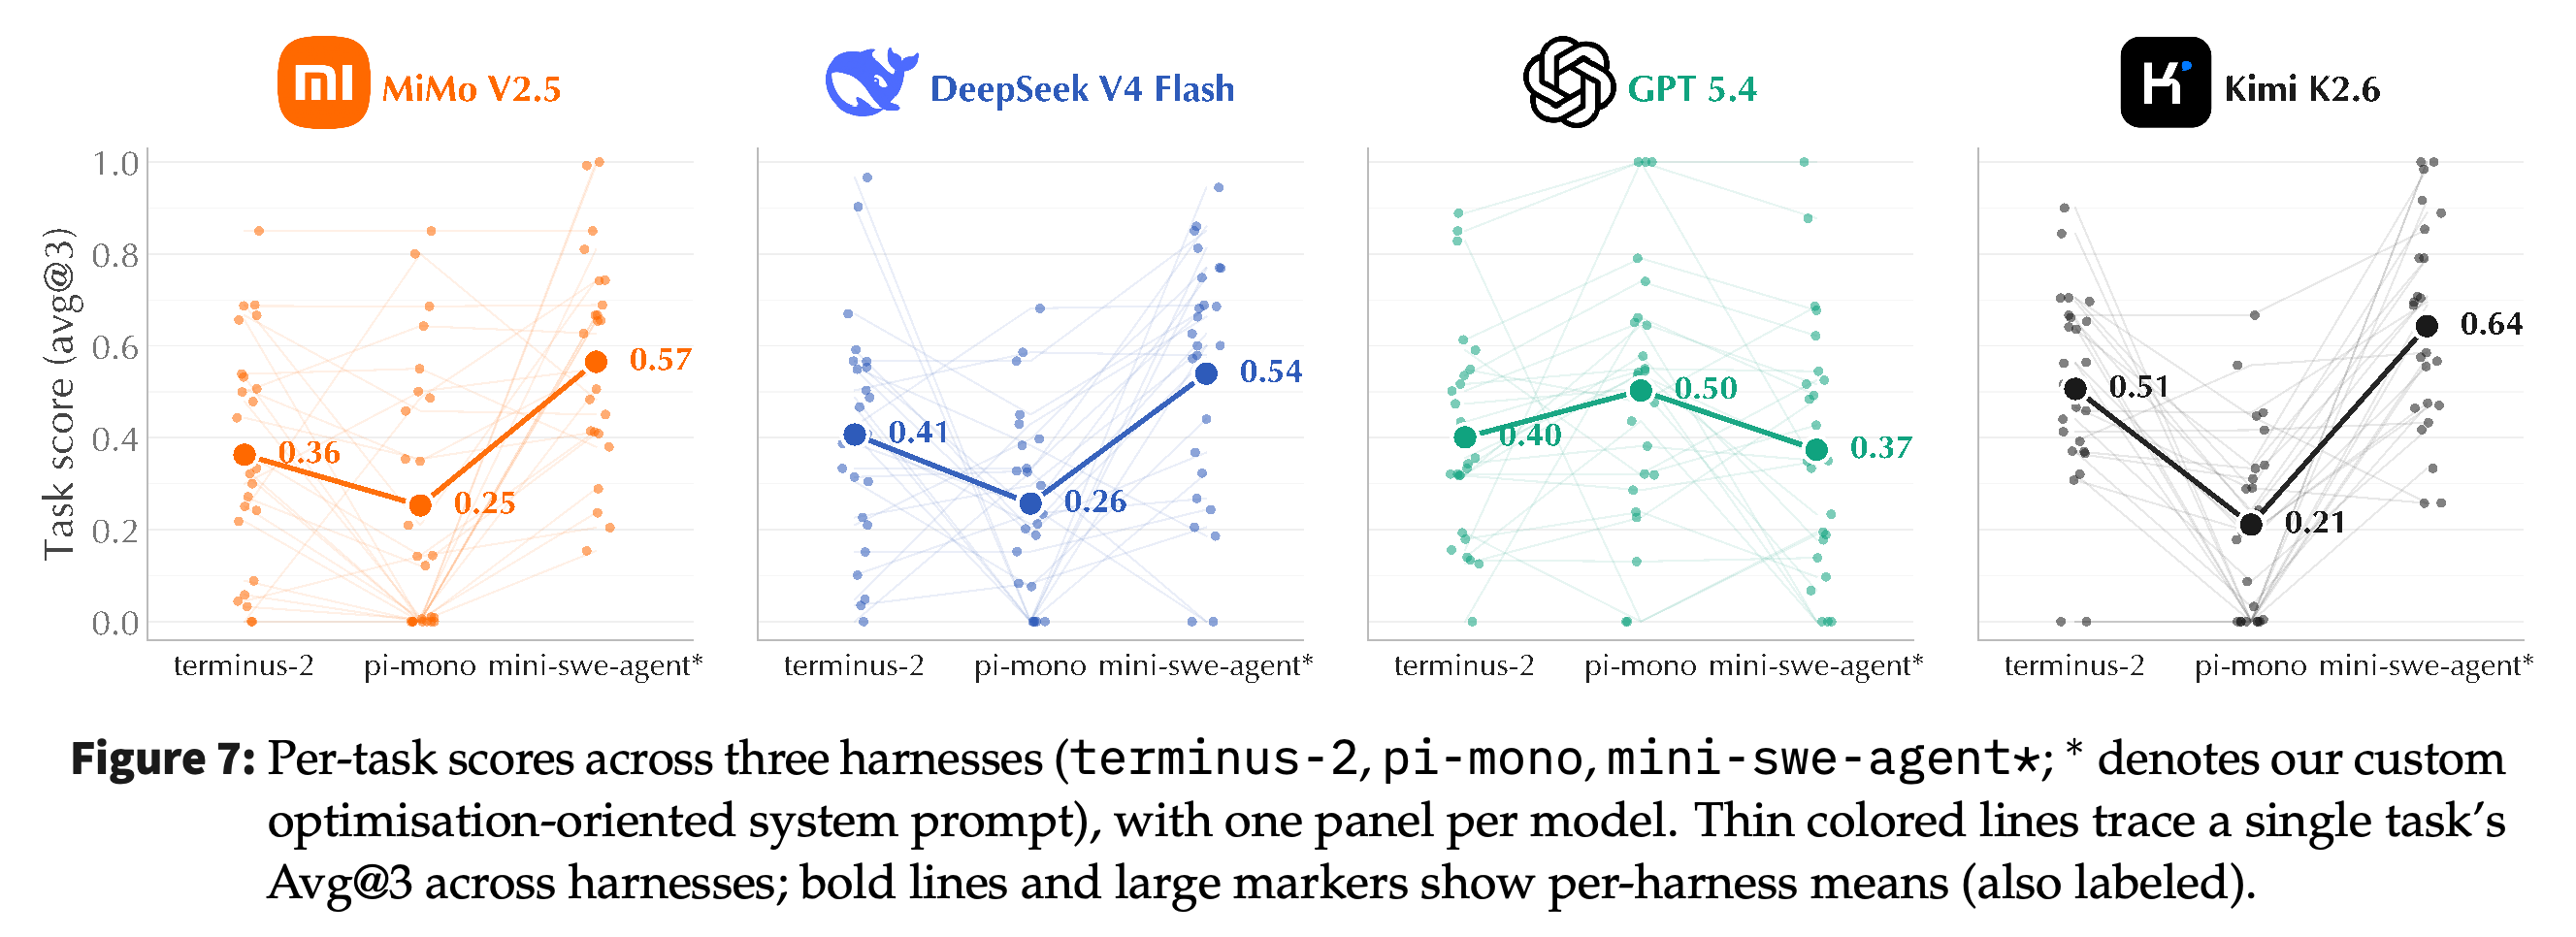
Figure 8 shows that harness choice also changes spending and the score–cost trade-off. For kimi-k2.6, inference cost increases from $0.40/trial under pi-mono to $2.05/trial under mini-swe-agent*, while deepseek-v4-flash reaches a mean score of 0.54 under mini-swe-agent* at approximately $0.07/trial.
- The cost comparison is specific to the tested API prices and CPU-task subset and does not include the full execution cost.
- The paper reports changes of +0.13 and +0.20 for deepseek-v4-flash and mimo-v2.5 relative to terminus-2, and −0.03 for gpt-5.4. Figure 7’s displayed rounded means instead yield a 0.21 difference for mimo-v2.5.
- The authors interpret the gains as recovery through trial and error, but the ablation does not independently measure one-shot reasoning strength or isolate the contribution of persistence.
Each model’s connected configurations show how score changes accompany changes in action count, runtime, and inference spending. The cost panel supports comparisons of tested model–harness configurations rather than rankings based solely on maximum score.
4.4 More Analysis
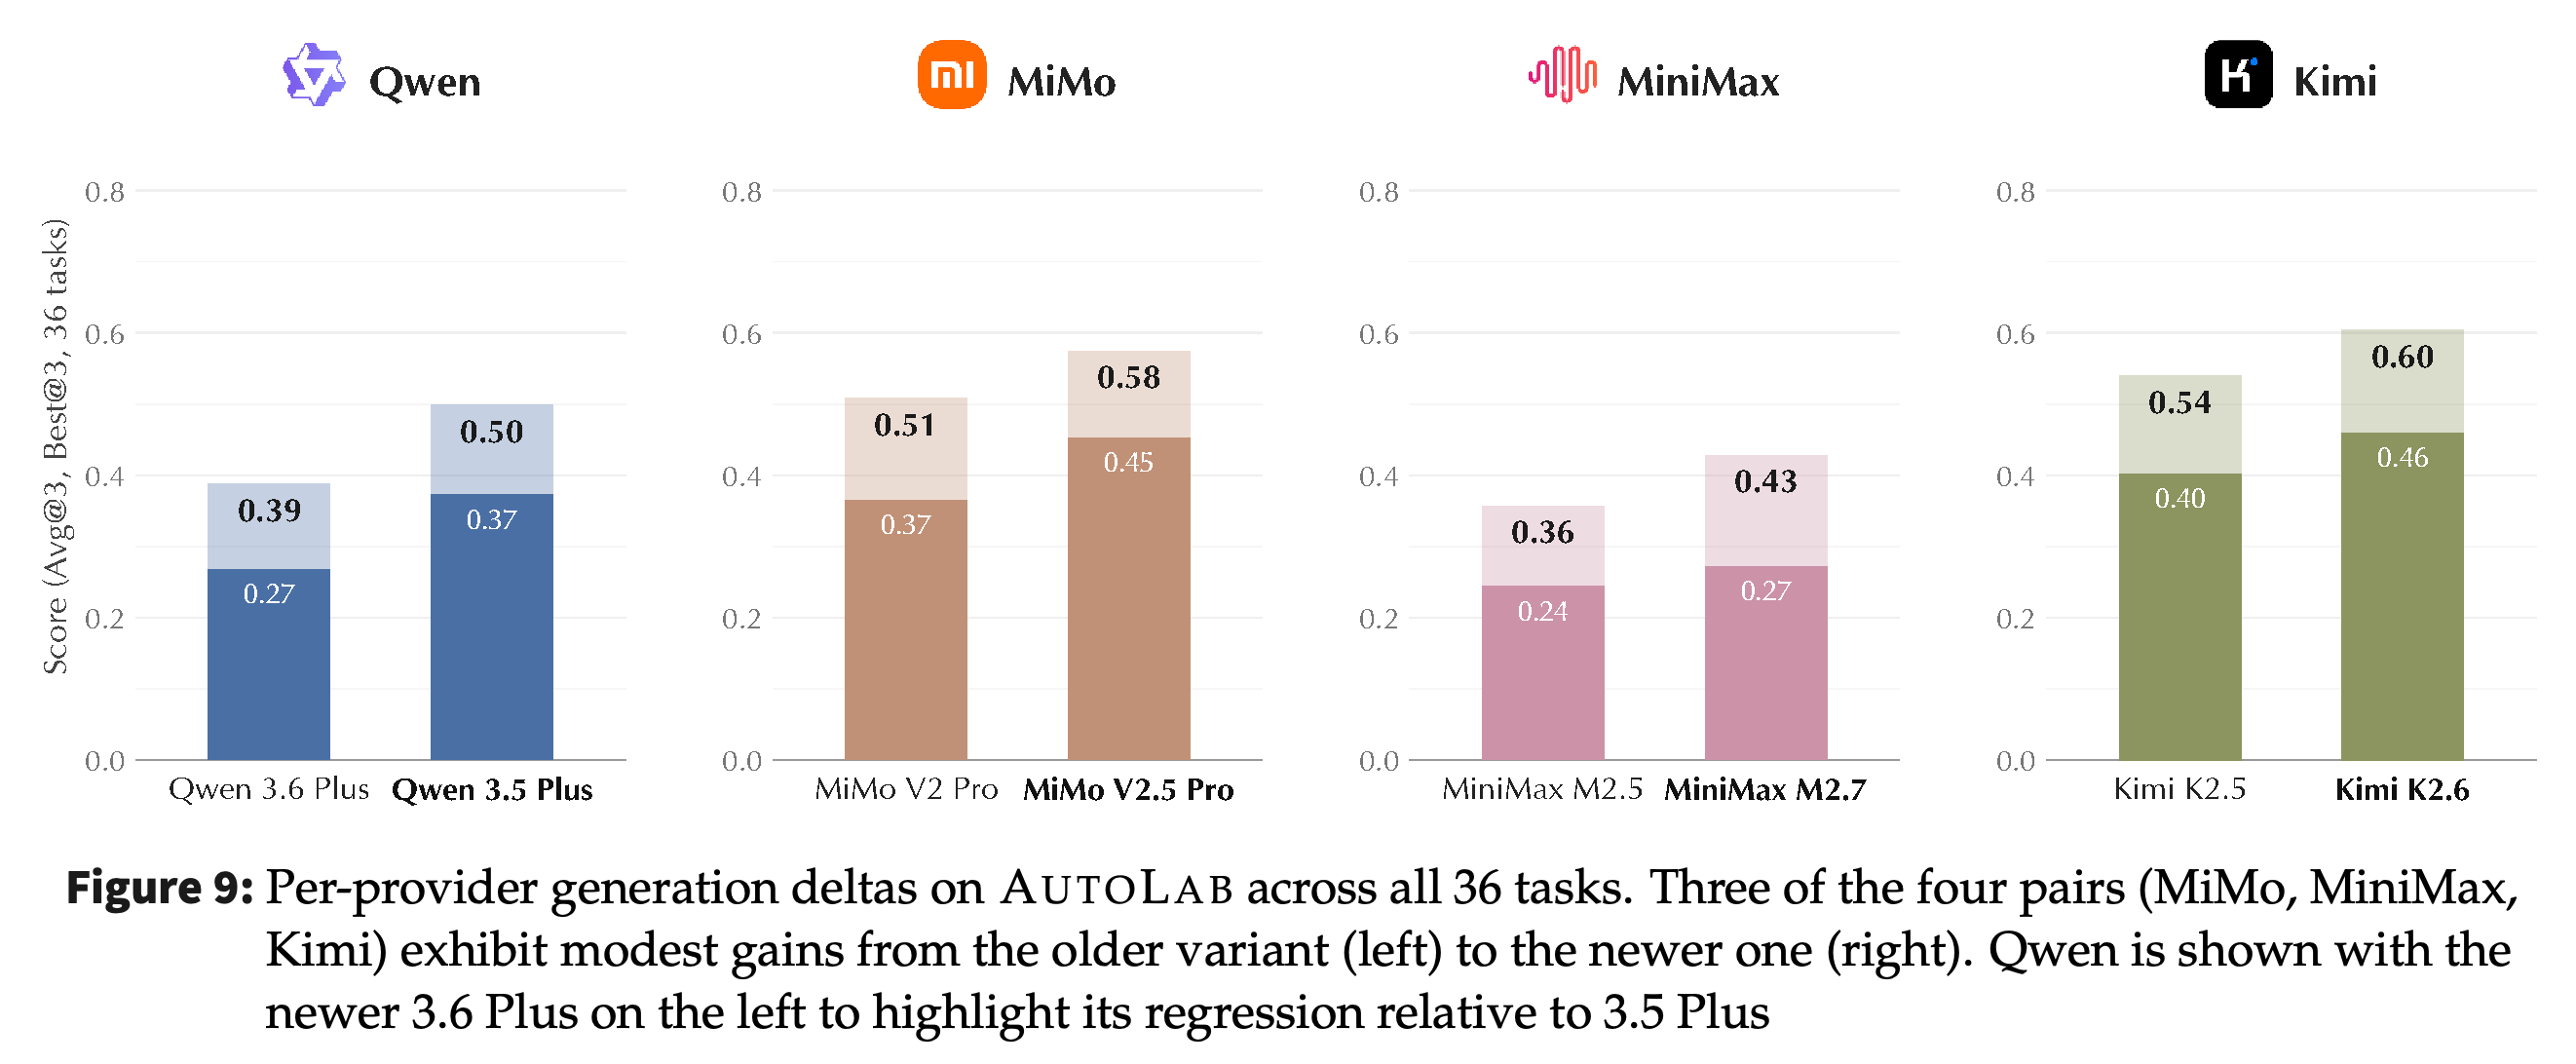
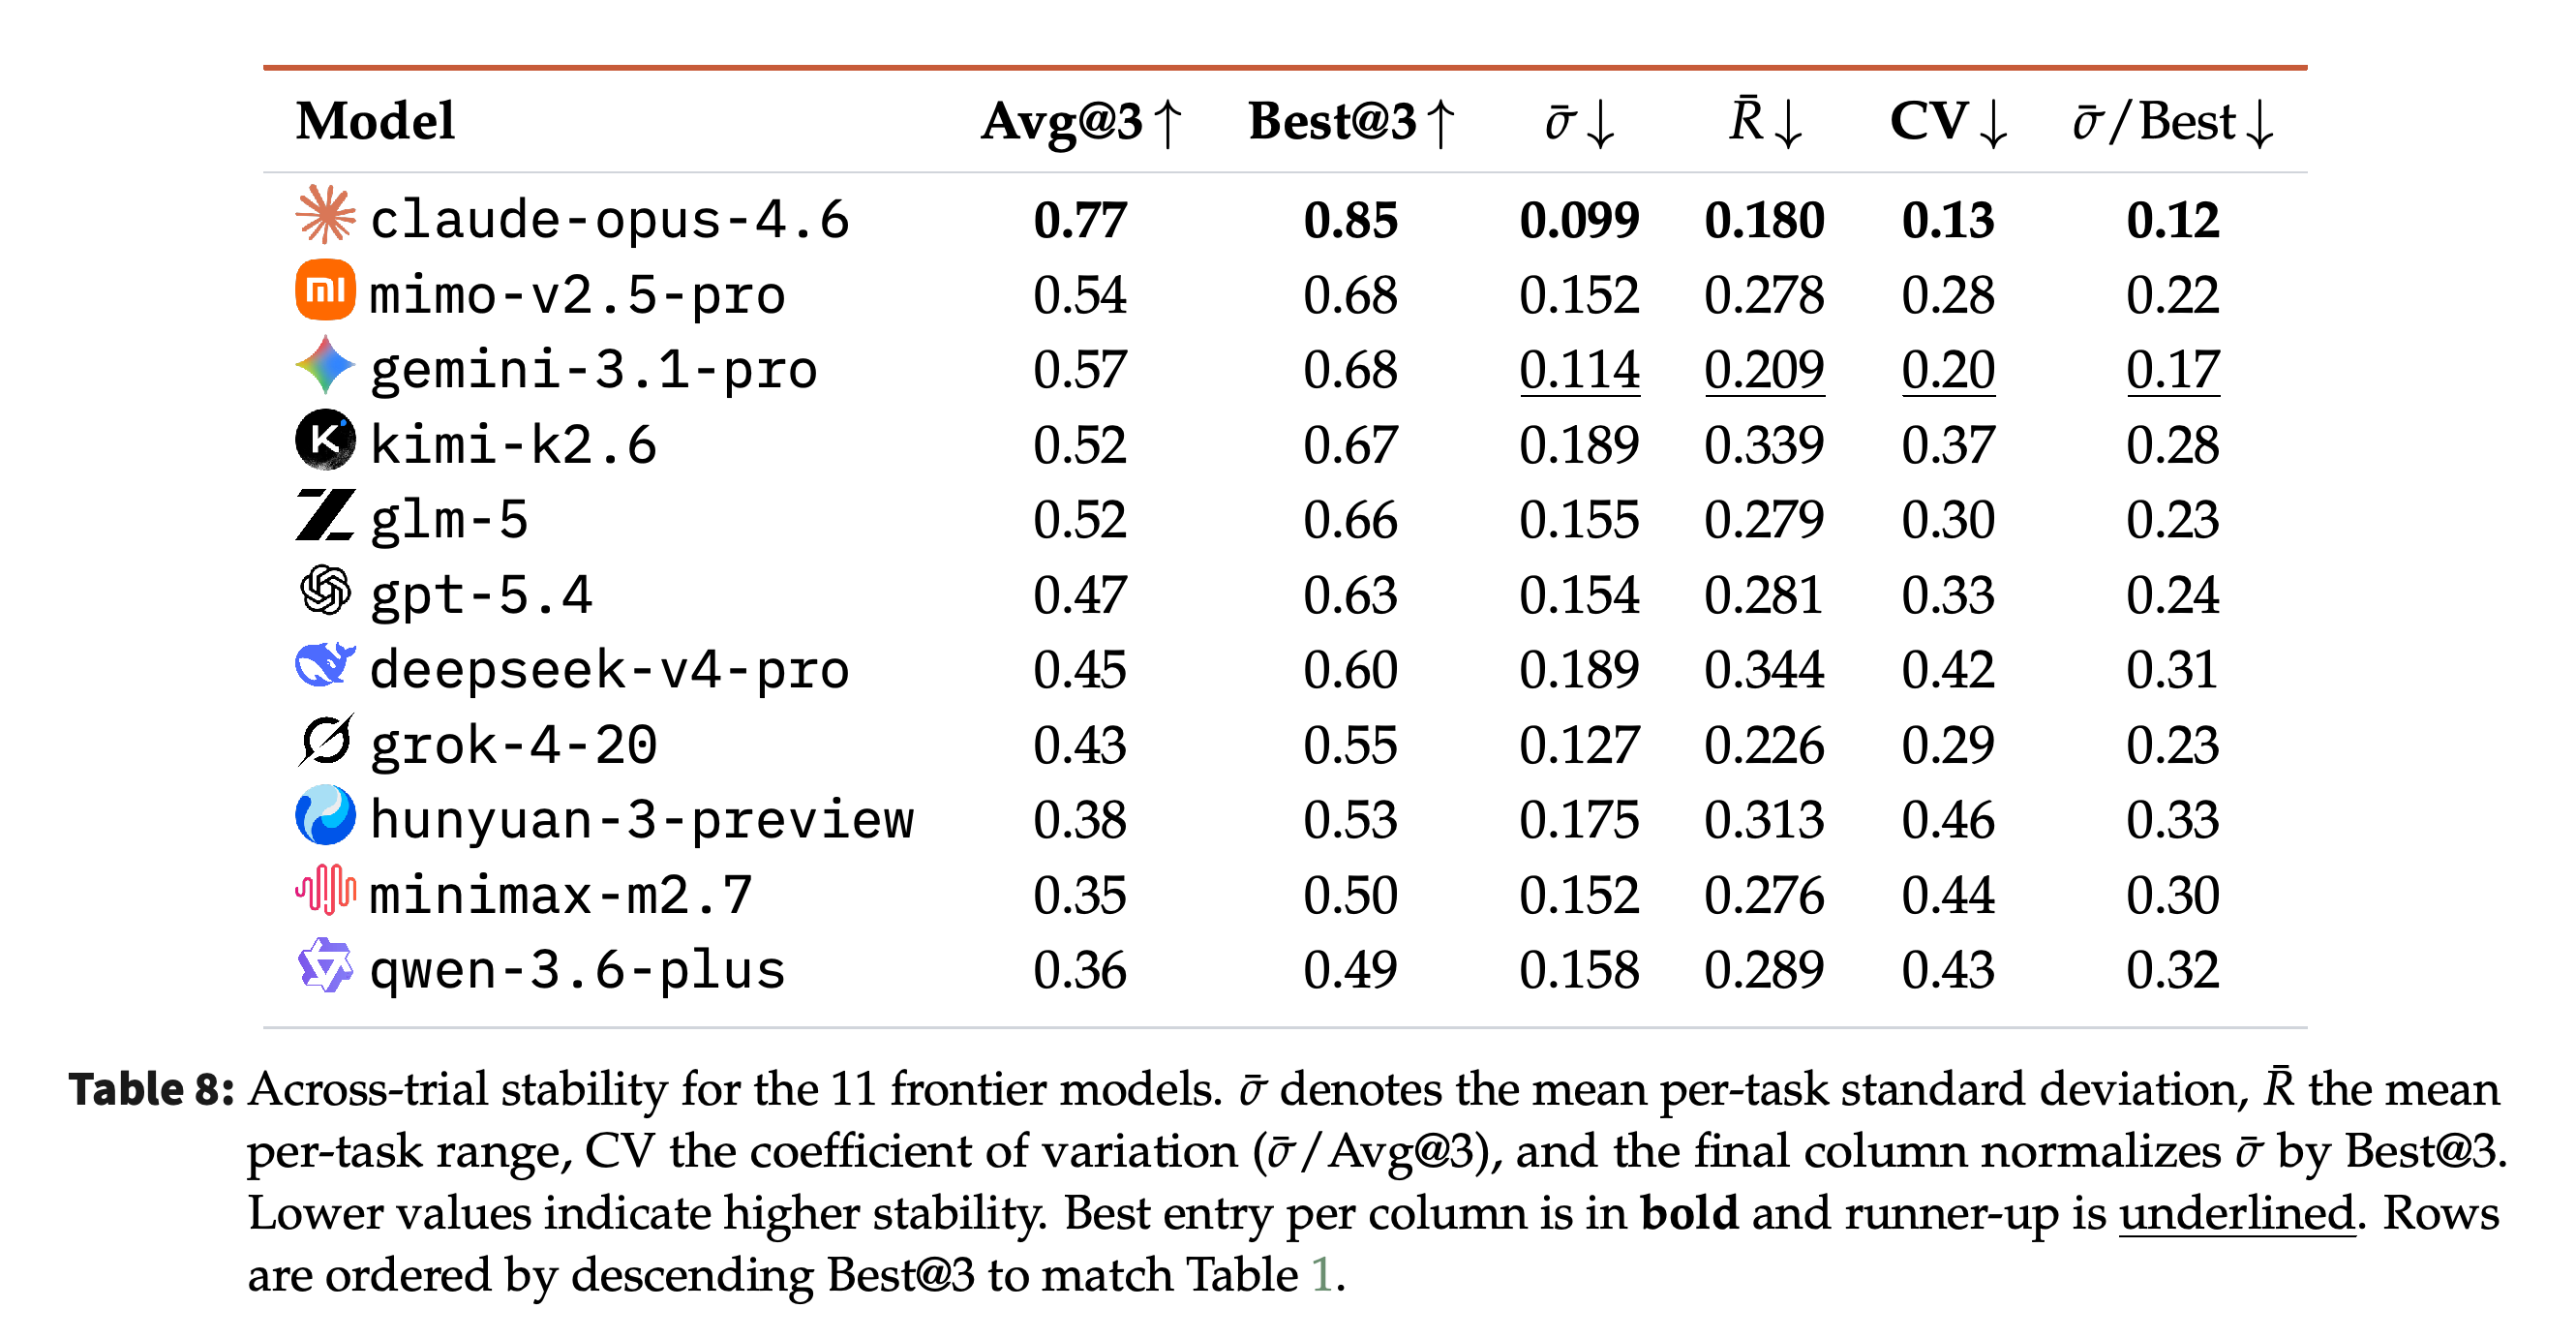
The additional analyses compare model generations under terminus-2 and quantify three-trial dispersion. Figure 9 shows overall gains for MiMo, MiniMax, and Kimi, but regression for Qwen; Table 8 lists claude-opus-4.6’s mean per-task standard deviation as 0.099, the lowest among its rows.
- The paper reports that Best@3 − Avg@3 increases with dispersion, with Pearson r = 0.84. Best-run selection therefore rewards variable configurations more than stable ones.
- Appendix C contains inconsistent aggregate scores and explanatory examples. Its stability values should be kept distinct from the main leaderboard pending clarification.
The bars show gains for MiMo, MiniMax, and Kimi but a decline for Qwen under the default harness; Qwen’s newer variant is placed on the left, unlike the other pairs. The displayed rounded Qwen gaps differ slightly from the accompanying prose, which also gives a category score inconsistent with Table 1.
claude-opus-4.6 has the lowest listed mean per-task standard deviation, while kimi-k2.6 and deepseek-v4-pro share the highest value, 0.189. The table’s Avg@3 and Best@3 aggregates differ from the main leaderboard without an explained scope change, so they should not be treated as interchangeable.
5 Related Work
The paper positions AUTOLAB between static coding benchmarks, interactive agent benchmarks, and multi-hour ML or engineering evaluations. Its contribution is a common protocol spanning four optimization domains, with continuous scores, anti-hacking safeguards, a shared default agent, and trajectory analysis.
- HumanEval, LiveCodeBench, BigCodeBench, and SWE-bench motivate the distinction between producing a correct artifact and improving an empirical metric over time; GAIA, AgentBench, and Terminal-Bench extend interactive evaluation.
- MLE-Bench, RE-Bench, PaperBench, PostTrainBench, AIRS-Bench, KernelBench, FrontierCS, and Frontier-Eng provide closer long-horizon precedents but emphasize narrower domains.
- SWE-agent, OpenHands, Aider, The AI Scientist, SWE-Gym, R2E-Gym, and MLGym provide related agent frameworks or environments. AlphaEvolve and AutoResearch illustrate empirical optimization with bespoke systems, whereas AUTOLAB uses a shared default harness for comparison.
6 Conclusion
AUTOLAB documents substantial variation in sustained engineering optimization under standardized task and default-harness conditions. The authors emphasize persistent empirical iteration, time awareness, and harness design alongside coding capability, and release the benchmark, harness, and task artifacts.
Limitations and Broader Impact
The paper explicitly limits AUTOLAB to executable systems and machine-learning workflows, not scientific discovery in its broadest sense. Multi-hour execution, API behavior, GPU workloads, and the surrounding stack affect outcomes, motivating joint reporting of trajectory behavior, resource consumption, and final scores.
- The 36 tasks have unequal category sizes, including only 4 CUDA tasks, so category rankings and the overall task mean represent different coverage.
- Three trials capture some stochastic variability but provide limited precision for reliability estimates.
- These results diagnose the tested model–agent configurations. They neither isolate persistence as a causal factor nor directly measure open-ended scientific novelty.
Appendix
- A Task Specifications and A.1 Task Descriptions provide implementation languages, difficulty tiers, and constraints for all 36 tasks: tier 1 denotes textbook-classic optimization, and tier 2 denotes bespoke, domain-specific, or research-style work. System Optimization (15 tasks). begins with aes128_ctr, which accelerates single-threaded encryption of 256 MiB using AES-NI and SIMD; agent_tool_routing, which replaces full-scan lexical routing with a stdlib Python index while satisfying MRR@10 ≥ 0.82 and Recall@10 ≥ 0.94; and bm25_search_go, which optimizes indexed query ranking and goroutine overhead. bvh_raytracer constructs a cache-friendly BVH for a 4,096-triangle scene and 638×638 rays; concurrent_kv_wal reduces contention and I/O for 4 goroutines while preserving consistency and durability; fft_rust optimizes a 32,768-length real-signal FFT; and flash_attention tiles attention with n = 4096 and d = 64 without allocating the full attention matrix. gaussian_blur applies five sequential 17×17 blurs to a 4096×4096 image; hash_join joins 20K and 5M rows; levenshtein_distance computes exact distances for 1,000,000 string pairs of lengths 16–64 using bit-parallel optimization; and radix_sort targets memory bandwidth when sorting 50M uint32 values. regex_engine builds pure-Rust pattern-matching structures for 100K haystacks; sha256_throughput hashes 512 MiB with intrinsics; sstable_compaction_rs optimizes multi-way merging, prefix compression, and block boundaries; and z_order_range_scan uses Morton ordering and skip-step scans for rectangular counts in safe stdlib Rust without threading or unsafe.
- Puzzle and Challenge (10 tasks). covers adaptive_compression, which minimizes bits-per-byte across 9 hidden sequence families through valid adaptive context mixing, and adversarial_splay, which constructs 4,096 accesses to maximize splay-tree rotations. discover_sorting reduces a 16-input network from an 80-comparator baseline toward a 60-comparator reference, verified over all 65,536 binary inputs; fredkin_sort_network reduces gates in a stable reversible sorting circuit while restoring scratch wires to zero. resnet_bit_flip minimizes float32 bit edits that drive CIFAR-10 accuracy below 12%, subject to a weight-magnitude cap and finite outputs; safety_router minimizes MLP parameters while maintaining accuracy ≥ 0.64, unsafe recall ≥ 0.66, and safe recall ≥ 0.57; and smallest_game_player learns compact Connect-3 policies with hidden-test accuracy ≥ 95% without explicit minimax/search or hardcoded lookup tables. stack_machine_golf minimizes executed instructions for a 256-element dot product on a register-less stack VM; toy_isa_opt minimizes simulated cycles for a 512-element dot product by hiding load and multiplication hazards; and vliw_scheduler schedules 3,000 operations into 3-slot bundles with 1/3/4-cycle latencies using dependence-aware priorities.
- Model Development (7 tasks). includes data_select_ifeval, which selects up to 5,000 examples from a 50,000-example, 19-source pool for Qwen2.5-3B-Instruct LoRA training on H100 within 8 hours without direct IFEval inspection. flux2_klein_lora trains FLUX.2 klein 9B LoRA on 15 images using L40S within 4 hours, combining image, structural, and text-alignment metrics while repairing the shipped OOM configuration; grpo_multisource adapts Qwen2.5-VL-7B with Geometry3K, MathVision, and ChartQA on L40S within 8 hours to improve MathVista while retaining general VQA performance ≥ 0.9 relative to the base model. llm_online_serving changes only the serving engine for gpt-oss-20b on H100 within 2 hours, optimizing a 50/50 throughput/inverse-completion-time composite over 96 requests while kernels and the model remain frozen. moving_mnist_world_model trains from 8,000 clips on H100 within 4 hours and evaluates autoregressive 10-step PSNR; multilingual_ocr fine-tunes DeepSeek-OCR on 9,000 Persian/Bengali images using L40S within 8 hours and evaluates character error rate on 400 held-out images; and scaling_law chooses architecture and training allocation for WikiText-103 pretraining on H100 within 12 hours with seq_length=1024.
- CUDA (4 tasks). targets a single H100. huffman_canonical_decode_cuda decodes 2,048 streams with 65,536-byte payloads using lookup tables and warp cooperation without Thrust, CUB, or compression libraries; icp_correspondence_step_cuda processes point clouds with N=200,000 and M=500,000 using a prebuilt KD-tree, distance gating, and covariance reduction without spatial-index libraries. msm_pippenger_bls12_381_cuda computes multi-scalar multiplication over N=262,144 points using Pippenger buckets and Montgomery arithmetic without third-party field/ECC libraries or in-kernel allocations. ntt_butterfly_cuda computes a bit-exact, natural-order transform with batch=256 and n=65,536 over the Goldilocks field (p=2^{64}-2^{32}+1), using twiddle precomputation, tiled butterflies, and specialized reduction without FFT libraries.
- A.2 Per-Task Scoring Anchors and Gates documents metric directions, anchors, and feasibility checks; failed correctness checks yield zero. All system and CUDA tasks use log-stretch scoring with a must-beat-baseline gate, while adaptive_compression and adversarial_splay use log-stretch with 5% and 1% gates. Other puzzle tasks and all model-development tasks use anchored linear scoring, except that smallest_game_player and safety_router use (s(x)=\operatorname{clip}\left(\frac{m_B-m(x)}{m_B},0,1\right)), equivalent to an implicit zero-parameter reference anchor rather than their documented strong solutions. Tables 2–4 distinguish system runtimes in seconds from CUDA runtimes in milliseconds and list quality gates including VQA retention ≥ 0.9, improvement over no-LoRA quality, and serving correctness.
- The appendix’s scoring specifications contain discrepancies relevant to reproduction. resnet_bit_flip is described with a 95-flip baseline and 40-flip reference, but Table 3 lists anchors of 81 and 1; scaling_law is described with perplexities of approximately 95 and 23, while Table 4 lists 25 and 18. flux2_klein_lora ships an OOM-prone configuration despite the general correct-baseline framing, and Table 4 distinguishes its approximately 0.49 no-LoRA anchor from the configuration’s 0.0 crash floor.
- B More on Experiments and B.1 More on Experimental Setups identify developing organizations and API providers in Table 5: the main set uses TokenRouter, Azure AI Foundry, MiniMax, Cloudflare, OpenRouter, xAI, and Xiaomi, with providers also specified for each ablation model. B.2 Detailed Experimental Results supplies per-task Avg@3 and Best@3 in Tables 6 and 7, grouped by domain. claude-opus-4.6 scores 0.00 on both fft_rust and llm_online_serving, while minimax-m2.7 leads grpo_multisource Avg@3 at 0.93. These outcomes show that leading every category on average does not imply leading or succeeding on every task.
- C More on Analysis and C.1 Model Generations compare four within-provider pairs under terminus-2. Figure 9’s displayed Avg@3 values increase from 0.37 to 0.45 for MiMo, 0.24 to 0.27 for MiniMax, and 0.40 to 0.46 for Kimi, while Qwen decreases from 0.37 to 0.27; category gains are not uniform. The text reports Qwen declines of 0.09 and 0.12 for Avg@3 and Best@3, rather than the displayed rounded gaps of 0.10 and 0.11, and gives a Model Development score of 0.88 that conflicts with Table 1’s 0.39. Its characterization of Qwen’s puzzle and system scores as near zero also does not match Table 1’s 0.26 and 0.29.
- C.2 Stability Analysis reports mean per-task standard deviation, mean range, coefficient of variation, and dispersion normalized by Best@3, and recommends Avg@3 or more trials over best-run-only evaluation. The reported Best@3–Avg@3 gap correlates with dispersion at Pearson r = 0.84, but Table 8’s aggregate scores differ from Table 1 without an explained change of scope: claude-opus-4.6 is listed as 0.77/0.85 rather than 0.68/0.76. The illustrative scores 0.85, 0.20, and 0.20 average to approximately 0.417, not the stated 0.65, and the listed values do not support the claim that 0.099 is less than half every other top-five model’s dispersion. Table 8 still identifies claude-opus-4.6 as having the lowest listed standard deviation and shows substantial variability for several other models.
Brief Thoughts
AUTOLAB’s useful contribution is the combination of executable optimization tasks with failure and spending diagnostics: the same zero score can represent early abandonment, invalid output, a constraint violation, or no submission. The harness ablation provides direct evidence that agent configuration materially changes measured performance, while limiting any interpretation of the leaderboard as harness-independent model capability.
The trajectories support measurement-driven iteration as a recurring feature of successful optimization, but do not establish persistence as the dominant causal predictor across tasks. Precise model selection and reliability comparisons require reconciling the inconsistent scoring anchors, appendix aggregates, and stability examples with the released artifacts.