


Compute Trends Across Three Eras of Machine Learning | Summary
11 Feb 2022 | Paper Review Compute Trends Scaling LawsContents
This article explains the key points of Compute Trends Across Three Eras of Machine Learning.
- 2022-02-11 (arXiv)
- Sevilla, Jaime, Heim, Lennart, Ho, Anson, Besiroglu, Tamay, Hobbhahn, Marius, Villalobos, Pablo.
- University of Aberdeen, Centre for the Governance of AI, University of St Andrews, Massachusetts Institute of Technology, University of Tübingen, Complutense University of Madrid
- Paper (v2, revised 2022-03-09)
Summary
- The paper examines how the computational work required to train notable machine learning systems changed over time. In its historical dataset, training compute doubled approximately every 6 months after 2010, compared with roughly every 20 months before 2010.
- The authors also identify a possible separate large-scale trend beginning in late 2015, with training requirements 10 to 100 times larger than the existing trend and an estimated 9.9-month doubling time. This separation is tentative because the classification was chosen after inspecting the data and the large-scale sample is small.
1 Introduction
The authors treat compute as a measurable proxy for one aspect of machine learning progress, alongside data and algorithmic advances. They curate 123 milestone systems and annotate their training compute; the dataset, figures, and interactive visualization are available at https://ml-progress.com/data, https://github.com/ML-Progress/Compute-Trends, and https://ml-progress.com/visualization.
2 Related work
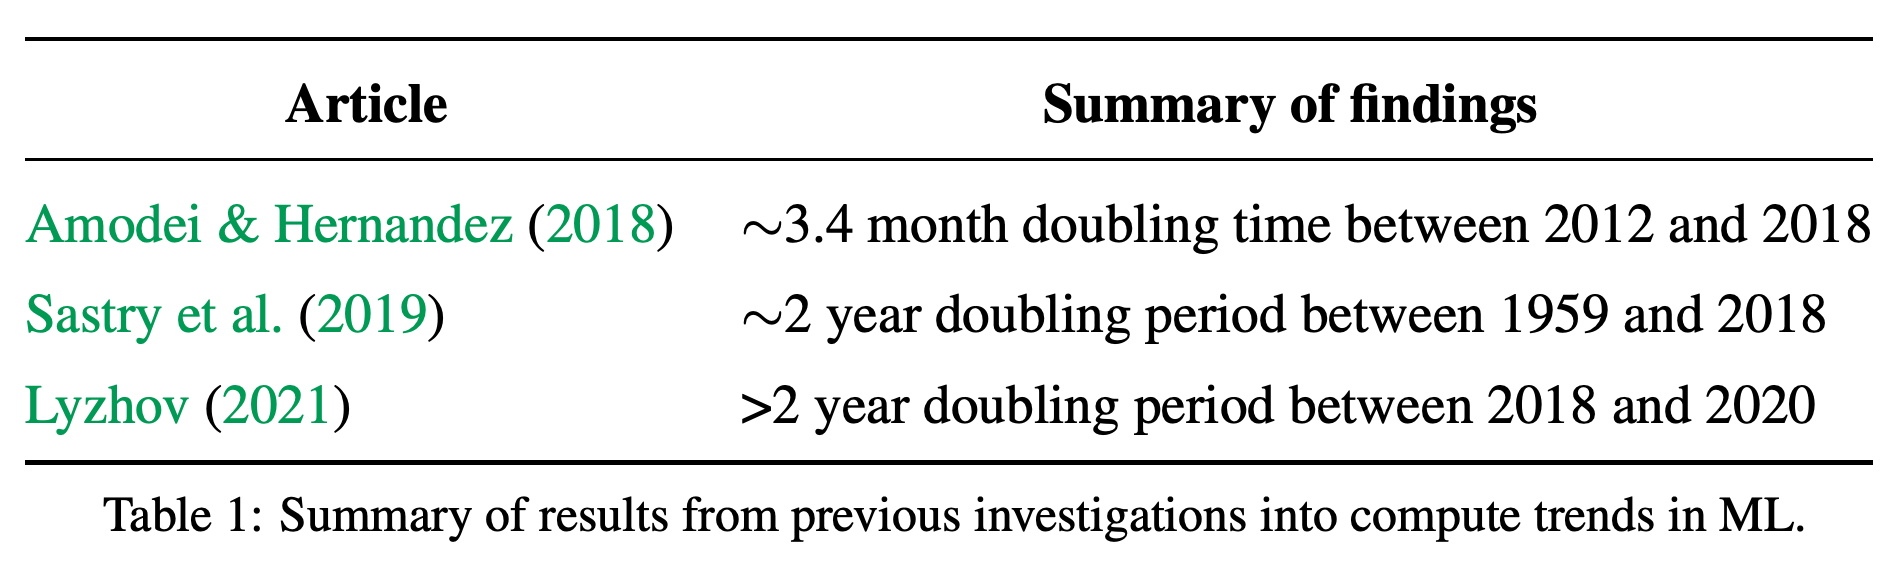
Amodei & Hernandez (2018) reported a 3.4-month doubling time for 15 systems between 2012 and 2018, while Sastry et al. (2019) estimated about two years for 1959–2012. The paper’s Table 1 instead labels the Sastry period as 1959–2018. Lyzhov (2021) argued that growth stalled after 2018; the present paper extends the dataset through 2022 and considers separate regular-scale and large-scale trends.
The earlier estimates differ substantially in both time window and sample, providing context for the paper’s decision to revisit the historical trend.
3 Trends
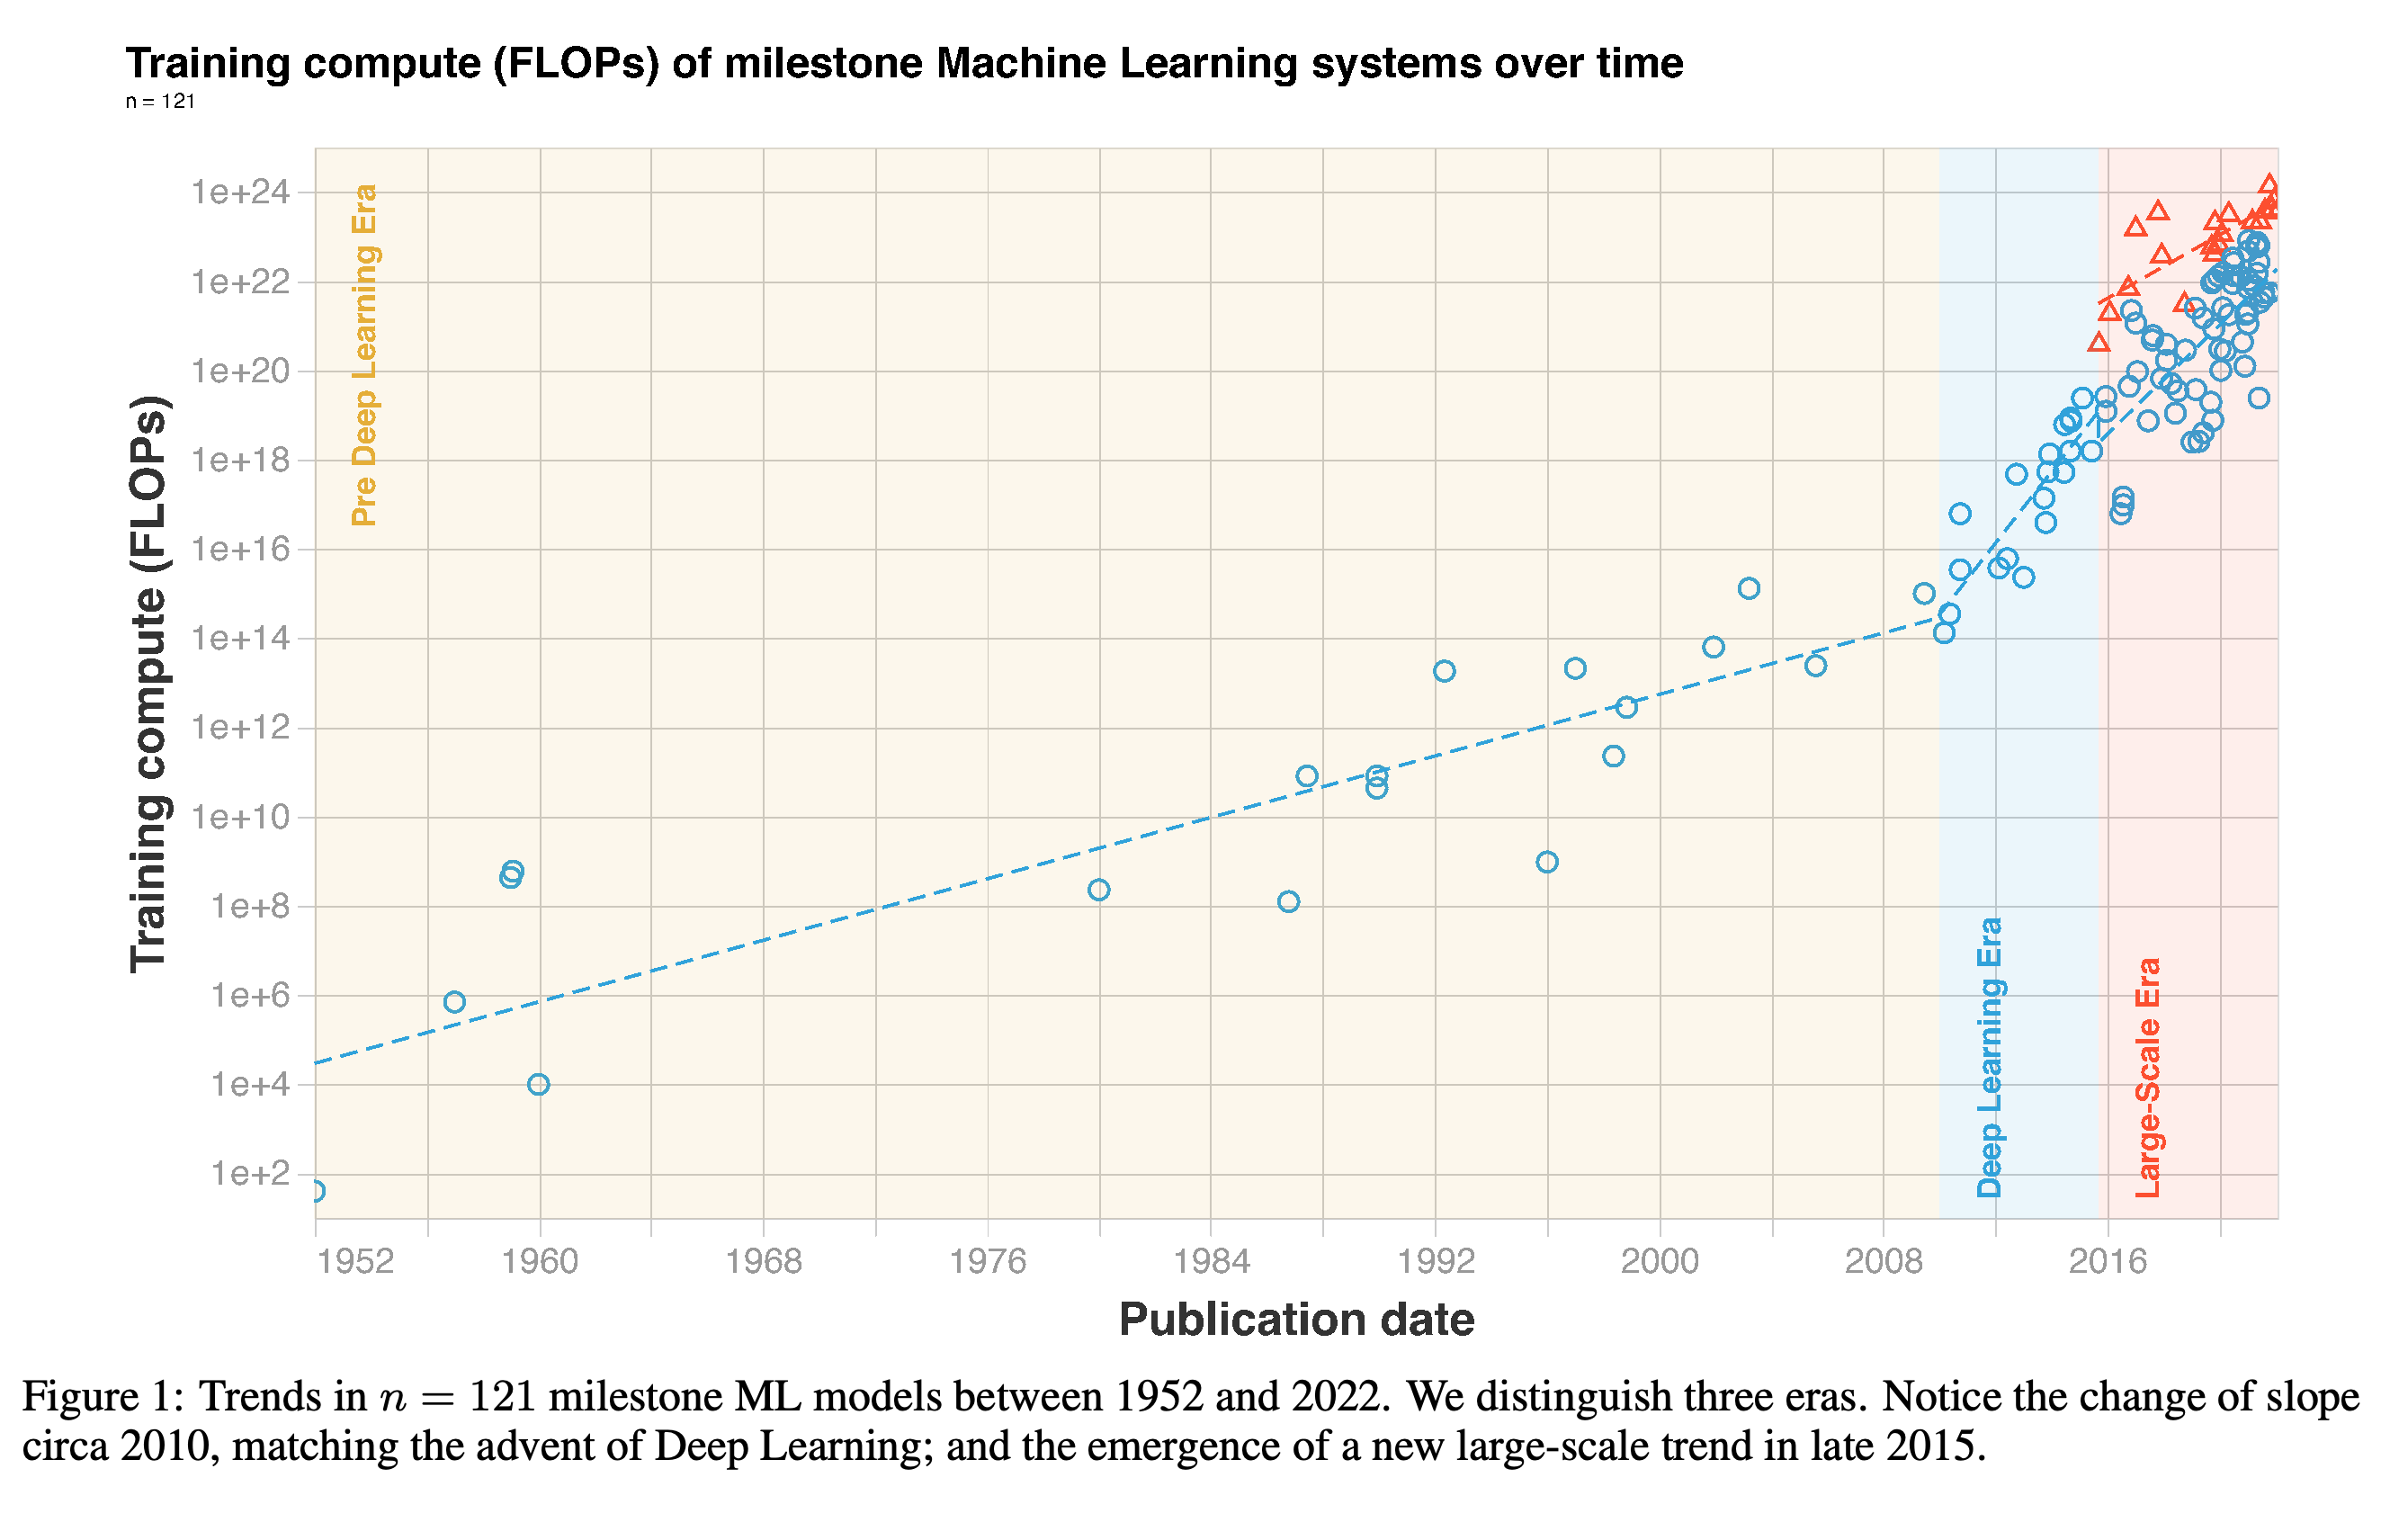
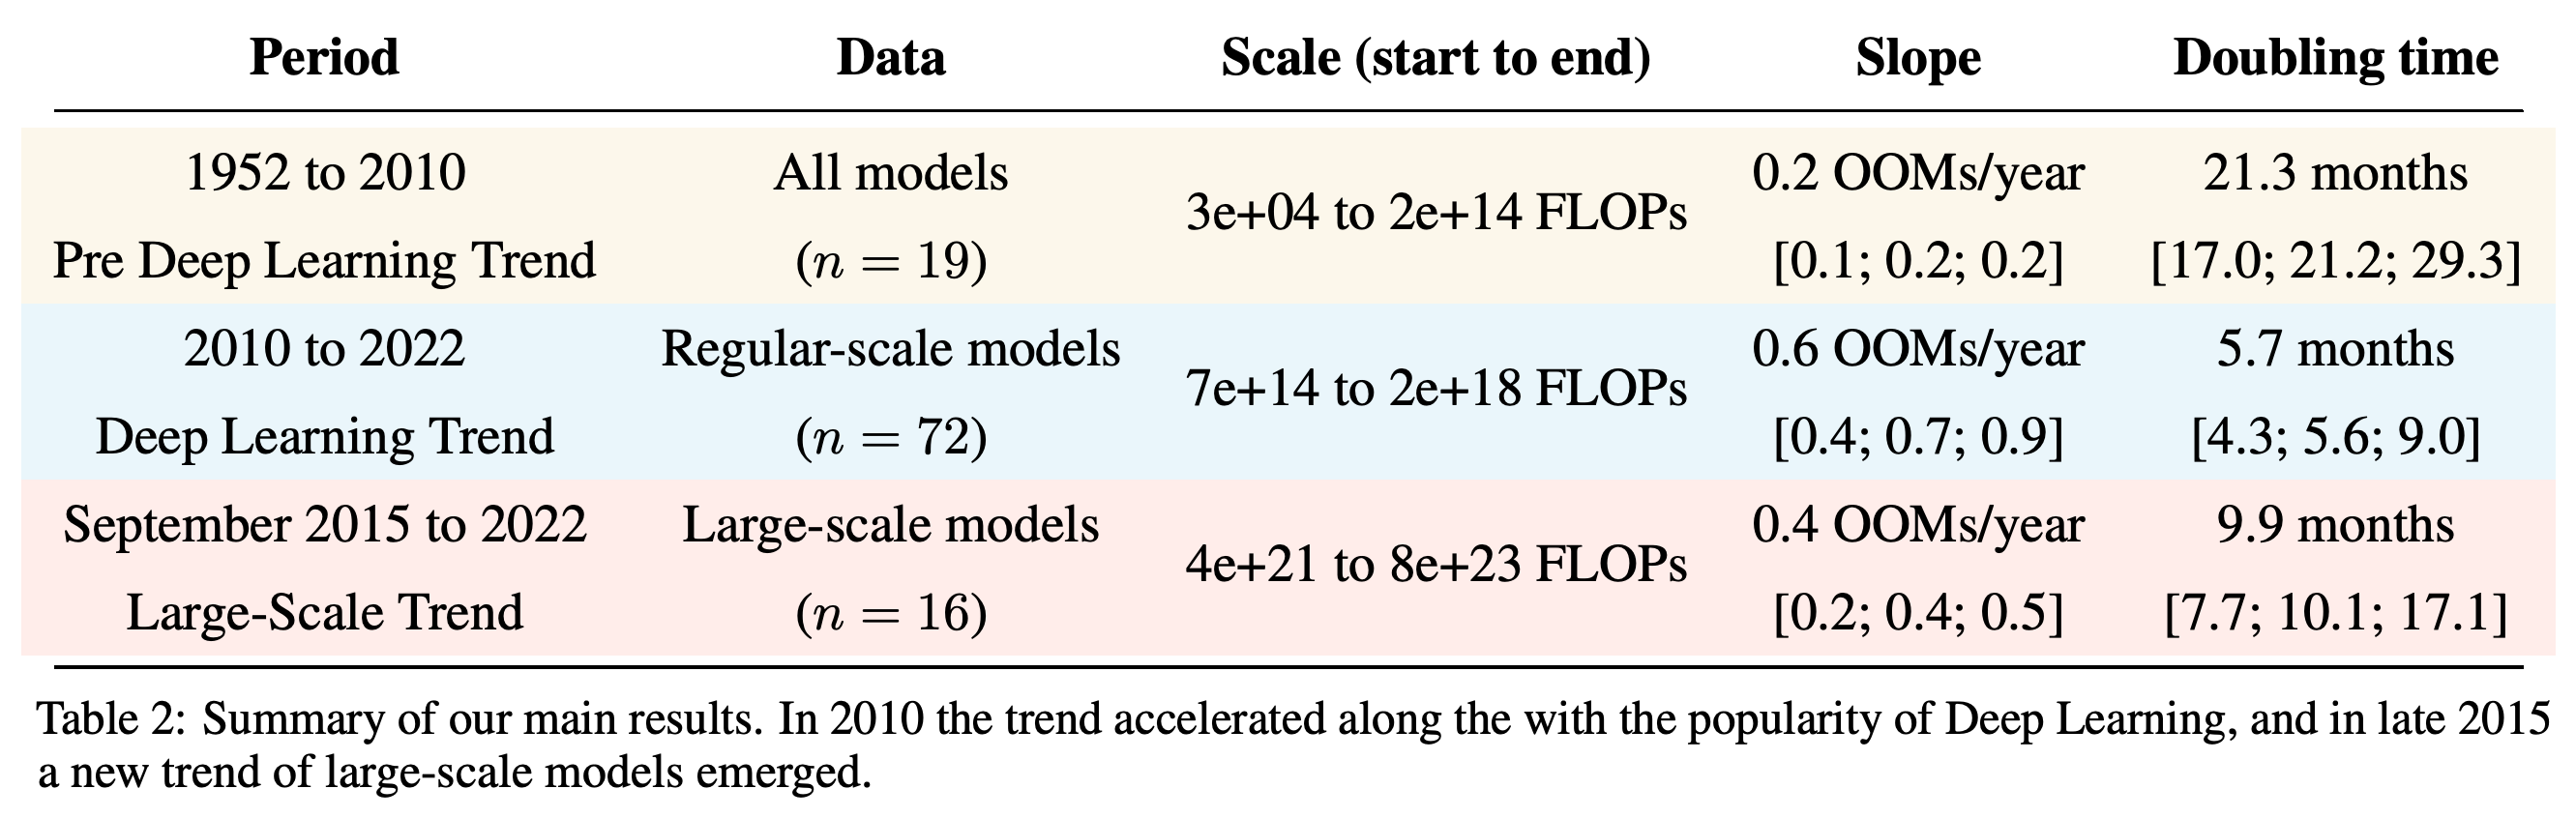
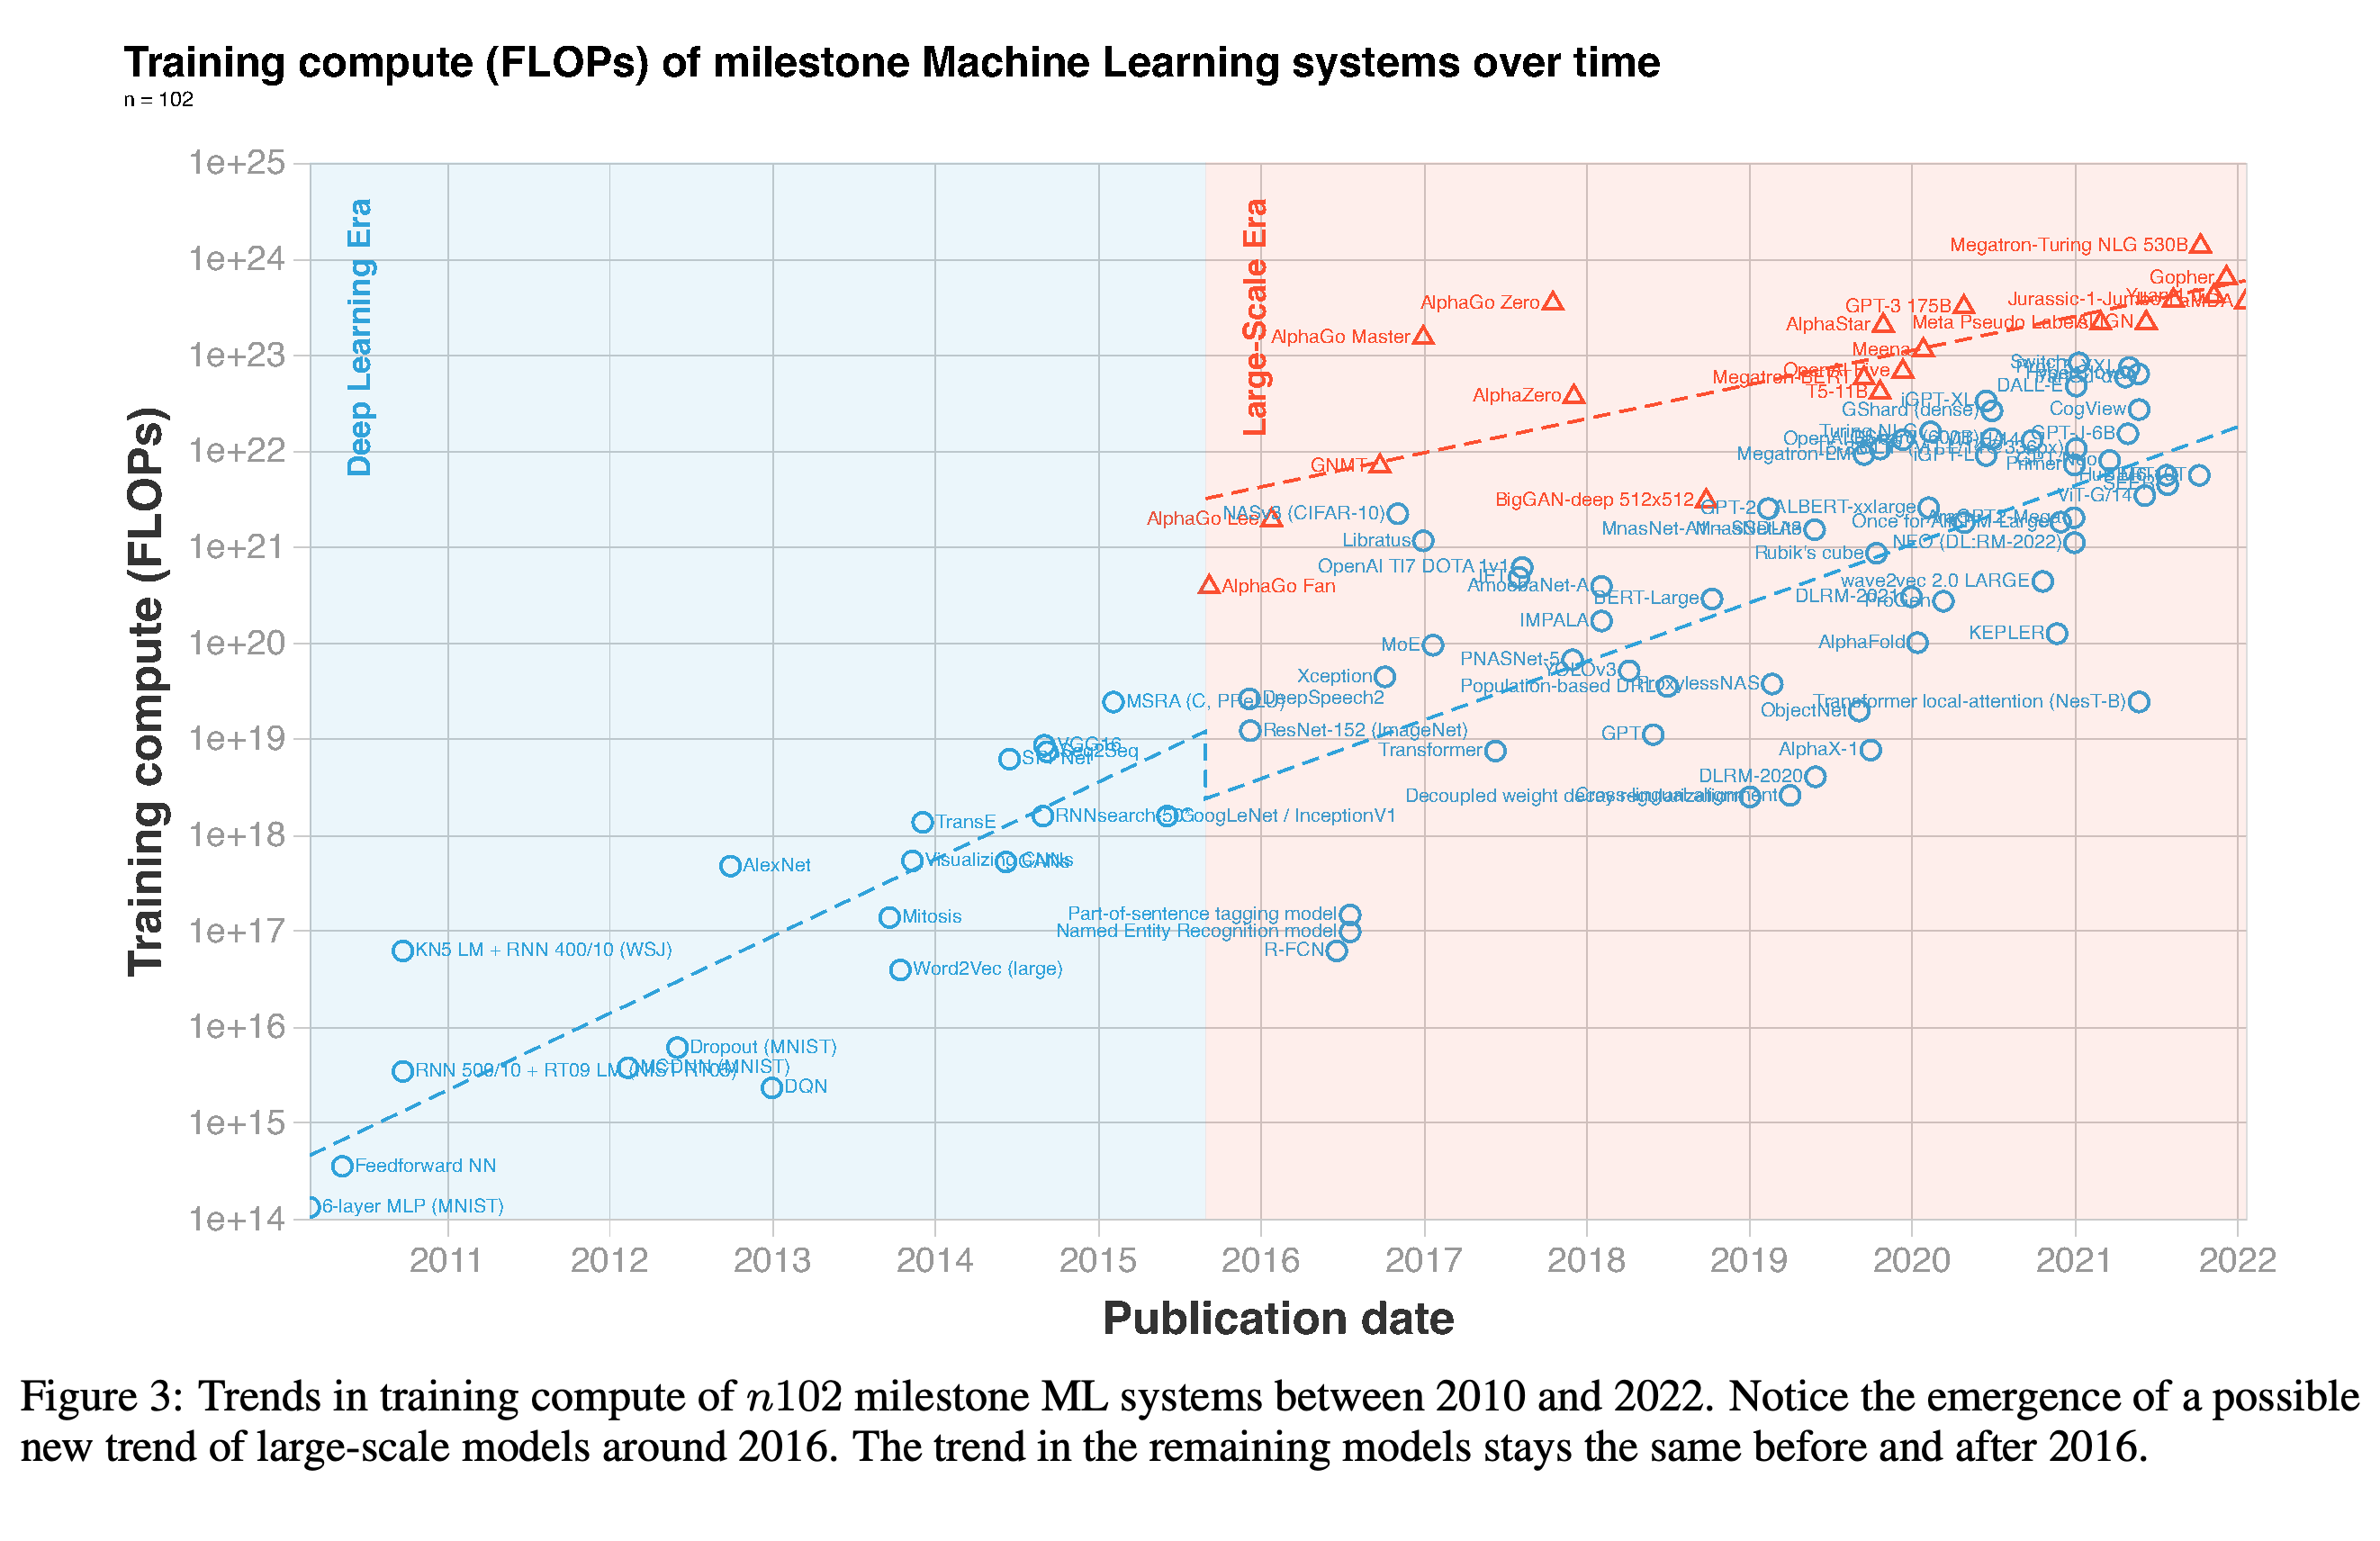
The authors fit log-linear trends, meaning straight lines to the logarithm of training compute, across three periods. Table 2 reports doubling times of 21.3 months for 1952–2010 (19 models), 5.7 months for regular-scale models in 2010–2022 (72 models), and 9.9 months for large-scale models from September 2015 to 2022 (16 models).
The logarithmic vertical axis shows a steeper rise around 2010 and a group of unusually compute-intensive systems emerging in late 2015.
The three fitted groups have different sample sizes and estimated doubling times, with the large-scale group substantially smaller than the regular-scale group.
3.1 The transition to Deep Learning
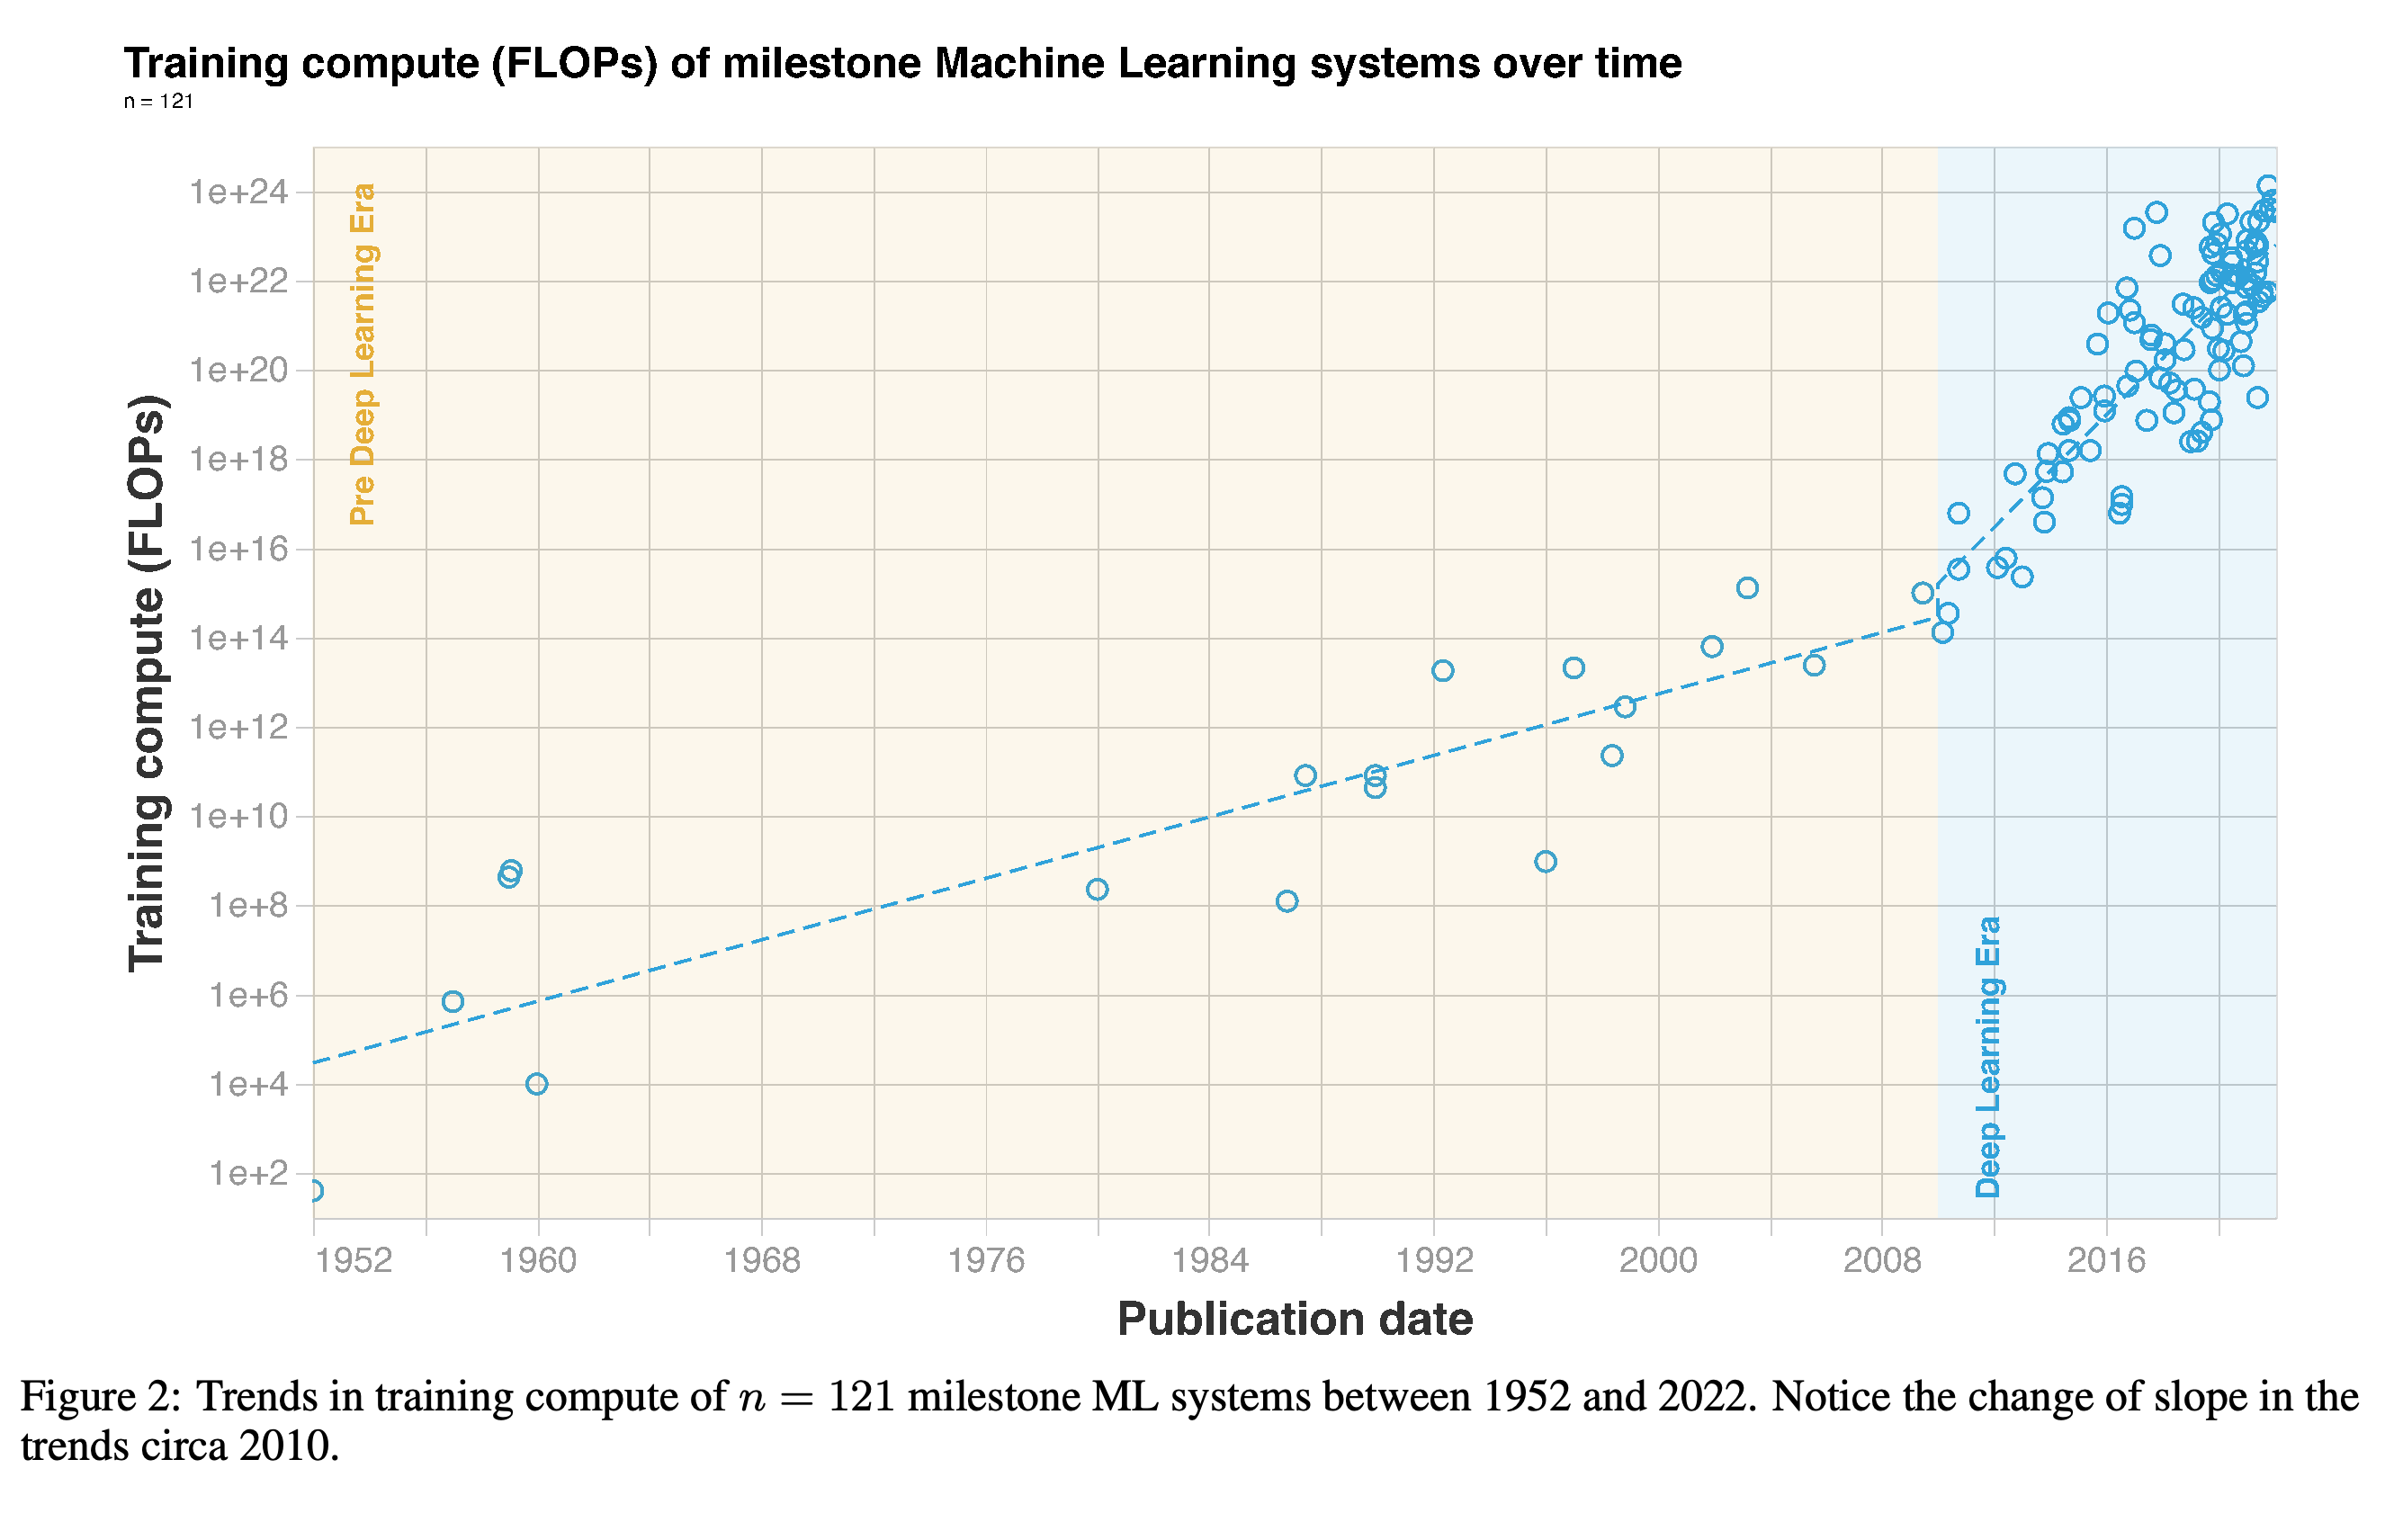
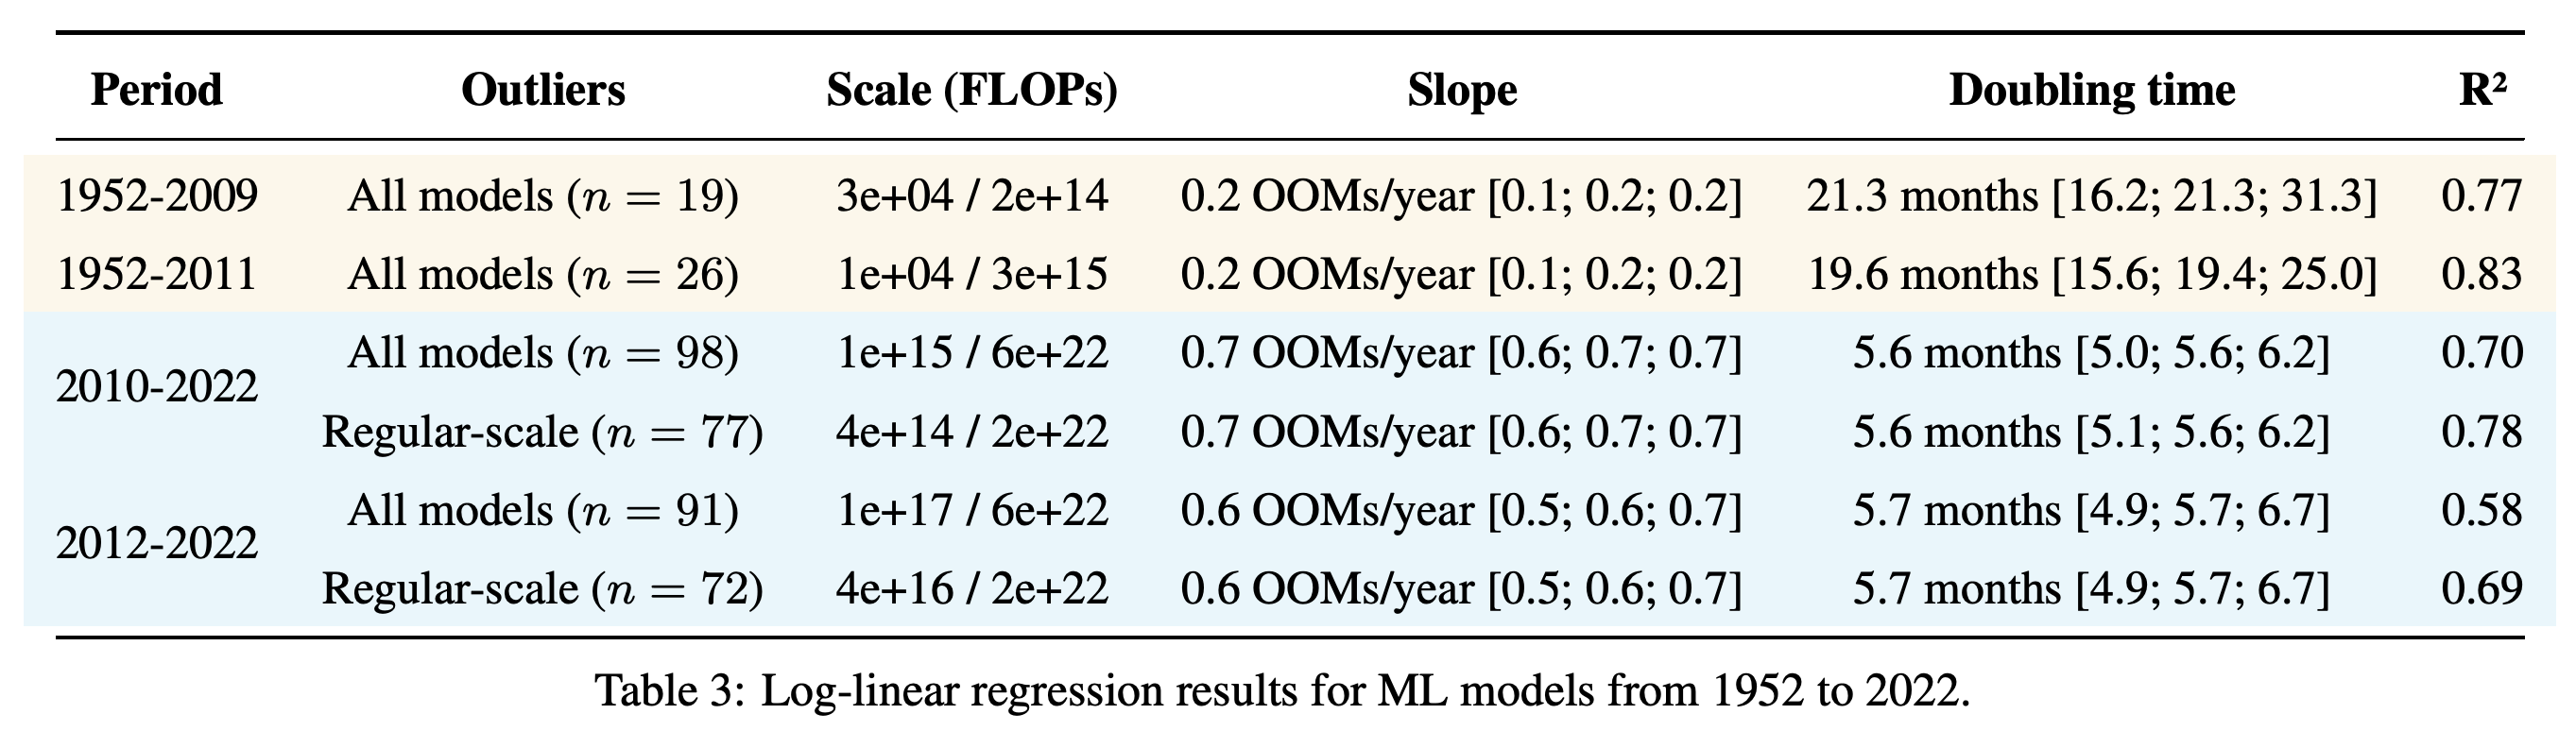
The pre-2010 trend roughly matches Moore’s law, the observation that transistor density doubles approximately every two years. The estimated doubling time changes little when the Deep Learning Era is dated from 2010 or 2012: Table 3 gives 5.6 and 5.7 months, respectively, for all models in the corresponding later periods.
The same historical observations are presented without the separate large-scale grouping to emphasize the change in slope around 2010.
The later-period point estimates remain close when the start date changes from 2010 to 2012 and when large-scale models are excluded.
3.2 Trends in the Large-Scale era
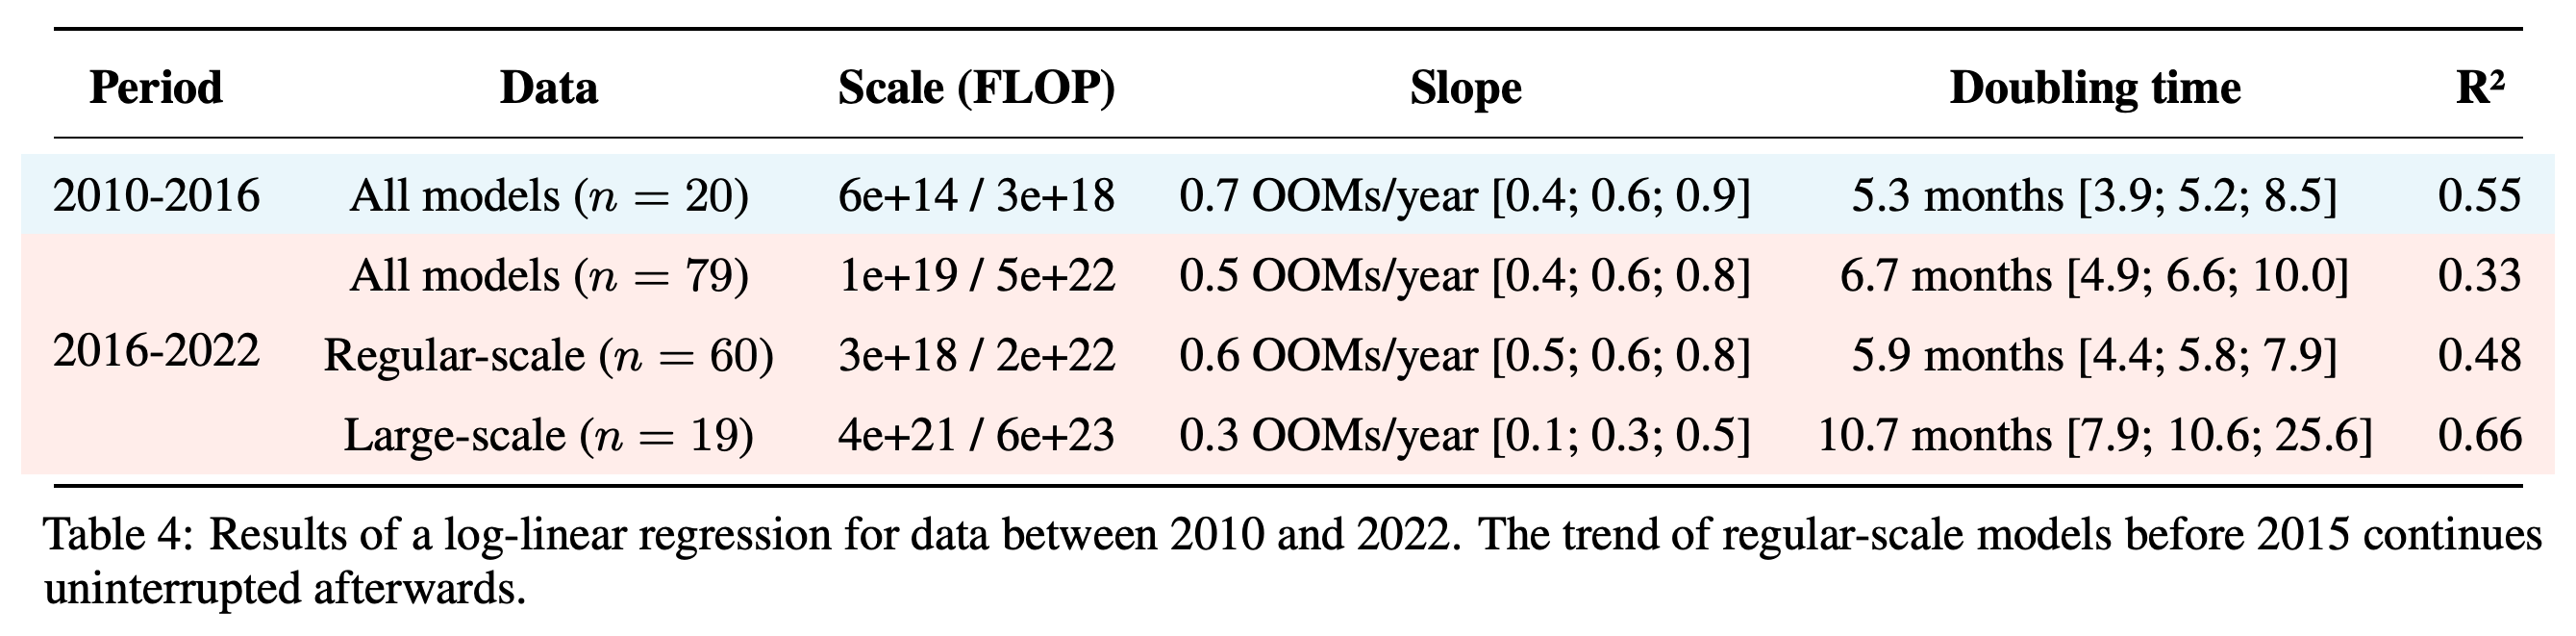
The proposed large-scale trend begins with AlphaGo in late 2015, while regular-scale models continue to grow at roughly the same rate before and after 2016. For 2016–2022, Table 4 estimates 5.9 months for 60 regular-scale models and 10.7 months for 19 large-scale models; the authors caution that the apparent difference in rates may be noise.
High-compute models appear above the continuing regular-scale trajectory from around 2016, motivating the authors’ tentative two-trend interpretation.
The regular-scale estimate after 2016 is close to the estimate for all models in 2010–2016, while the large-scale estimate has a wider interval.
4 Conclusion
The authors interpret the history as a slow pre-deep-learning period, faster growth around 2010, and a possible high-compute branch from late 2015. They acknowledge uncertainty about whether large-scale systems form a distinct category and do not analyze dataset-size trends in this paper.
Appendix
- A Methods: Milestone selection requires a learning component, experimental results, a state-of-the-art advance, and at least one notability criterion; selection for models from 2020 onward is more subjective. Missing training compute is estimated from information such as forward-pass compute or graphics processing unit time, and only the final training run is counted.
- A Methods: Confidence intervals use 1,000 bootstrap samples, a resampling procedure, with each compute estimate perturbed by a log-uniform factor between 1/2 and 2. Low-compute outliers and large-scale models are selected using thresholds chosen after visual inspection; the text describes a 1.5-year comparison window while Table 5 says two years.
- B Analyzing record-setting models: Models exceeding all prior training-compute records show a slow early trend and faster growth after 2010. The post-2015 estimate is sensitive to AlphaGo Zero and AlphaGo Master, illustrating the influence of individual records.
- C Trends in different domains: For 2009–2022, estimated doubling times are 6.0 months for vision, 4.8 months for language, and 6.8 months for other domains. Games have a sparse, scattered sample and no consistent trend.
- D When did the Deep Learning Era start?: The authors choose 2010 because competitive deep networks, graphics processing unit training, and adoption in speech recognition preceded AlexNet in 2012; they acknowledge that the date is debatable.
- E Comparison to Amodei & Hernandez’s analysis: A shorter observation window or separation of large-scale models can explain differences from the earlier 3.4-month estimate. The authors favor two trends, but also describe a single-trend interpretation with a slowdown after 2017.
- F Are large-scale models a different category?: The authors hypothesize that exceptionally expensive flagship projects form a separate category, but lack internal spending and return data to establish this. Changing the selection threshold produces relatively small changes in estimated rates.
- G Causes of the possible slowdown of training budget in large-scale models between 2016 and 2022: Proposed explanations include chip shortages, infrastructure engineering difficulties, budget limits, and unpublished models; these are hypotheses, not tested causal findings.
- H Limitations: Compute estimates may contain calculation errors, the sample is small, and selection favors published, English-language, and subjectively notable systems. The authors expect most estimates to be within about a factor of two, based on comparisons of estimation methods.
Brief Thoughts
The historical comparison reports alternative period boundaries and sensitivity to model selection. Its doubling times describe a selected set of milestone training runs, so they should not be interpreted as growth rates for all machine learning work or as evidence that compute alone caused capability gains.