


Scaling Language-Free Visual Representation Learning | Summary
01 Apr 2025 | Paper Review Self-Supervised Learning Scaling Laws Visual Question AnsweringContents
This article explains the key points of Scaling Language-Free Visual Representation Learning.
- 2025-04-01 (arXiv)
- Fan, David, Tong, Shengbang, Zhu, Jiachen, Sinha, Koustuv, Liu, Zhuang, Chen, Xinlei, Rabbat, Michael, Ballas, Nicolas, LeCun, Yann, Bar, Amir, et al.
- FAIR, Meta, New York University, Princeton University
- Paper
- Github
- Project Page
Summary
- The paper tests whether learning image features without paired text limits their usefulness for answering questions about images, or whether earlier performance gaps reflect different training data. With both 7B-parameter image encoders trained on the same 2 billion MetaCLIP images and evaluated through the same downstream training procedure, Web-DINO, the paper’s image-only model, achieves 53.87 average visual question answering (VQA) versus 52.97 for Contrastive Language-Image Pretraining (CLIP), which learns from paired images and text.
- Web-SSL, the paper’s family of web-trained image models, scales visual self-supervised learning (SSL), learning image representations without language supervision, through larger models and more training exposure. Web-DINO improves from 49.01 to 53.87 average VQA as model size increases from 1B to 7B parameters with 2B examples seen; the 7B model reaches 55.24 after 8B examples seen, including repeated exposure to the 2B-image dataset.
- Data composition particularly affects optical character recognition (OCR), reading text in images, and chart understanding: a 2B-parameter model trained on the heavily filtered 1.3% subset reaches 40.4 on OCR & Chart versus 26.8 with unfiltered images and 36.1 for full-data CLIP, with all three seeing 2B training examples. These results concern language-free vision pretraining; downstream VQA still uses instruction tuning, training on image-question-answer examples, and the filtering experiment uses a pretrained model that processes images and language to select images.
1 Introduction
The introduction identifies training data as a confound in comparisons between visual SSL and CLIP. Earlier SSL models often use ImageNet, an image classification dataset, or curated datasets with hundreds of millions of images, whereas CLIP commonly uses billions of web image-text pairs. The paper trains Web-SSL on the same MetaCLIP web-data distribution and evaluates the 16 benchmarks in Cambrian-1, a VQA evaluation suite covering General, Knowledge, OCR & Chart, and Vision-Centric tasks.
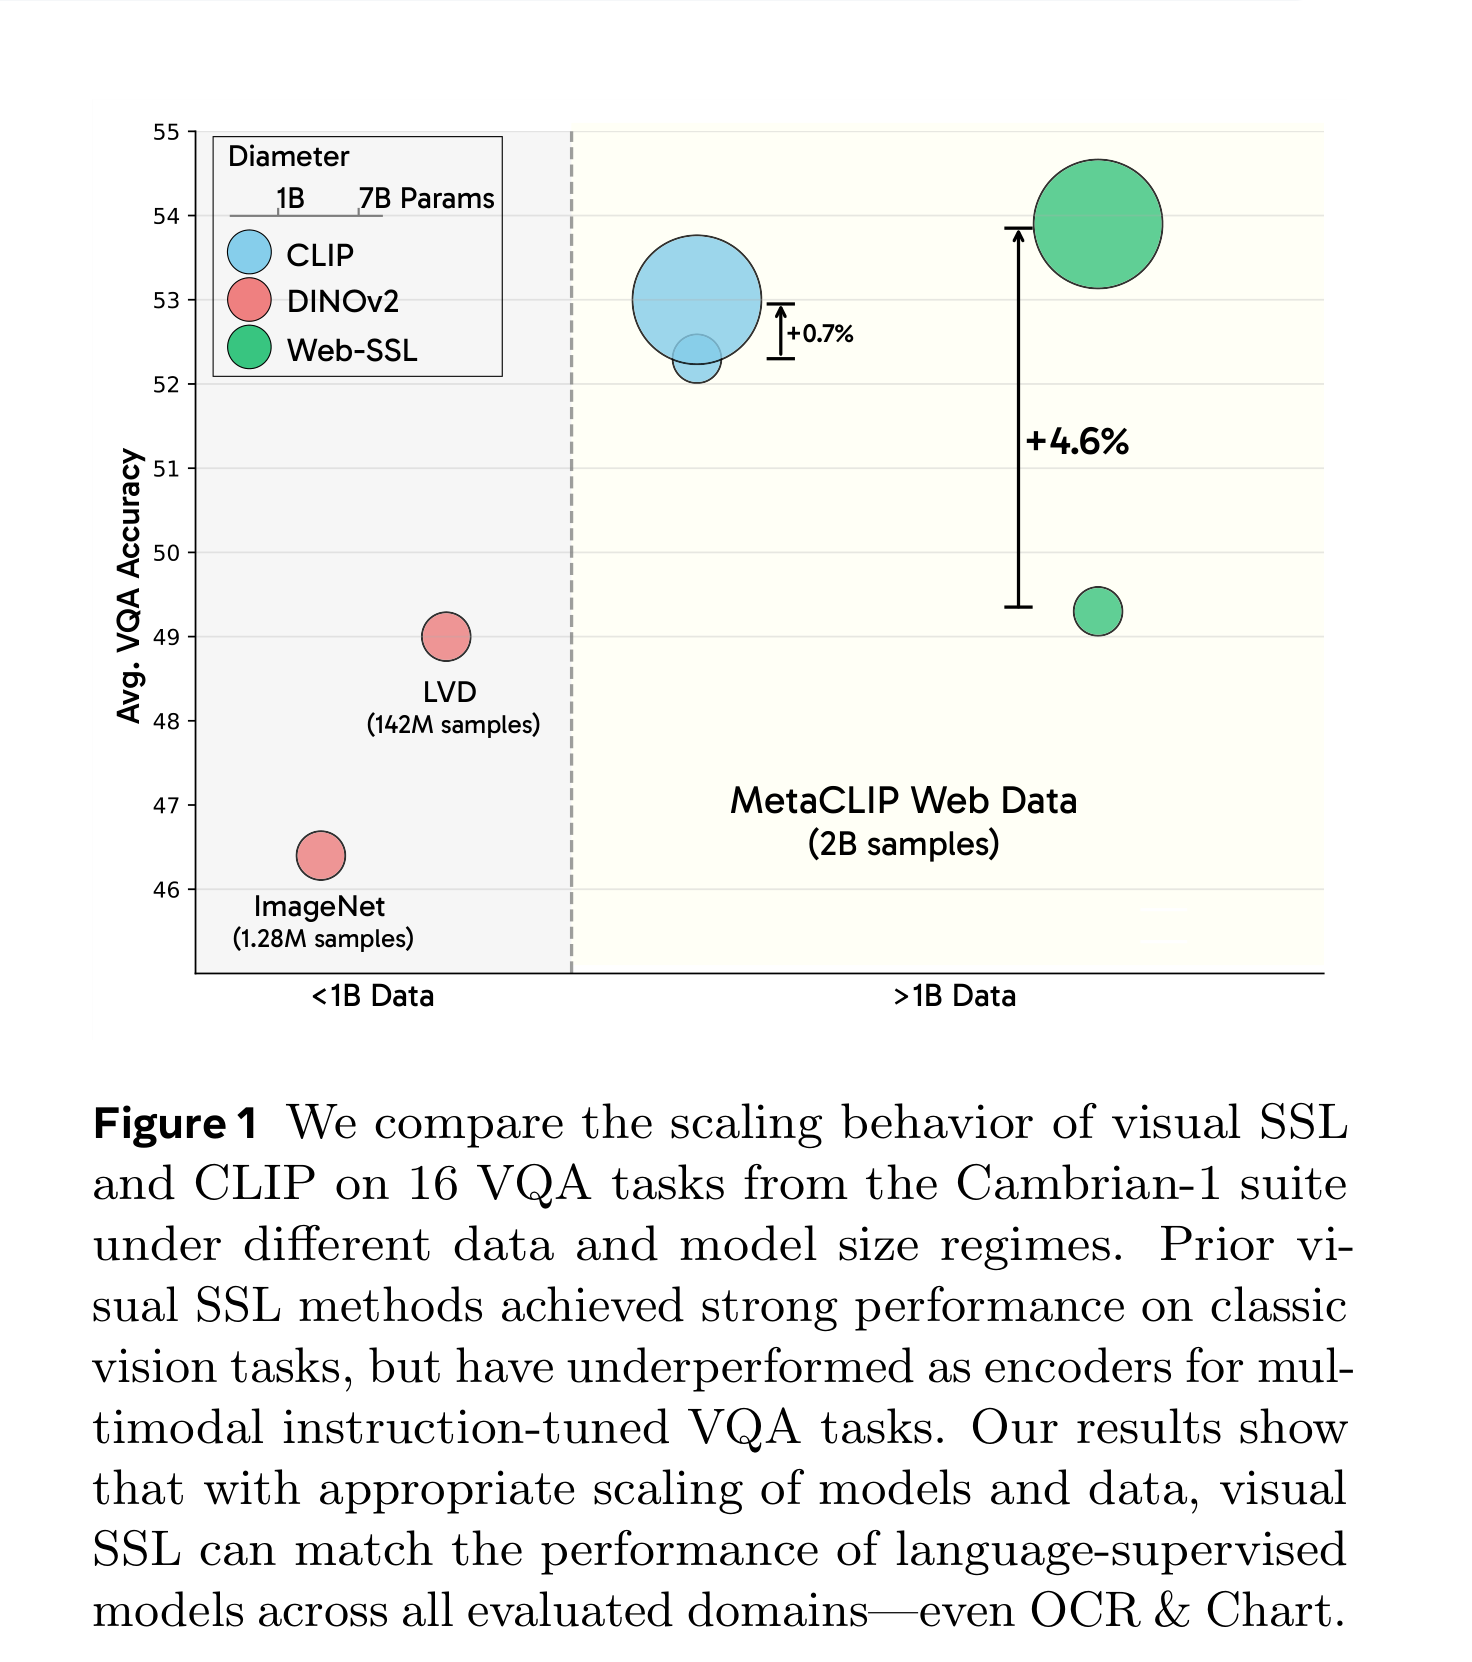
- Figure 1 places earlier models and Web-SSL across data and model scales, motivating comparisons that hold the image distribution fixed.
- The project page is https://davidfan.io/webssl/.
The overview separates training-data regimes and represents model size through marker diameter. Its larger improvement for Web-SSL motivates the controlled experiments, while the earlier ImageNet and LVD points illustrate why comparisons across existing models confound objective and dataset.
2 From Visual SSL 1.0 to 2.0
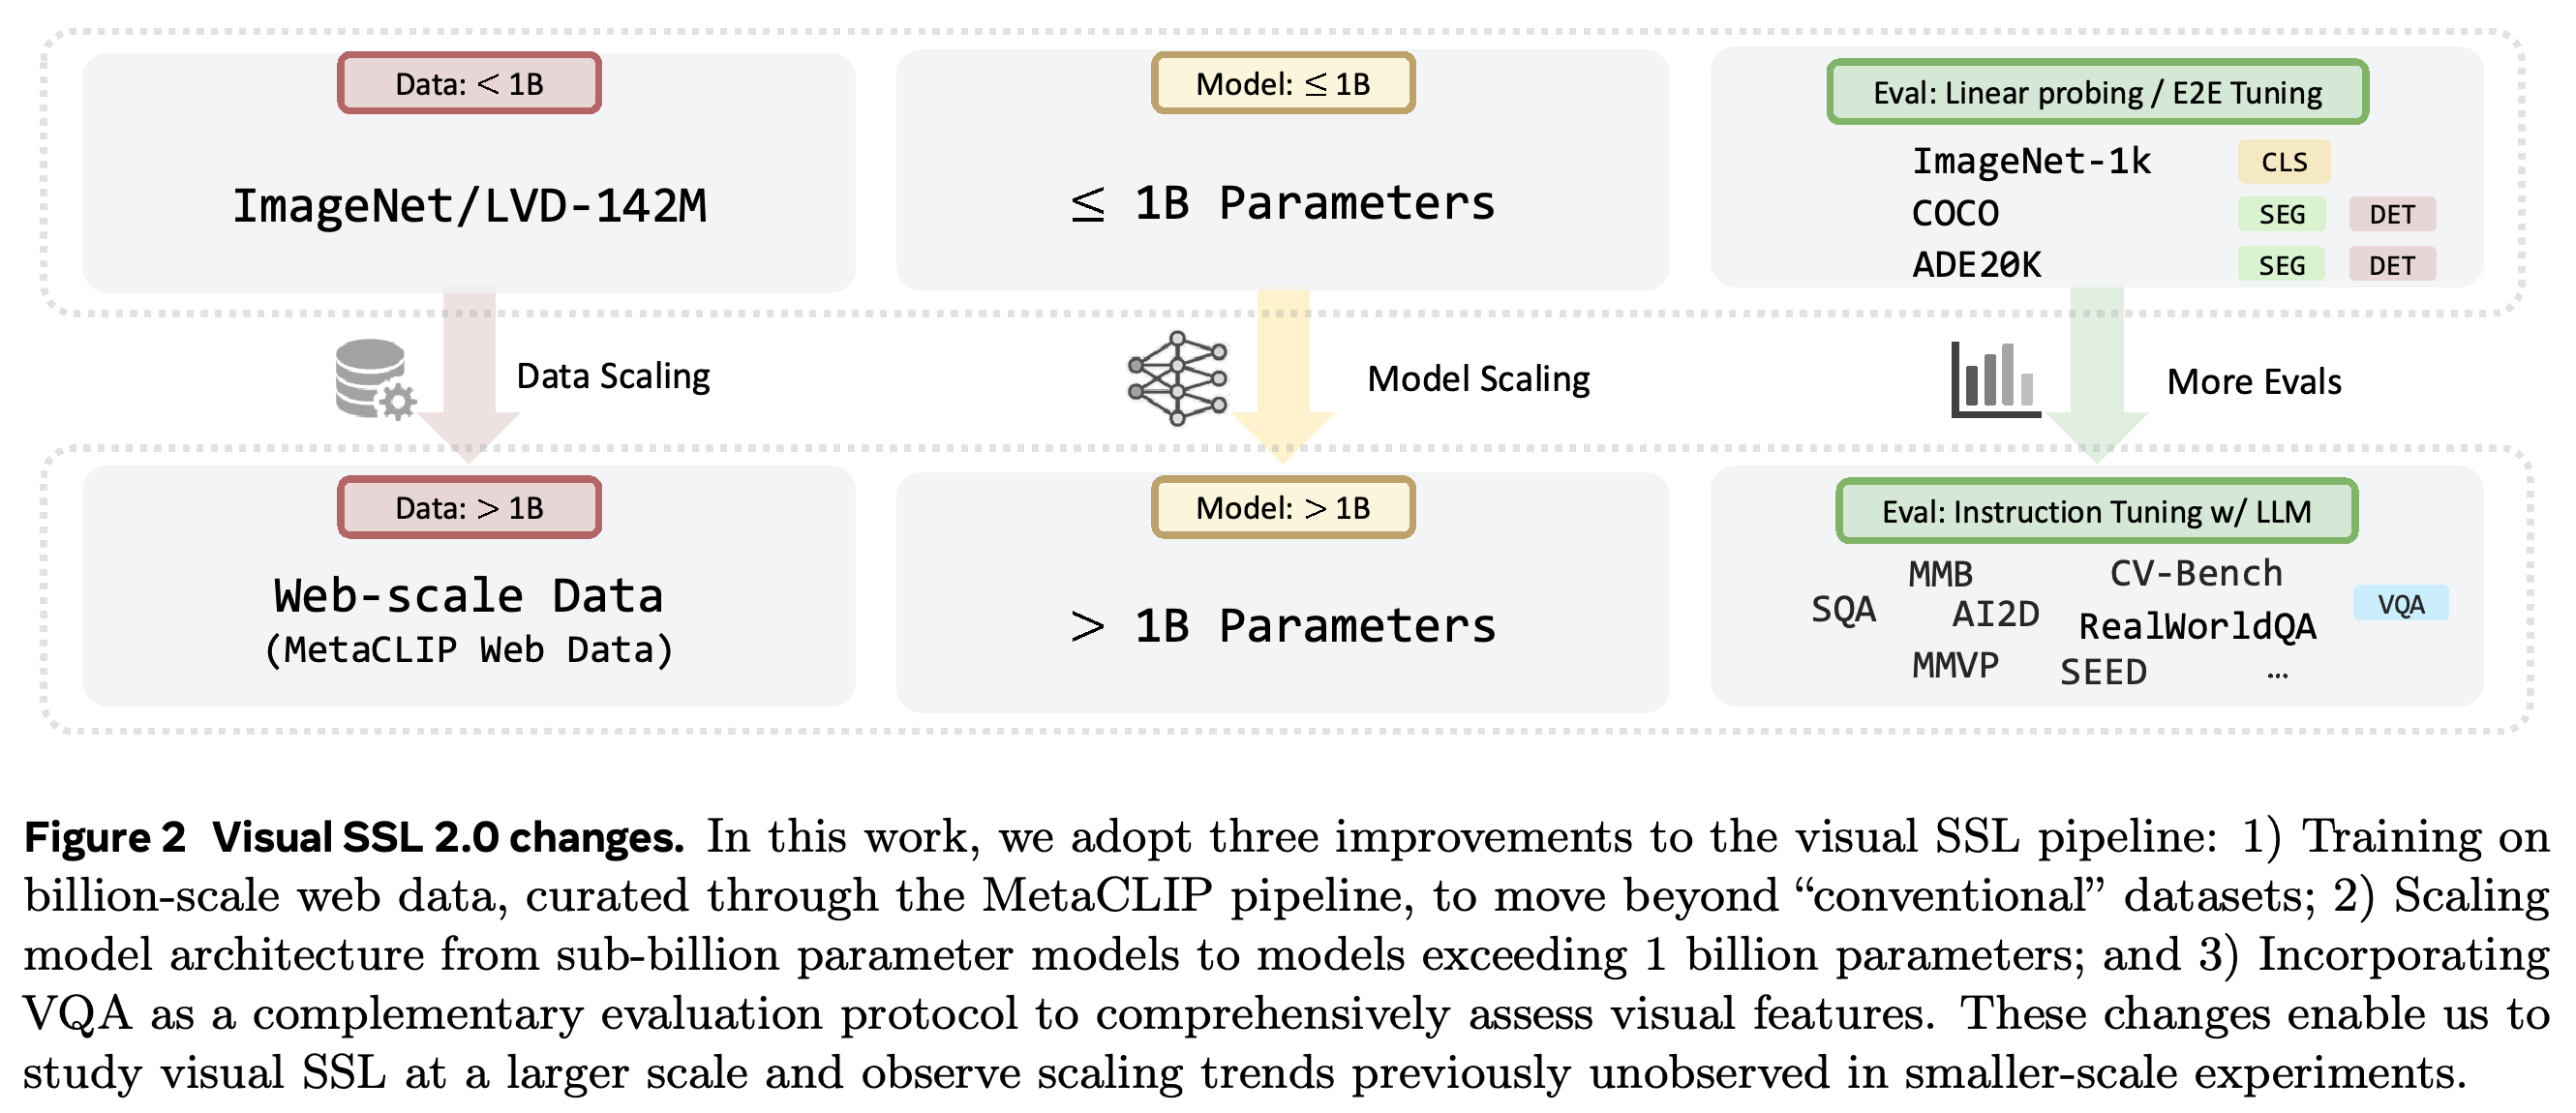
The experimental framework, called Visual SSL 2.0, changes three aspects of conventional visual SSL: billion-scale web images, vision encoders exceeding 1B parameters, and VQA evaluation alongside classification and segmentation, assigning classes to image regions. These changes test whether conclusions drawn from smaller datasets and models persist at larger scales.
The diagram identifies three changes in the study design: larger web datasets, models beyond 1B parameters, and instruction-tuned VQA evaluation. It extends the scale and evaluation of established self-supervised methods.
2.1 Beyond ImageNet Pretraining
MC-2B denotes the 2 billion samples selected from MetaCLIP for this study. SSL models receive only the images, while CLIP receives the corresponding image-text pairs, controlling the underlying image distribution and dataset size when comparing pretraining approaches.
2.2 Scaling Up Vision Models to Billion Scale
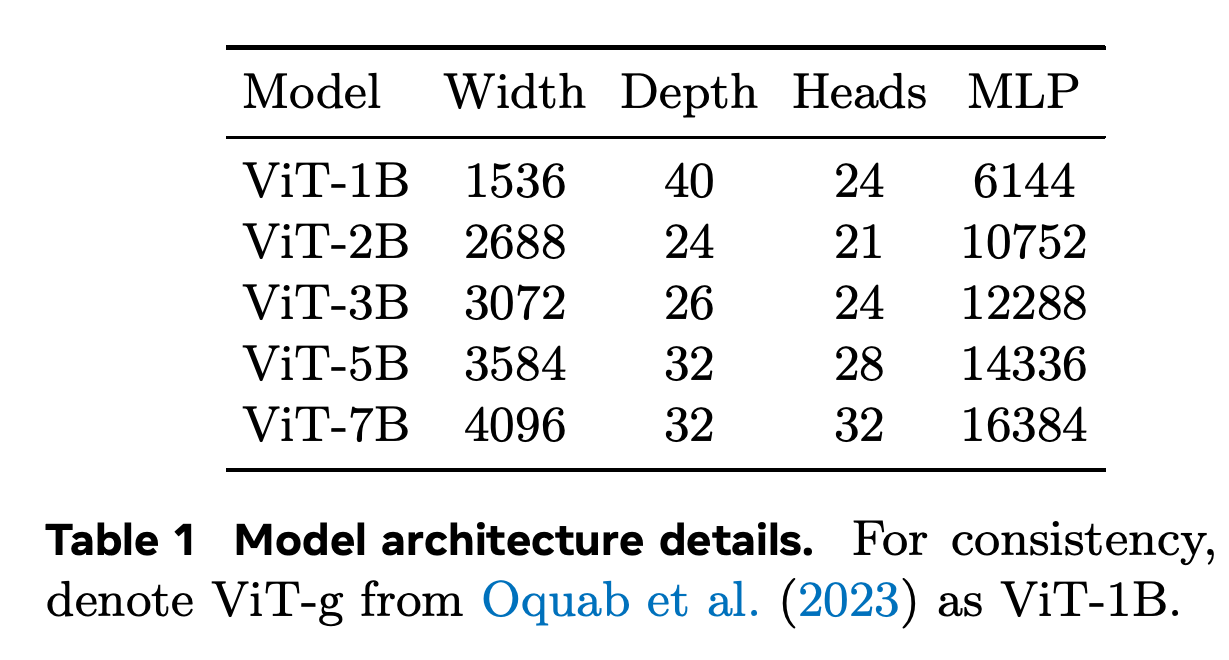
The authors train Vision Transformers (ViTs), transformer-based image encoders, with nominal sizes of 1B, 2B, 3B, 5B, and 7B parameters. ViT-g from DINOv2, an established visual SSL method, is renamed ViT-1B; the larger configurations increase width while also varying depth and attention-head count.
- Table 1 specifies width/depth/heads/feed-forward dimensions as 1536/40/24/6144, 2688/24/21/10752, 3072/26/24/12288, 3584/32/28/14336, and 4096/32/32/16384 for the five sizes.
Scaling changes several architectural dimensions: the 2B model is shallower and wider than the 1B model. The specified widths, depths, attention-head counts, and feed-forward dimensions define the encoder families used in the comparisons.
2.3 Multimodal LLMs as an Evaluation Protocol
Each vision encoder is evaluated through the same two-stage visual instruction tuning procedure with Llama-3 8B Instruct, a large language model (LLM) used to generate answers. First, a multilayer perceptron (MLP), a feed-forward adapter, learns to project image features into the language model’s feature dimensionality; then the adapter and LLM are fine-tuned together. The vision encoder remains frozen, meaning its parameters are unchanged, throughout.
- The Cambrian-1 suite contains four benchmarks in each of four categories. Average VQA gives equal weight to the four category scores.
- Holding the language backbone and downstream training procedure fixed helps isolate differences between vision encoders. The findings remain conditional on this evaluation setup.
3 Scaling Visual SSL
The main scaling experiments use DINOv2, a joint embedding method that aligns representations of augmented views of an image, and call the resulting web-trained models Web-DINO. Model scaling holds exposure at 2B images, while exposure scaling holds model size at 7B and varies examples seen from 1B to 8B. Each method retains its existing training recipe across model sizes.
3.1 Scaling Model
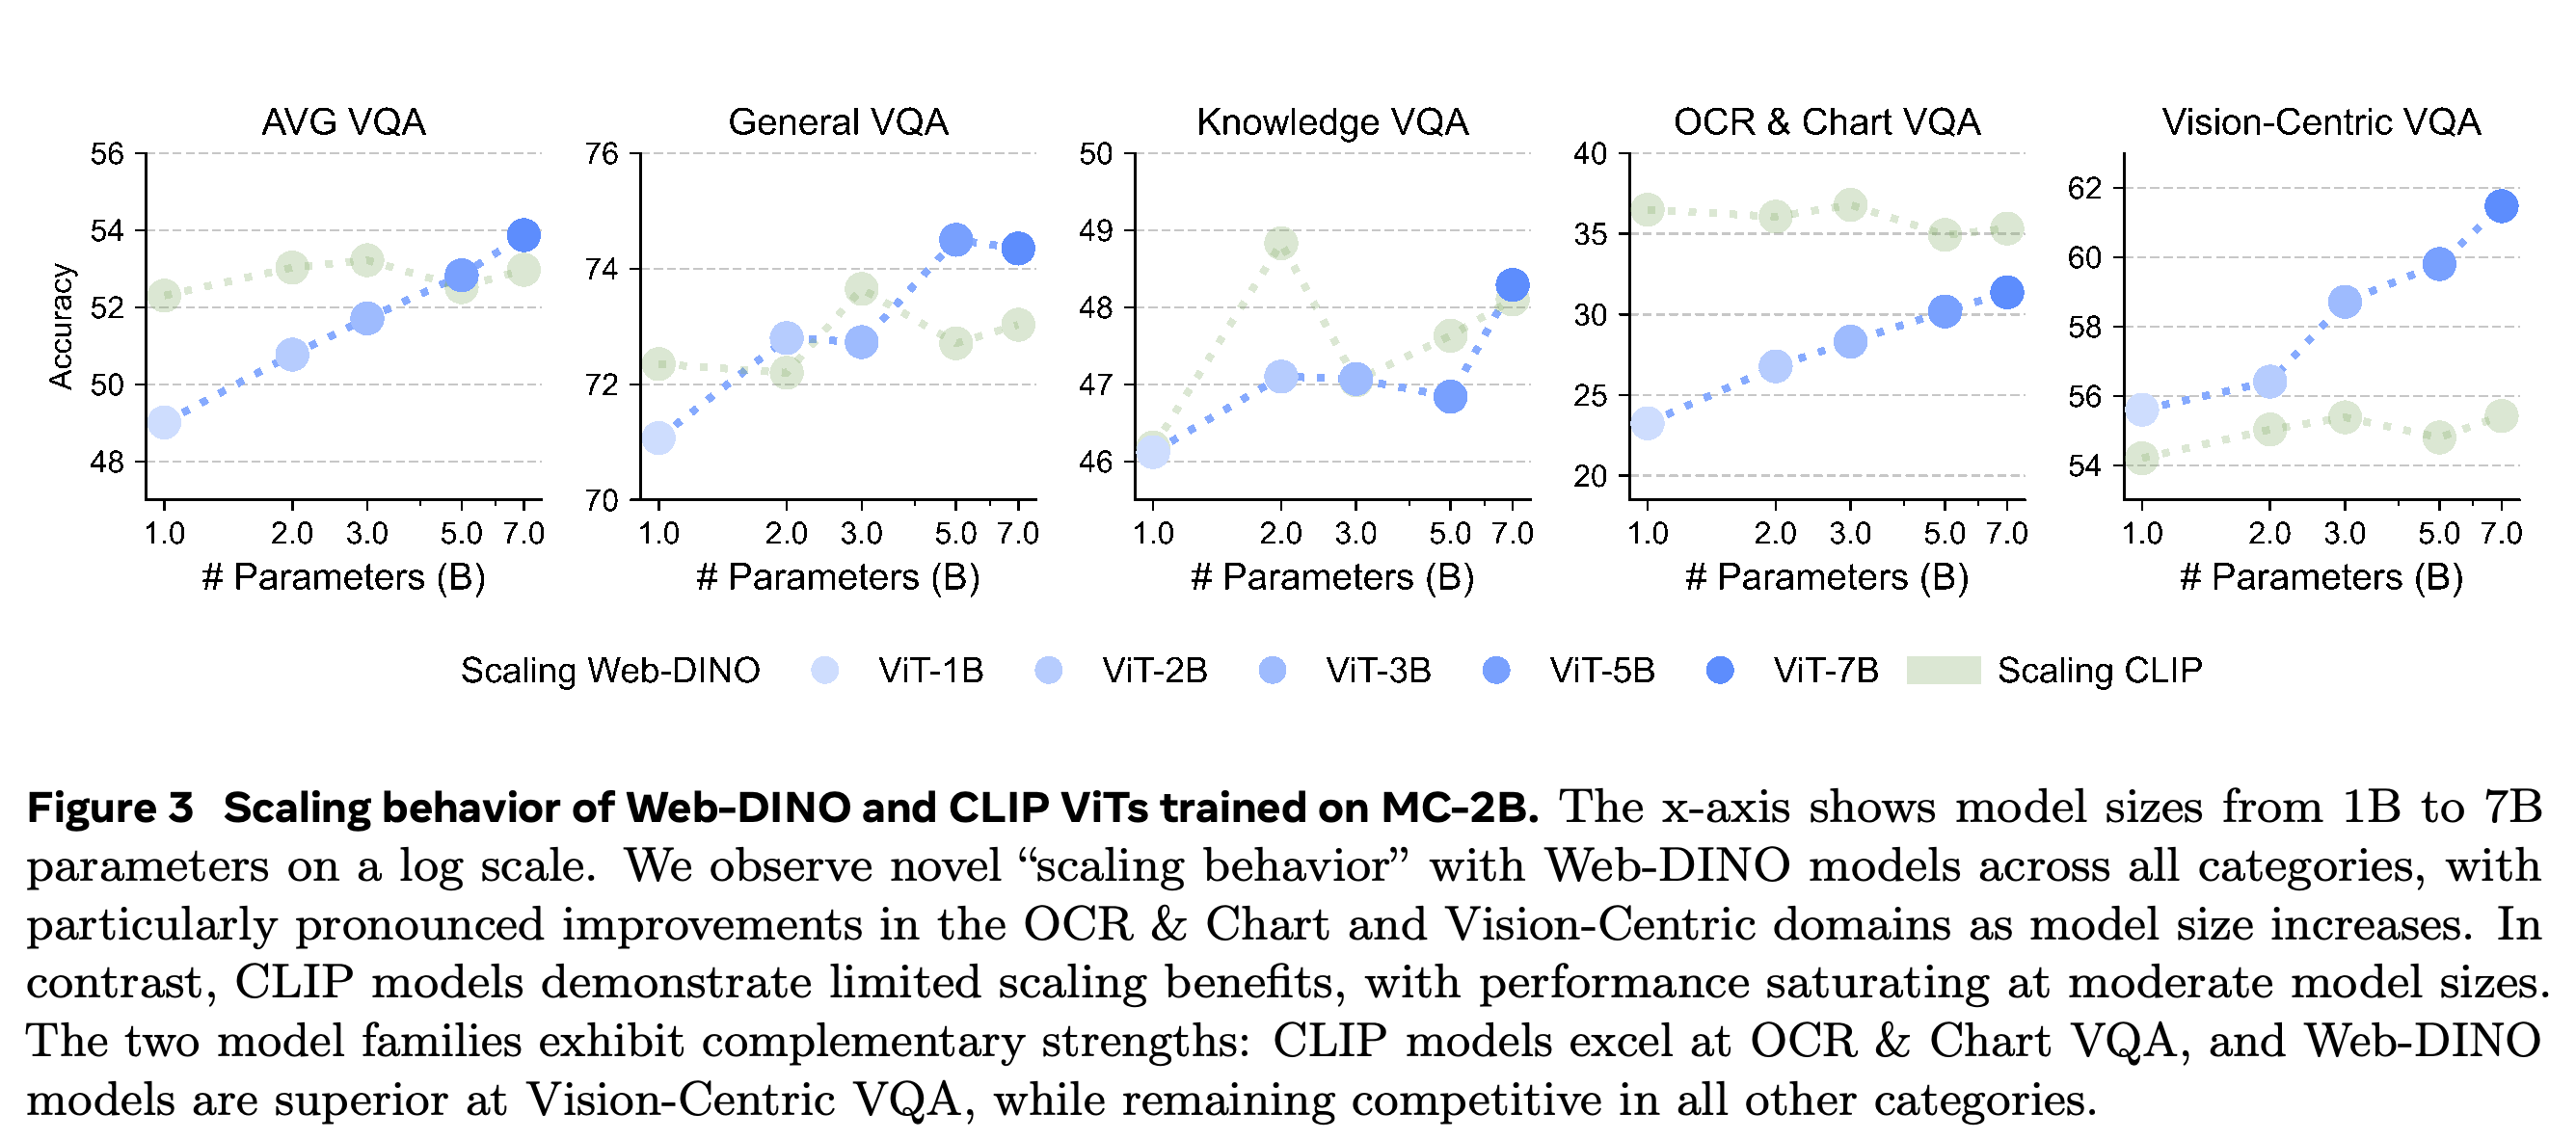
Web-DINO and CLIP are trained at matching model sizes on MC-2B using 224×224 images, without high-resolution adaptation, additional training at a larger image resolution. Web-DINO average VQA increases from 49.01 at 1B parameters to 53.87 at 7B; CLIP scores 52.30, 53.03, 53.22, 52.52, and 52.97 across the same five sizes. Web-DINO exceeds the same-size CLIP average at 5B and 7B parameters.
- The clearest Web-DINO gains occur in OCR & Chart and Vision-Centric VQA. General and Knowledge improvements are smaller, and individual benchmark scores fluctuate.
- CLIP largely saturates after 3B parameters under the tested recipe. The experiment does not establish that other CLIP training configurations would saturate at the same scale.
With images and exposure held fixed, Web-DINO's aggregate score continues to rise while CLIP's score plateaus. The category panels locate the largest Web-DINO gains in OCR & Chart and Vision-Centric tasks, while showing that CLIP retains an OCR & Chart advantage at 2B examples seen.
3.2 Scaling Examples Seen
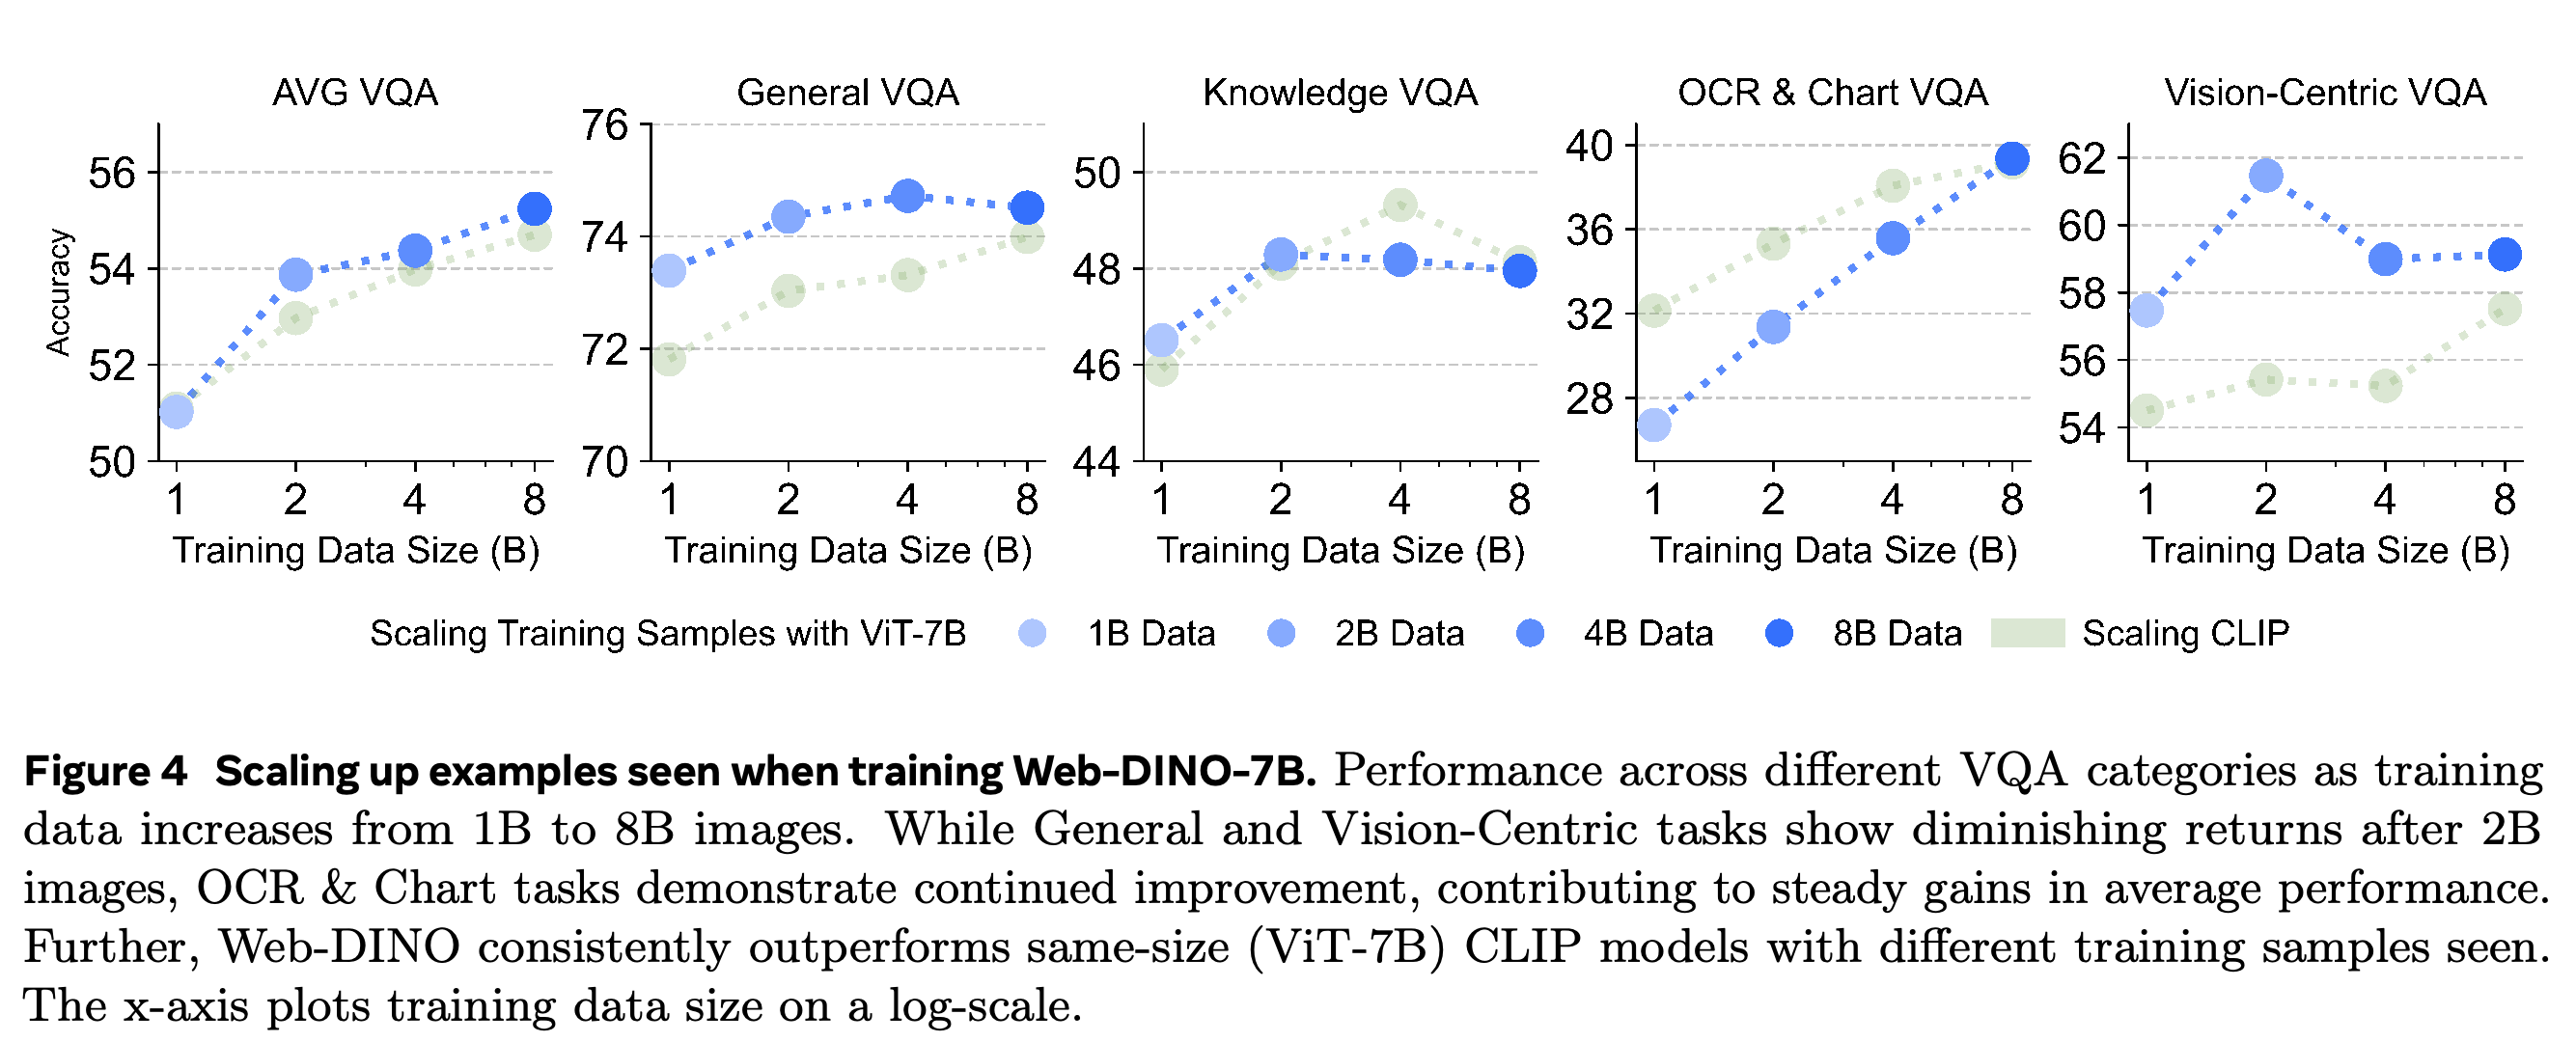
Increasing Web-DINO ViT-7B exposure from 1B to 2B, 4B, and 8B examples raises average VQA from 51.02 to 53.87, 54.37, and 55.24. OCR & Chart improves consistently, while General, Knowledge, and Vision-Centric categories show diminishing returns or fluctuations. Figure 4 reports higher average VQA than same-size CLIP at each matched exposure level.
- Exposure beyond 2B repeats images from MC-2B; it does not expand the dataset to 8B distinct images.
- At 8B examples seen, Web-DINO closes the OCR & Chart gap with the matched CLIP model.
The exposure sweep shows that aggregate improvements increasingly come from OCR & Chart, with smaller or inconsistent gains elsewhere. The horizontal axis counts examples seen, including repeated images, and the matched CLIP curves provide the exposure-controlled comparison.
4 Scaling Analysis and Findings
The analysis tests five questions: whether scaling extends beyond DINOv2, whether it appears on ImageNet, how classic vision tasks respond, why text-related tasks improve, and whether image representations become more aligned with language representations. The experiments examine method generality, dependence on pretraining data, and possible explanations for the VQA gains.
Question 1
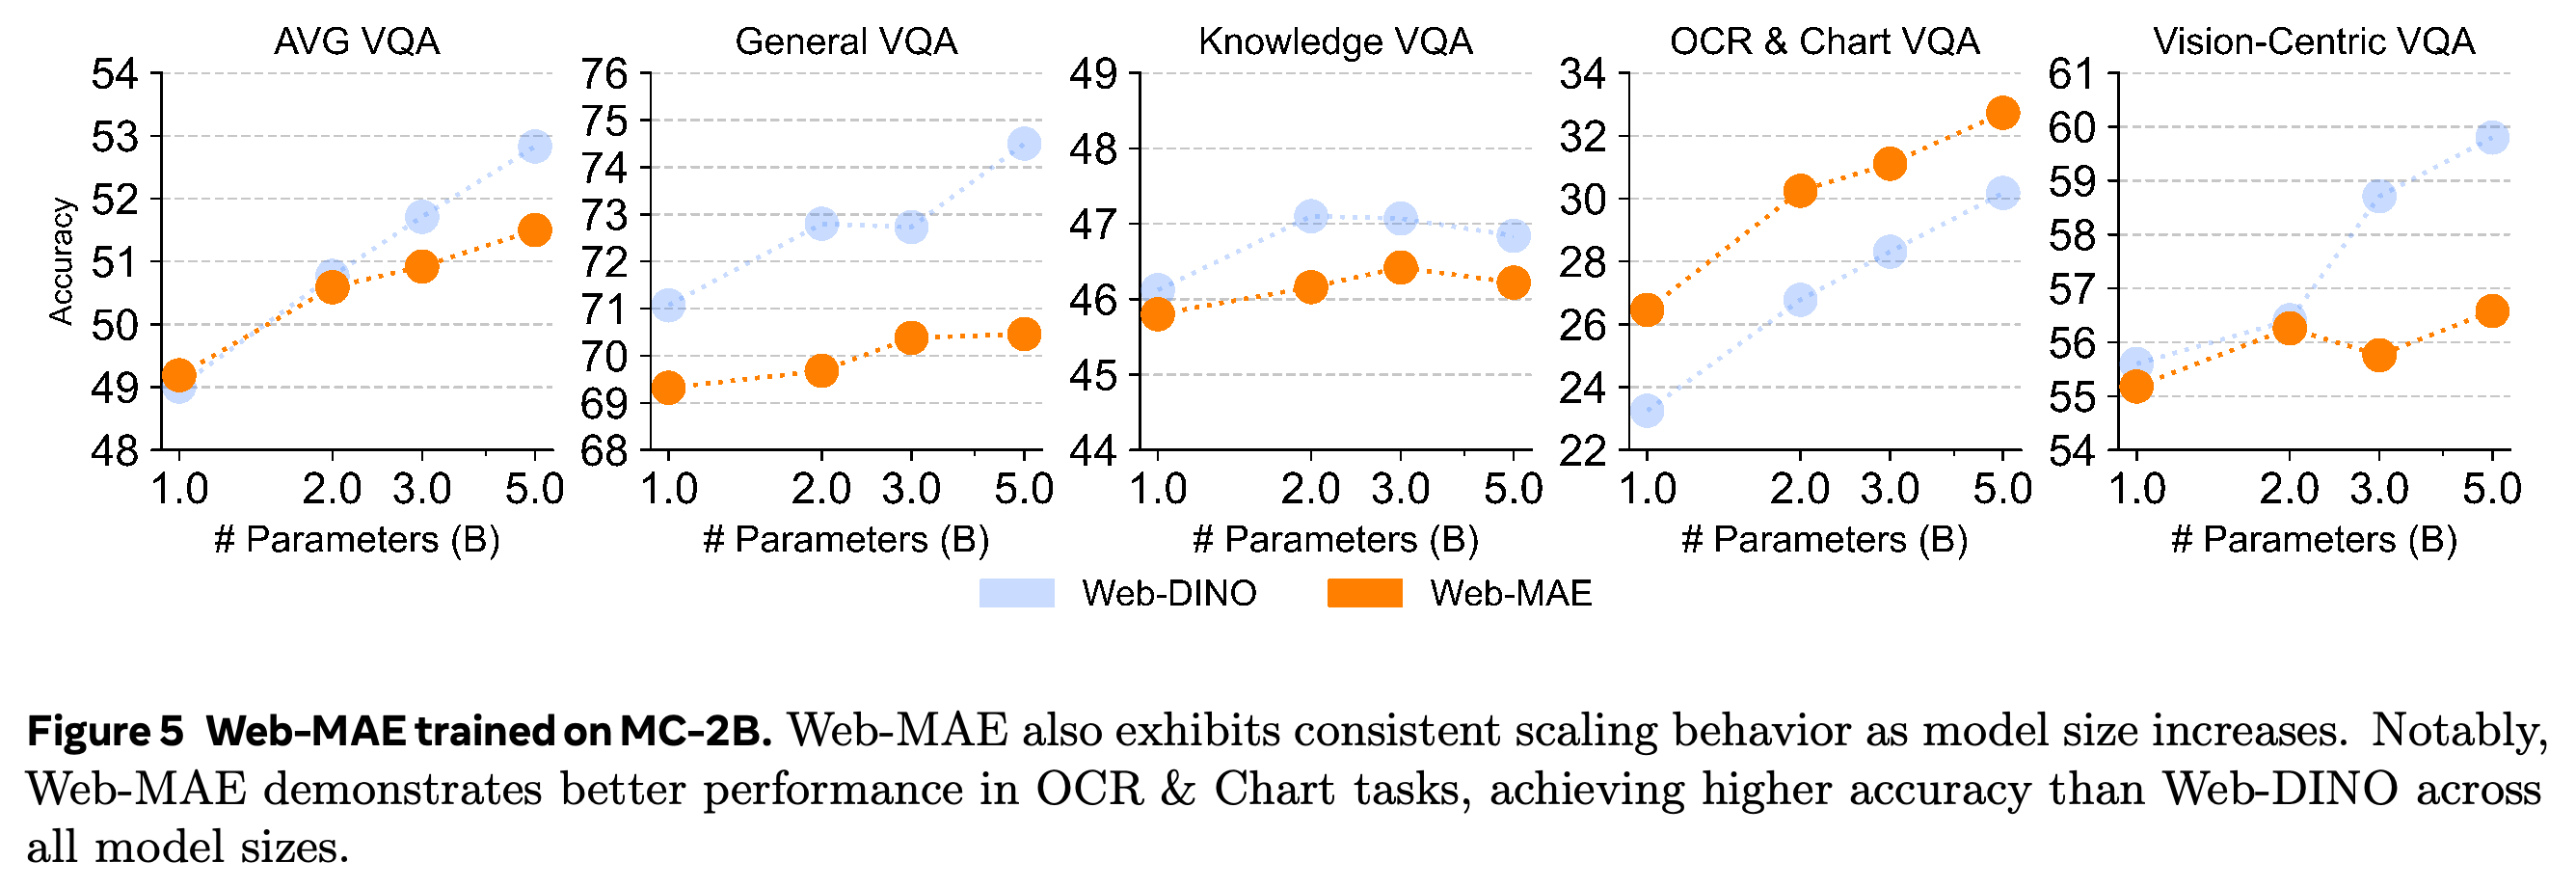
Question 1 examines Masked Autoencoder (MAE), a method that learns by predicting masked visual inputs. Web-MAE trained on MC-2B improves average VQA from 49.19 at 1B parameters to 51.50 at 5B. It outperforms Web-DINO on OCR & Chart at every compared size, while generally trailing it in the other categories.
- The second method shows that the observed scaling behavior extends beyond joint embedding. Its different category profile also shows that the pretraining objective affects the resulting capabilities.
Web-MAE's rising average demonstrates scaling in a second self-supervised method. Its stronger OCR & Chart scores and weaker General scores reveal a different capability profile from Web-DINO despite a shared source dataset.
Question 2
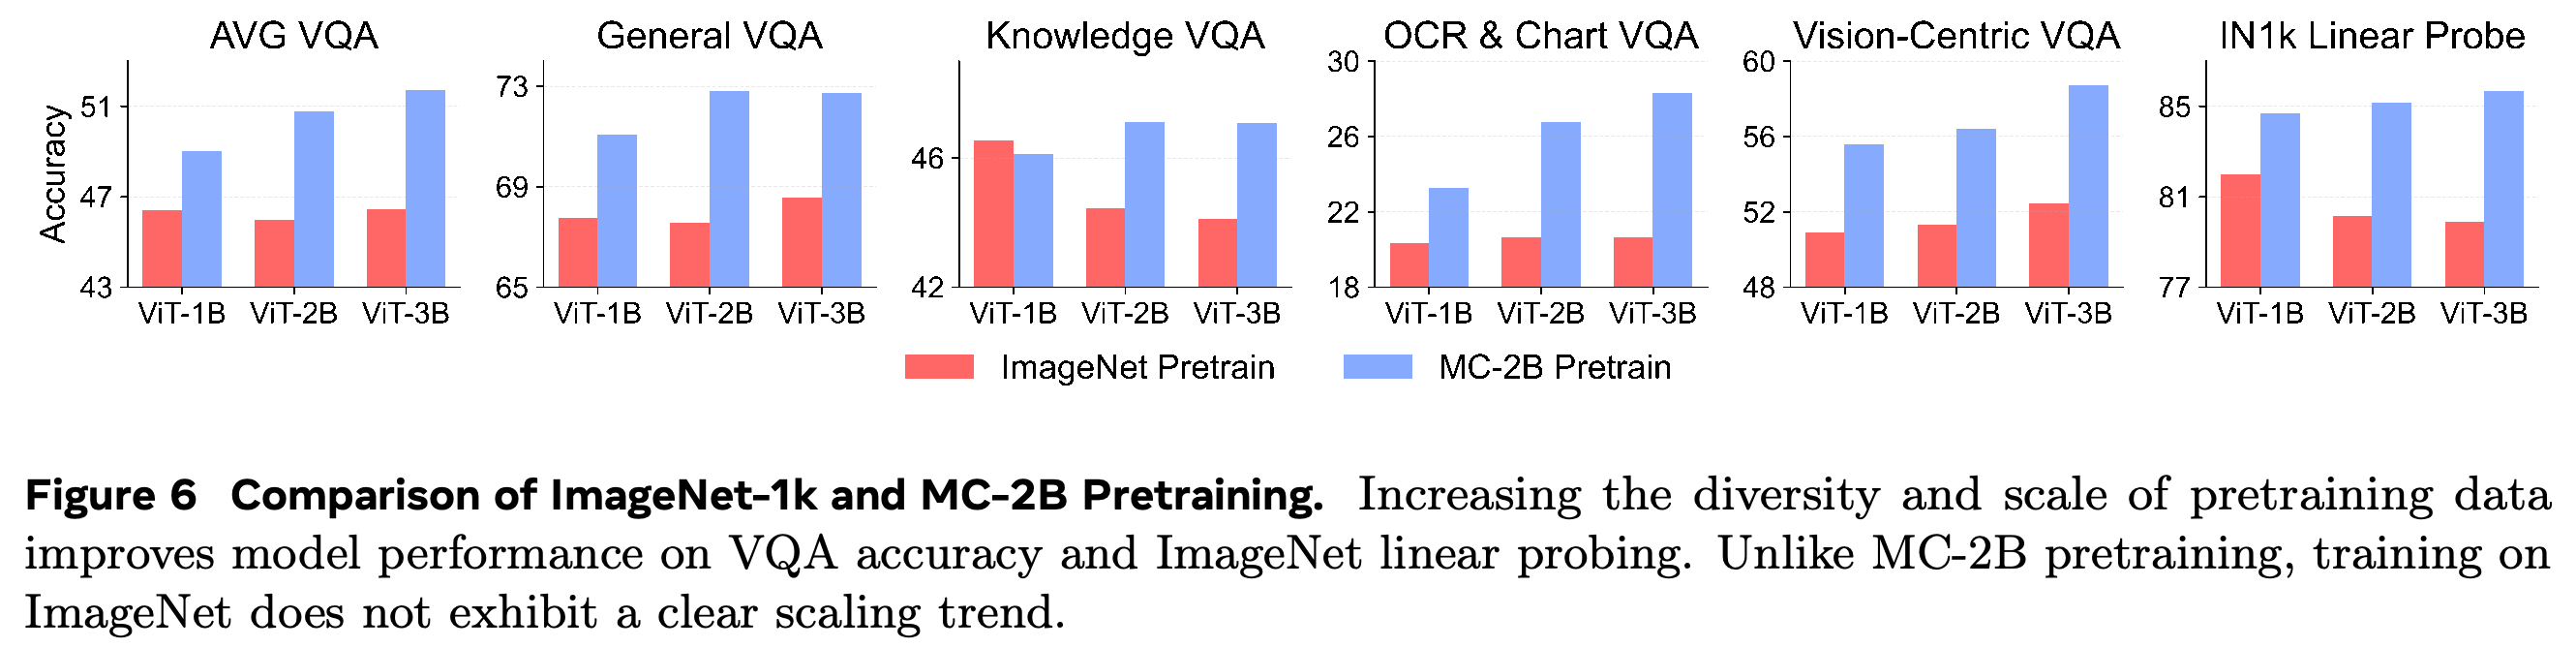
Question 2 compares MC-2B pretraining with ImageNet-1k pretraining for 300 epochs, or passes over the training dataset. Figure 6 compares 1B, 2B, and 3B models and shows stronger overall VQA and ImageNet linear-probe performance with MC-2B; linear probing trains a linear predictor on frozen representations. The ImageNet-pretrained models show no clear improvement in average VQA as model size increases.
- Table 10 additionally includes a 5B ImageNet model: average VQA is 46.39, 45.99, 46.43, and 46.28 across 1B, 2B, 3B, and 5B.
- Dataset size and distribution change together, so this comparison does not independently quantify their contributions.
MC-2B supports an upward aggregate trend that is absent from the ImageNet-pretrained models. Dataset scale and composition both change, so the bars establish dependence on the pretraining data regime without separating those factors; individual category comparisons also contain exceptions to the overall advantage.
Question 3
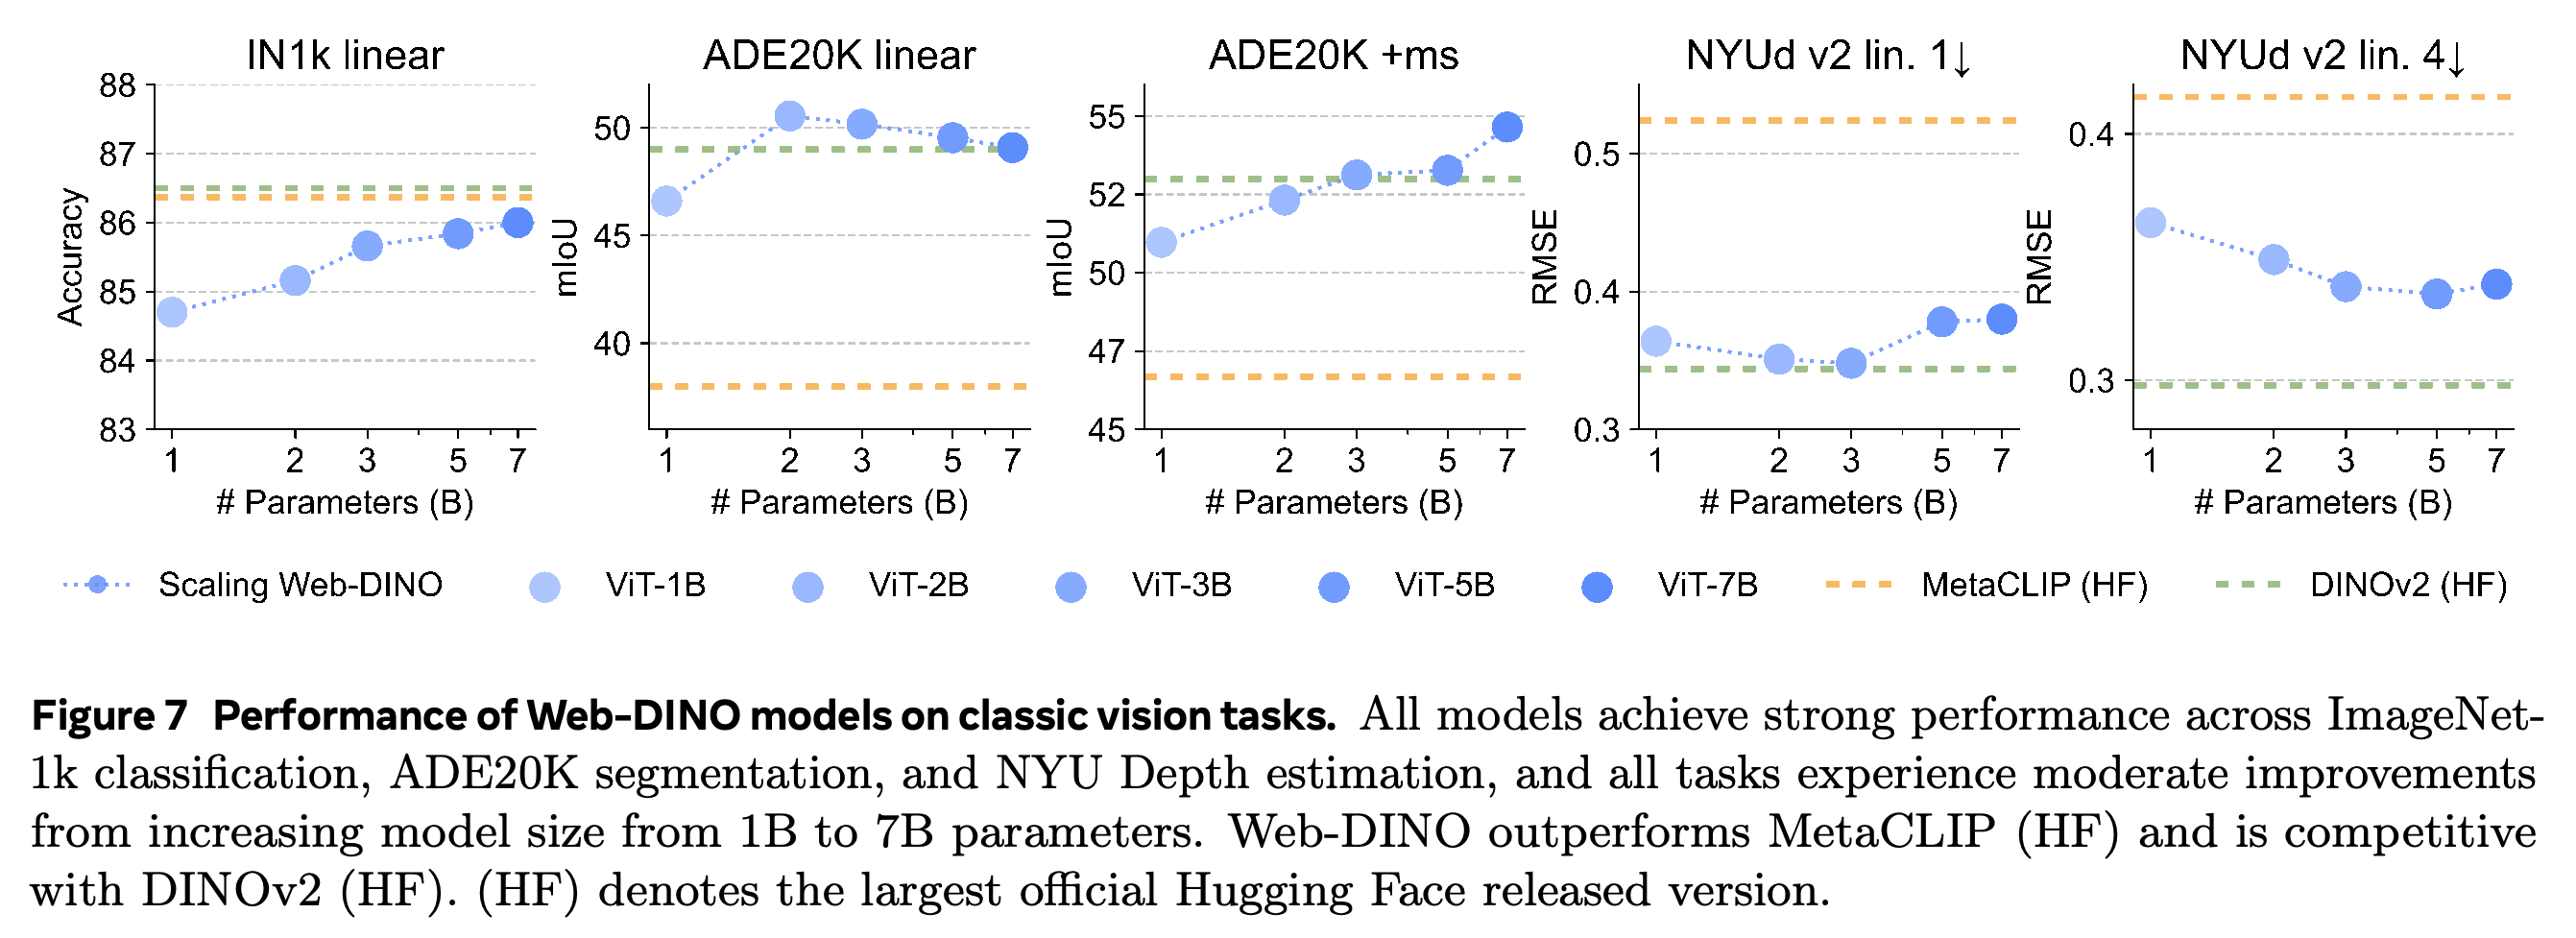
Question 3 evaluates frozen Web-DINO encoders on ImageNet-1k classification, ADE20K semantic segmentation, and NYU Depth v2 depth estimation, predicting distance from an image. Scaling from 1B to 7B raises ImageNet accuracy from 84.70 to 86.00 and ADE20K +ms, an additional segmentation evaluation setting, from 50.97 to 54.65 mean intersection over union, an overlap measure for segmentation predictions. Other metrics are non-monotonic, so the classic vision scaling gains are less consistent than the VQA gains.
- ADE20K linear performance peaks at 50.55 for 2B and falls to 49.08 for 7B. NYU Depth v2 root mean squared error, a prediction-error measure where lower is better, worsens beyond the 3B model.
- Comparisons with released DINOv2 are affected by its high-resolution adaptation and its more carefully curated training distribution.
ImageNet accuracy and ADE20K +ms improve with model size, but ADE20K linear and depth results are non-monotonic. The reference lines show where Web-DINO is competitive with released models; they do not establish uniform superiority across the five metrics.
Question 4
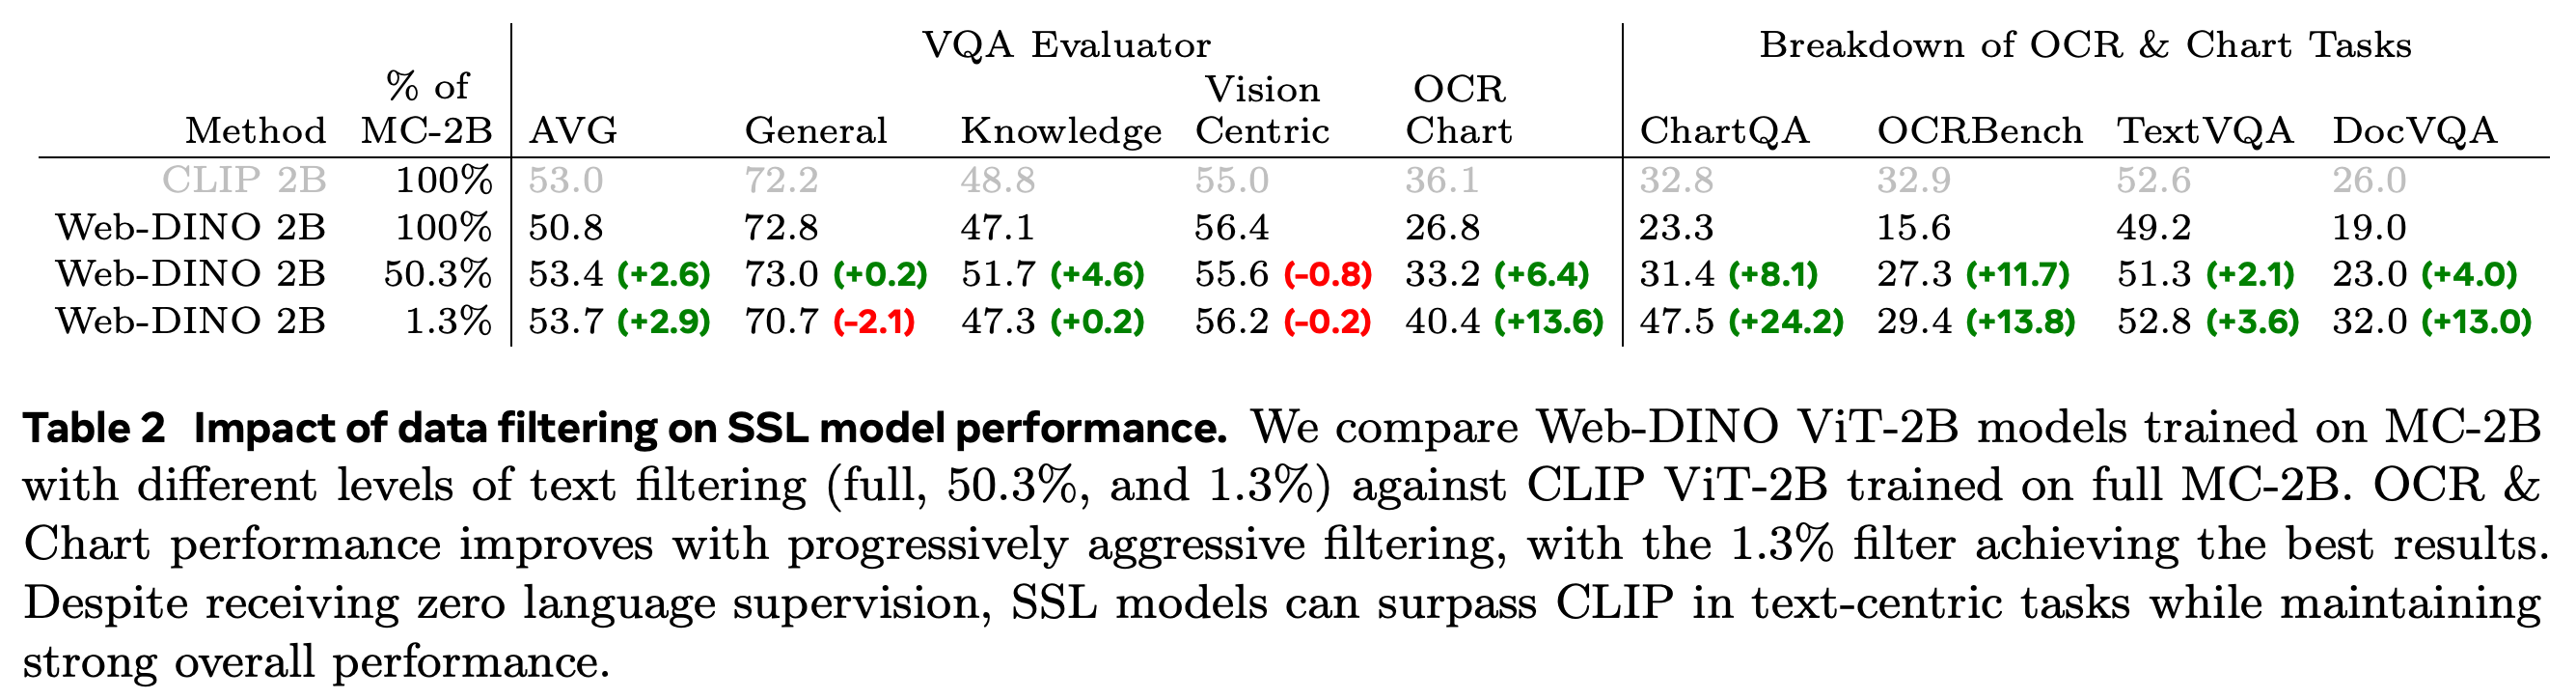
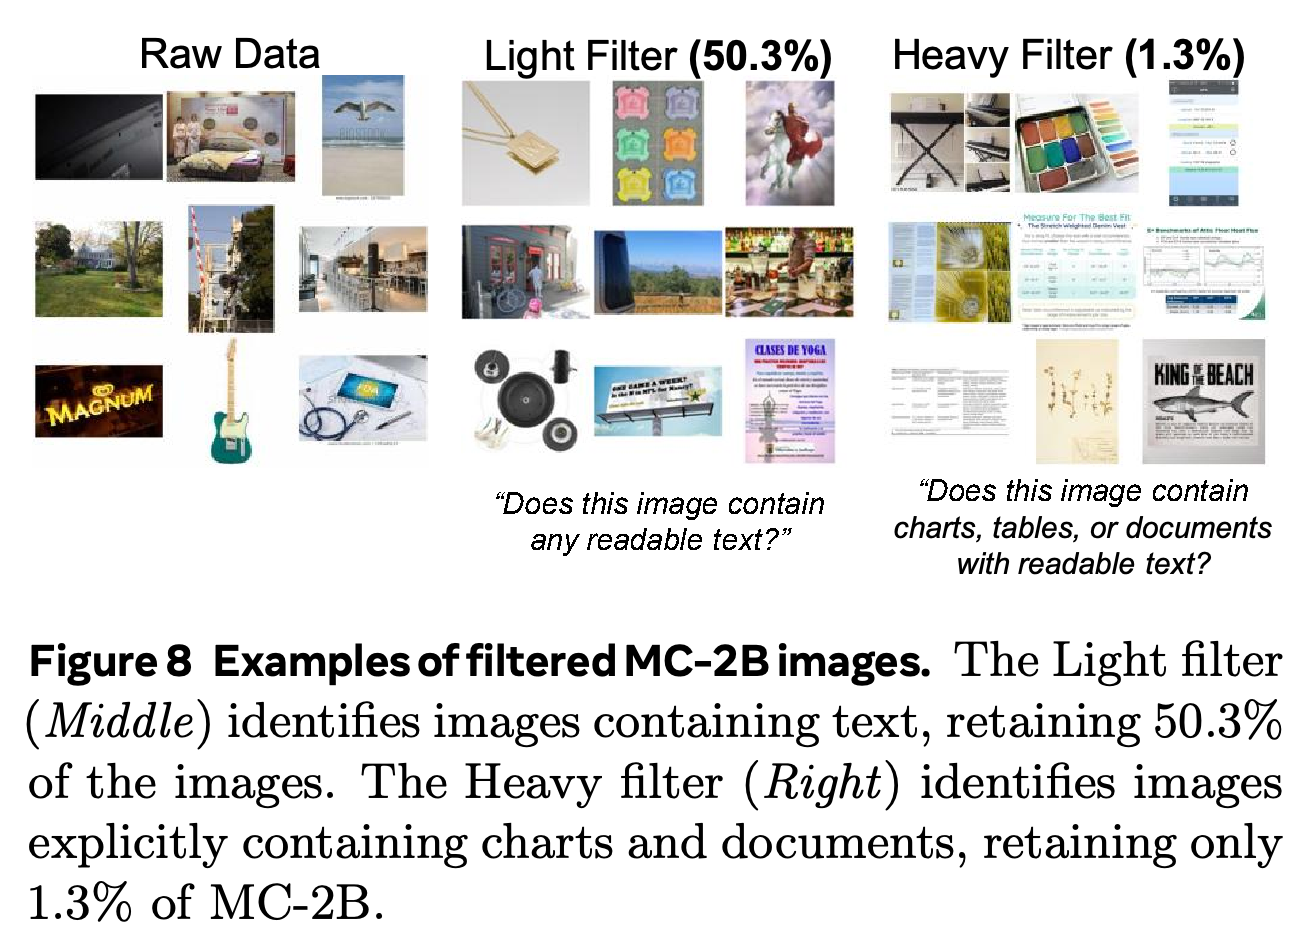
Question 4 tests whether text already present in web images helps explain stronger OCR & Chart performance. SmolVLM2, a pretrained model that processes images and language, selects a Light subset containing readable text and a Heavy subset containing charts, tables, or documents with readable text; these retain 50.3% and 1.3% of MC-2B. Each Web-DINO ViT-2B experiment still sees 2B examples, requiring repeated training on the filtered subsets.
- Table 2 reports OCR & Chart scores of 26.8 for unfiltered Web-DINO, 33.2 for Light filtering, and 40.4 for Heavy filtering, versus 36.1 for full-data CLIP.
- Heavy filtering raises average VQA from 50.8 to 53.7 in the rounded table, while General falls from 72.8 to 70.7. Table 13 gives the corresponding unrounded averages as 50.77 and 53.65.
- The retained 1.3% reduces the number of unique source images, while training exposure remains fixed. Language-model involvement in image selection is separate from the image-only vision pretraining objective.
At a fixed 2B-example exposure budget, Heavy filtering raises OCR & Chart from 26.8 to 40.4 and exceeds full-data CLIP's 36.1. General falls from 72.8 to 70.7, exposing a category tradeoff; the retained 1.3% describes unique source data rather than a proportional reduction in training exposure.
The examples illustrate how Light filtering enriches ordinary images containing text, whereas Heavy filtering concentrates charts and documents. They clarify the distribution shift evaluated quantitatively in Table 2 without measuring filtering accuracy.
Question 5
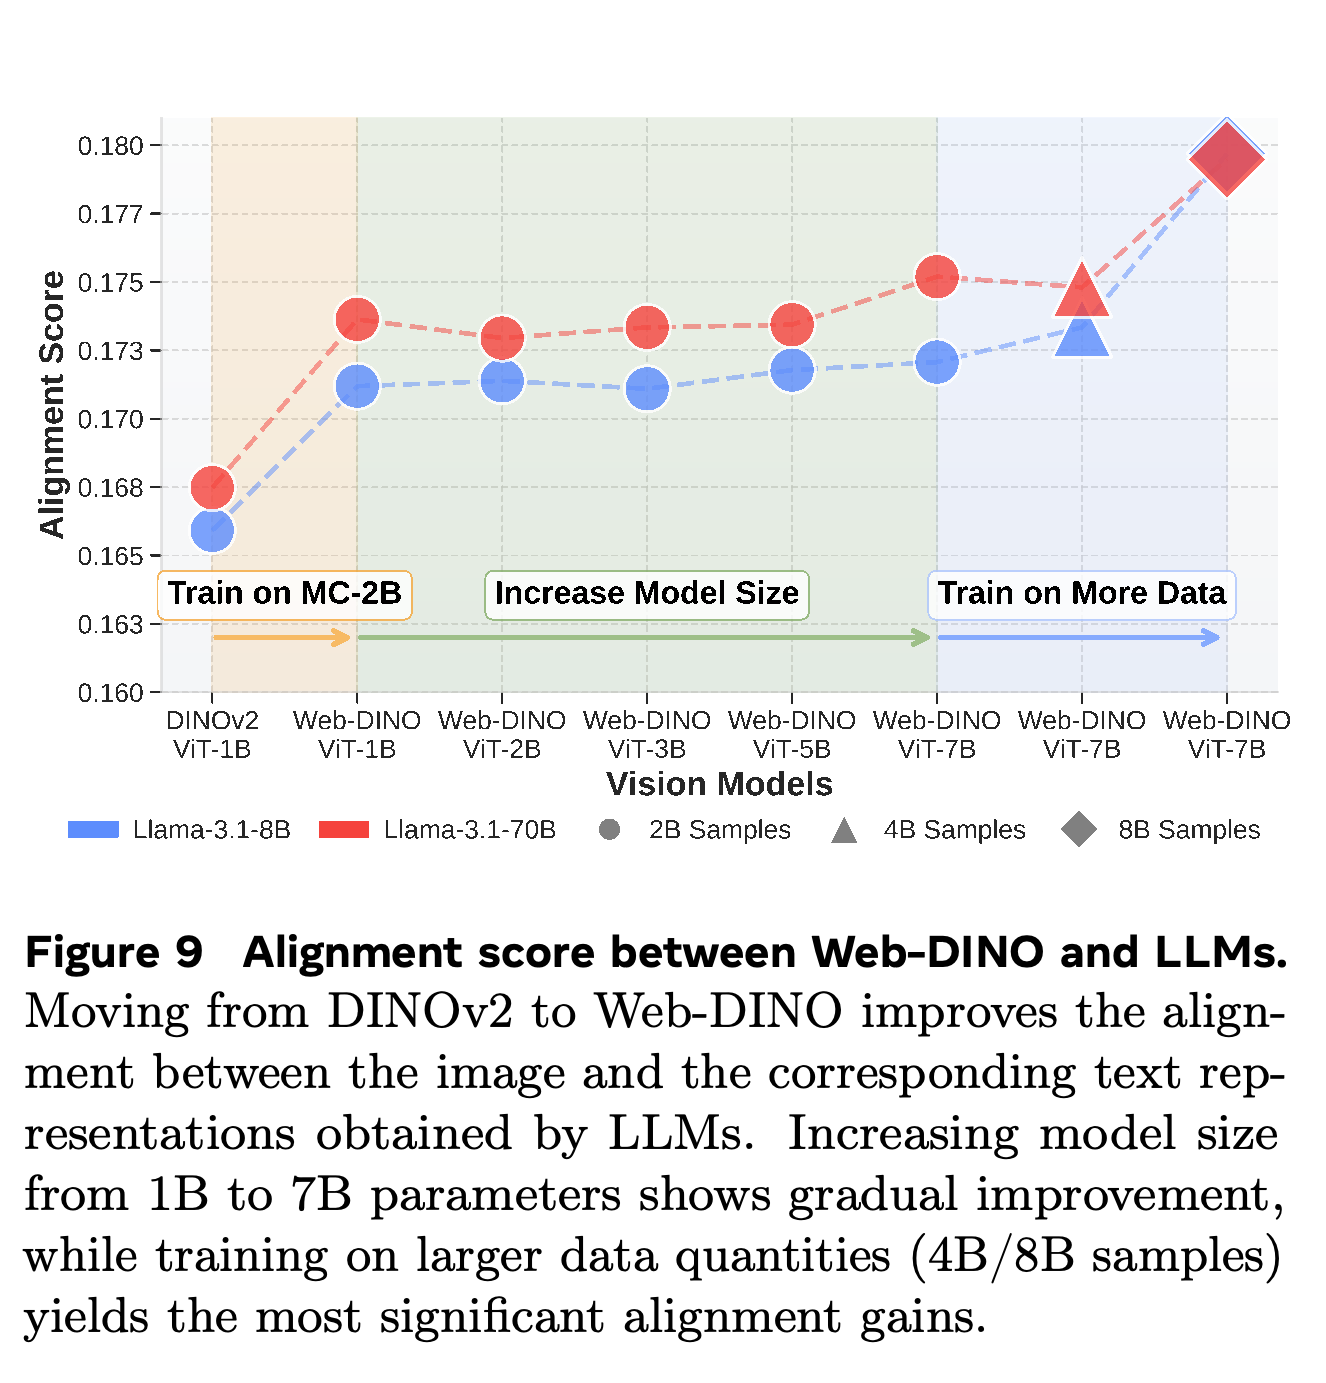
Question 5 measures representational alignment, similarity between image and corresponding text representations, using Wikipedia Captions image-text pairs. Following Huh et al. (2024), the analysis compares DINOv2 and Web-DINO against Llama-3.1 8B and 70B without visual instruction tuning or a learned alignment procedure. Figure 9 shows improved alignment when switching to MC-2B, modest changes with model size, and the highest alignment at 8B examples seen.
- These associations support the hypothesis that visual scaling produces more language-compatible features. They do not establish that alignment causes the downstream VQA improvements.
Alignment improves when replacing released DINOv2 with web-trained Web-DINO and reaches its highest values after 8B examples seen for both language-model references. Fluctuations across model sizes make the exposure effect clearer than a strictly monotonic capacity effect.
5 The Web-SSL Model Family
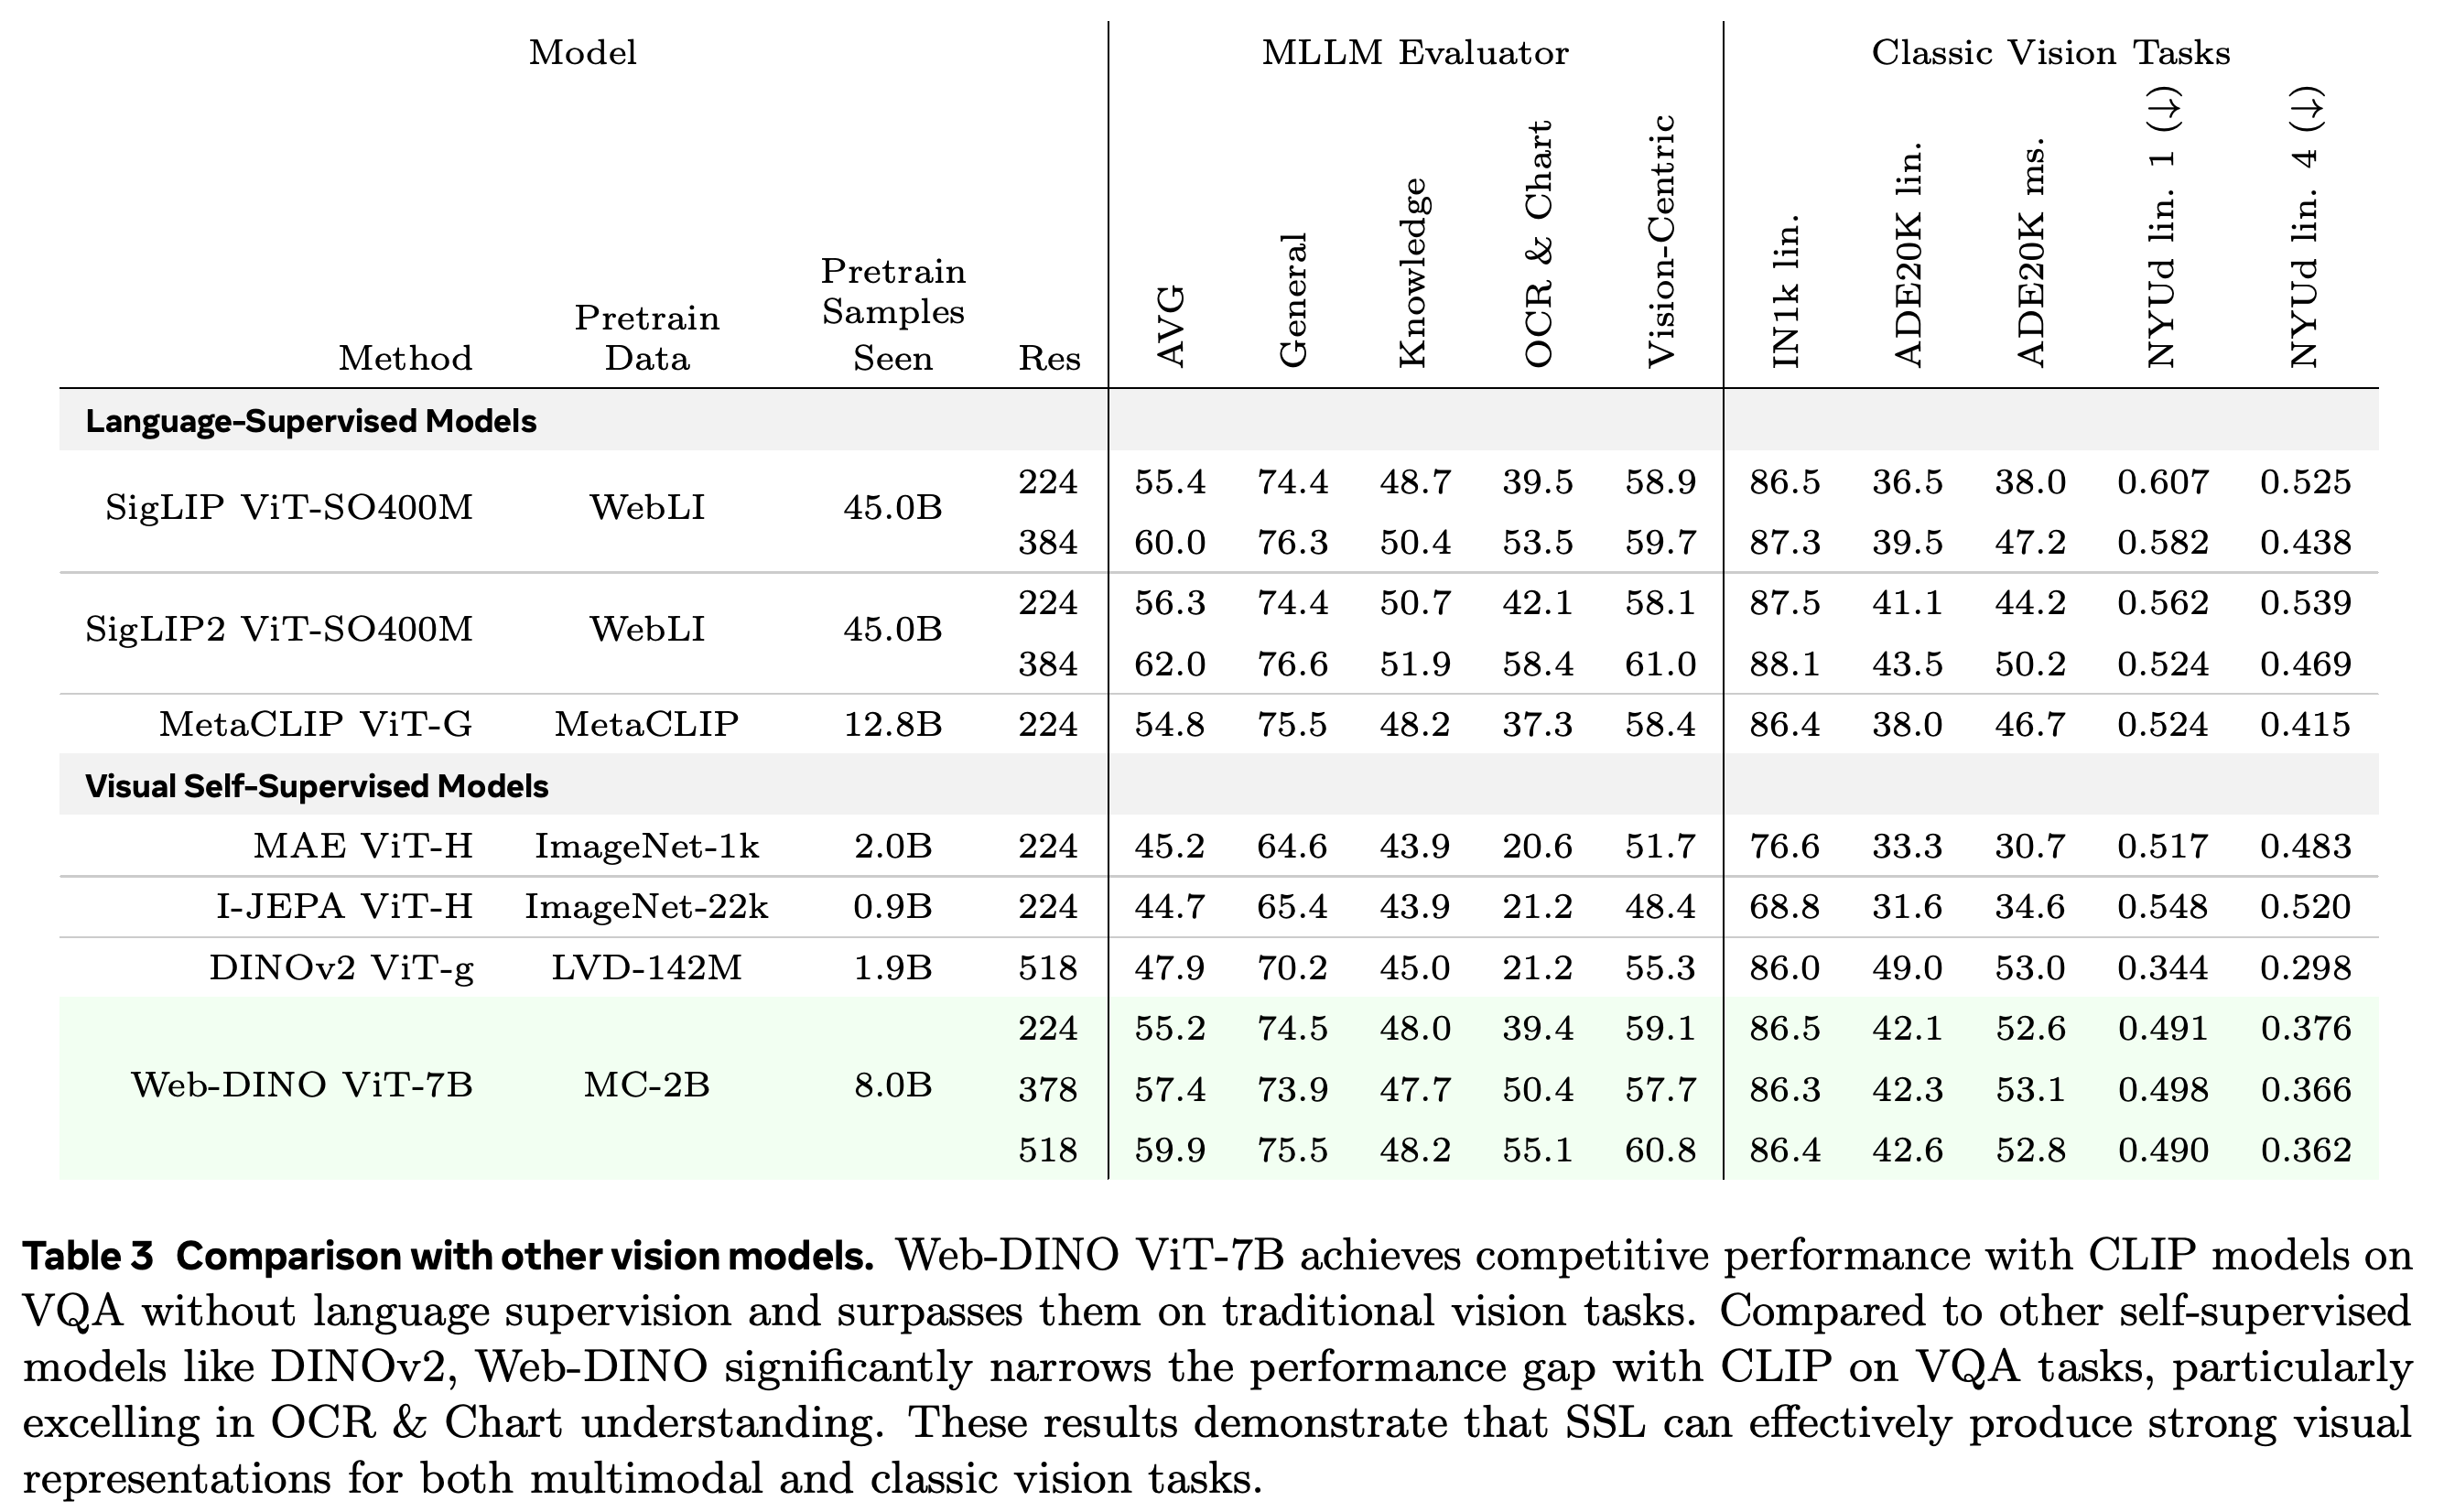
The best Web-DINO ViT-7B model, trained with 8B examples seen, scores 55.2 average VQA at 224-pixel resolution, compared with 55.4 for SigLIP and 56.3 for SigLIP2, two released language-supervised image encoders, in Table 3. Those baselines see 45.0B pretraining examples but use substantially smaller vision encoders, so the comparison is not matched for model capacity or compute. Web-DINO has better depth results than these baselines and generally stronger segmentation results, with some exceptions.
- High-resolution adaptation increases average VQA to 57.43 at 378×378 and 59.91 at 518×518. OCR & Chart reaches 55.1 at 518 pixels in Table 3.
- At 384 pixels, SigLIP and SigLIP2 score 60.0 and 62.0 average VQA. Web-DINO at 518 pixels approaches SigLIP’s score but remains below SigLIP2, with different input resolution and model size.
- The evaluation freezes the vision encoder and omits image tiling, processing an image through multiple crops, and additional spatial feature aggregation to emphasize encoder comparisons.
The table combines VQA and classic vision results with dataset, exposure, and resolution information. Web-DINO is close to the 224-pixel language-supervised baselines on average VQA, but those comparisons differ in encoder size; at higher resolution, Web-DINO approaches SigLIP while remaining below SigLIP2's average.
6 Related Work
The related work connects Web-SSL to joint embedding and masked image modeling, large-scale visual pretraining datasets, and vision-encoder evaluation through VQA. Its contribution is a controlled scaling study using established training methods. The experiments show that both the image distribution and the learning objective affect the capabilities measured downstream.
7 Limitations
Vision-only encoders do not directly support zero-shot image classification, classification without task-specific training, through the image-text matching interface available to CLIP. The VQA findings use only Llama-3 8B Instruct for downstream instruction tuning; similar results with other language backbones remain a hypothesis. Larger or uncurated pretraining datasets are also outside the study.
- The central experiments match images, model size, and downstream evaluation, but do not establish equal training compute: the methods use different objectives, batch sizes, and training recipes.
- Tables 7 and 9 show that stronger VQA does not imply uniform gains across classic vision metrics.
8 Discussion
The discussion argues that large visual encoders can learn features useful for multimodal models without language-supervised pretraining objectives. The evidence establishes this result for the tested MetaCLIP distribution, model range, and downstream evaluation. The authors’ proposal to pursue less supervision is a research direction, rather than a demonstrated advantage across settings.
Appendix
- A Implementation Details: Training uses the official DINOv2 and MAE repositories and the MetaCLIP codebase, with Fully Sharded Data Parallel, a method for distributing model training across devices. Table 4 lists batch size/learning rate/warmup as 3072/3.5e-4/100K for Web-DINO, 4096/1.6e-3/80K for Web-MAE, and 32768/4e-4/2K for CLIP; warmup gradually increases the learning rate at the start of training. MAE’s learning rate is reduced from 2.4e-3 to address instability at larger sizes. VQA uses Cambrian alignment data followed by Cambrian-7M, excluding images from the LAION web image-text dataset, with final-layer image features interpolated to 576 tokens, the feature sequence supplied to the adapter. Table 5 specifies adapter and instruction-tuning learning rates of 1.00e-5 and 4.00e-5, respectively, batch size 512, and zero weight decay, a parameter regularization setting. The appendix also describes the model architectures, frozen-encoder classic vision evaluation, and the text-filtering prompts used to select readable text or charts, tables, and documents.
- B Full Results: The appendix supplies benchmark-level results underlying the model-scaling, exposure-scaling, pretraining-distribution, text-filtering, and released-baseline comparisons. Improving aggregate VQA can coexist with declines on individual benchmarks or classic vision tasks.
- B.1 Web-DINO: Tables 6–10 summarize scaling behavior, classic vision results, additional examples seen, and ImageNet pretraining. Increasing ViT-7B exposure from 2B to 8B improves ImageNet accuracy from 86.00 to 86.52 but reduces ADE20K linear performance from 49.08 to 42.14 and worsens NYU Depth v2 lin. 1 error from 0.380 to 0.491. The lin. 1 and lin. 4 labels identify the paper’s two depth evaluation settings.
- B.2 Web-MAE: Table 11 gives the full 1B, 2B, 3B, and 5B results, with average VQA scores of 49.19, 50.59, 50.92, and 51.50. ChartQA, a chart question-answering benchmark, rises from 23.60 to 33.80, and OCRBench, an OCR evaluation benchmark, rises from 16.40 to 26.50, supporting the text-related improvements discussed in Question 1.
- B.3 Scaled CLIP Models: Table 12 reports MetaCLIP trained with 2B examples seen at each model size. Average VQA peaks at 53.22 for ViT-3B and reaches 52.97 for ViT-7B, showing no continued aggregate improvement under this training recipe.
- B.4 Text Filtered Models: Table 13 includes both 1B and 2B Web-DINO models under no filtering, Light filtering, and Heavy filtering. Heavy filtering raises the 1B average from 49.01 to 49.44, whereas Light filtering reaches 50.73; for the 2B model, Heavy filtering achieves the highest average, 53.65. The aggregate benefit of stronger text enrichment therefore depends on model size.
- B.5 Baseline Models: Table 14 provides individual VQA benchmark scores for released MetaCLIP, SigLIP, SigLIP2, DINOv2, I-JEPA, a visual SSL baseline, and MAE encoders. It also reports DINOv2 at 224, 378, and 518 pixels, with average scores of 49.25, 47.94, and 47.91. Higher input resolution alone does not improve VQA for every evaluated encoder.
- C High Resolution Adaption of Web-SSL: The appendix specifies adaptation at 378×378 and 518×518 for 20k iterations, batch size 2048, and learning rate 1.41e-5. The same paragraph later refers to a total of 10k iterations when describing the warmup ratio, leaving an internal ambiguity in the schedule. Table 15 reports the detailed results at each resolution.
- D Evaluation: Table 16 lists the 16 VQA benchmarks and three classic vision datasets. General comprises GQA, SEED, MME, and MMBench; Knowledge comprises AI2D, ScienceQA, MathVista, and MMMU; these are the benchmark identifiers assigned to the suite’s general and knowledge question-answering categories. OCR & Chart comprises TextVQA for text in images, DocVQA for documents, ChartQA, and OCRBench; Vision-Centric comprises MMVP, RealWorldQA, CVBench-2D, and CVBench-3D, the suite’s visual perception benchmarks. Classic vision evaluation uses ImageNet-1k for classification, ADE-20k for segmentation, and NYU Depth v2 for depth estimation.
- E Pretraining Dataset Cards: Table 17 documents LVD-142M, the curated training dataset used by released DINOv2, totaling 142,109,386 images and drawing on sources aligned with classification, segmentation, depth, and retrieval tasks. MetaCLIP instead uses web data from 15 CommonCrawl snapshots spanning January 2021 through January 2023. This difference prevents released DINOv2 comparisons from isolating the pretraining objective.
Brief Thoughts
The comparison on shared images provides the clearest evidence that paired language supervision is unnecessary for competitive multimodal vision features under the tested downstream setup. The gains use large encoders and substantial training exposure, and the appendix shows segmentation and depth tradeoffs as exposure increases. Text filtering offers a concrete way to change the learned capabilities, although it retains language-model involvement in data selection.