


Beyond Language Modeling: An Exploration of Multimodal Pretraining | Summary
03 Mar 2026 | Paper Review Multimodal Pretraining Representation Autoencoders Mixture-of-Experts Scaling LawsContents
- Summary
- 1 Introduction
- 2 Experiment Setup
- 3 Visual Representations for Unified Multimodal Pretraining
- 4 Understanding the Impact of Data
- 5 Towards World Modeling in Unified Multimodal Models
- 6 Unified Multimodal Architecture Design
- 7 Scaling Laws for Unified Multimodal Models
- 8 Related Work
- 9 Discussion
- Appendix
- Brief Thoughts
This article explains the key points of Beyond Language Modeling: An Exploration of Multimodal Pretraining.
- 2026-03-03 (arXiv)
- Tong, Shengbang, Fan, David, Nguyen, John, Brown, Ellis, Zhou, Gaoyue, Qian, Shengyi, Zheng, Boyang, Vallaeys, Théophane, Han, Junlin, Fergus, Rob, et al.
- FAIR, Meta, New York University
- Paper
- Project Page
Summary
- Beyond Language Modeling: An Exploration of Multimodal Pretraining studies how visual representations, data mixtures, architecture, and compute allocation affect unified vision-language models. Controlled experiments train the Transformer backbone from scratch using Transfusion-style next-token prediction for language and flow matching for visual generation, while retaining frozen pretrained visual encoders and pretrained decoders.
- A single Representation Autoencoder (RAE) based on SigLIP 2 supports both visual understanding and generation more effectively than the tested VAE alternatives. Diverse pretraining improves downstream VQA and navigation relative to increasing task-specific data in several controlled comparisons, although multimodal mixtures introduce modest out-of-distribution language costs.
- Fine-grained Mixture-of-Experts (MoE) routing improves both modalities at approximately fixed active parameter counts and develops modality-dependent expert usage. IsoFLOP fits assign vision a higher training-data scaling exponent than language; MoE narrows the fitted exponent gap from 0.10 to 0.05 rather than eliminating it.
1 Introduction
The study seeks to separate capabilities learned through unified multimodal pretraining from those inherited from a pretrained language backbone. The authors initialize the Transformer from scratch and investigate five axes: visual representation, data, world modeling, architecture, and scaling.
- The motivation is that visual observations contain spatial and temporal information not fully represented in text, while high-quality text resources are finite.
- The experiments examine pretraining dynamics rather than fully post-trained assistants. The project page is https://beyond-llms.github.io/.
2 Experiment Setup
Compute budgets and training hyperparameters are controlled within each ablation family. Unless otherwise specified, evaluation occurs immediately after pretraining without instruction tuning; VQA uses subsequent supervised finetuning.
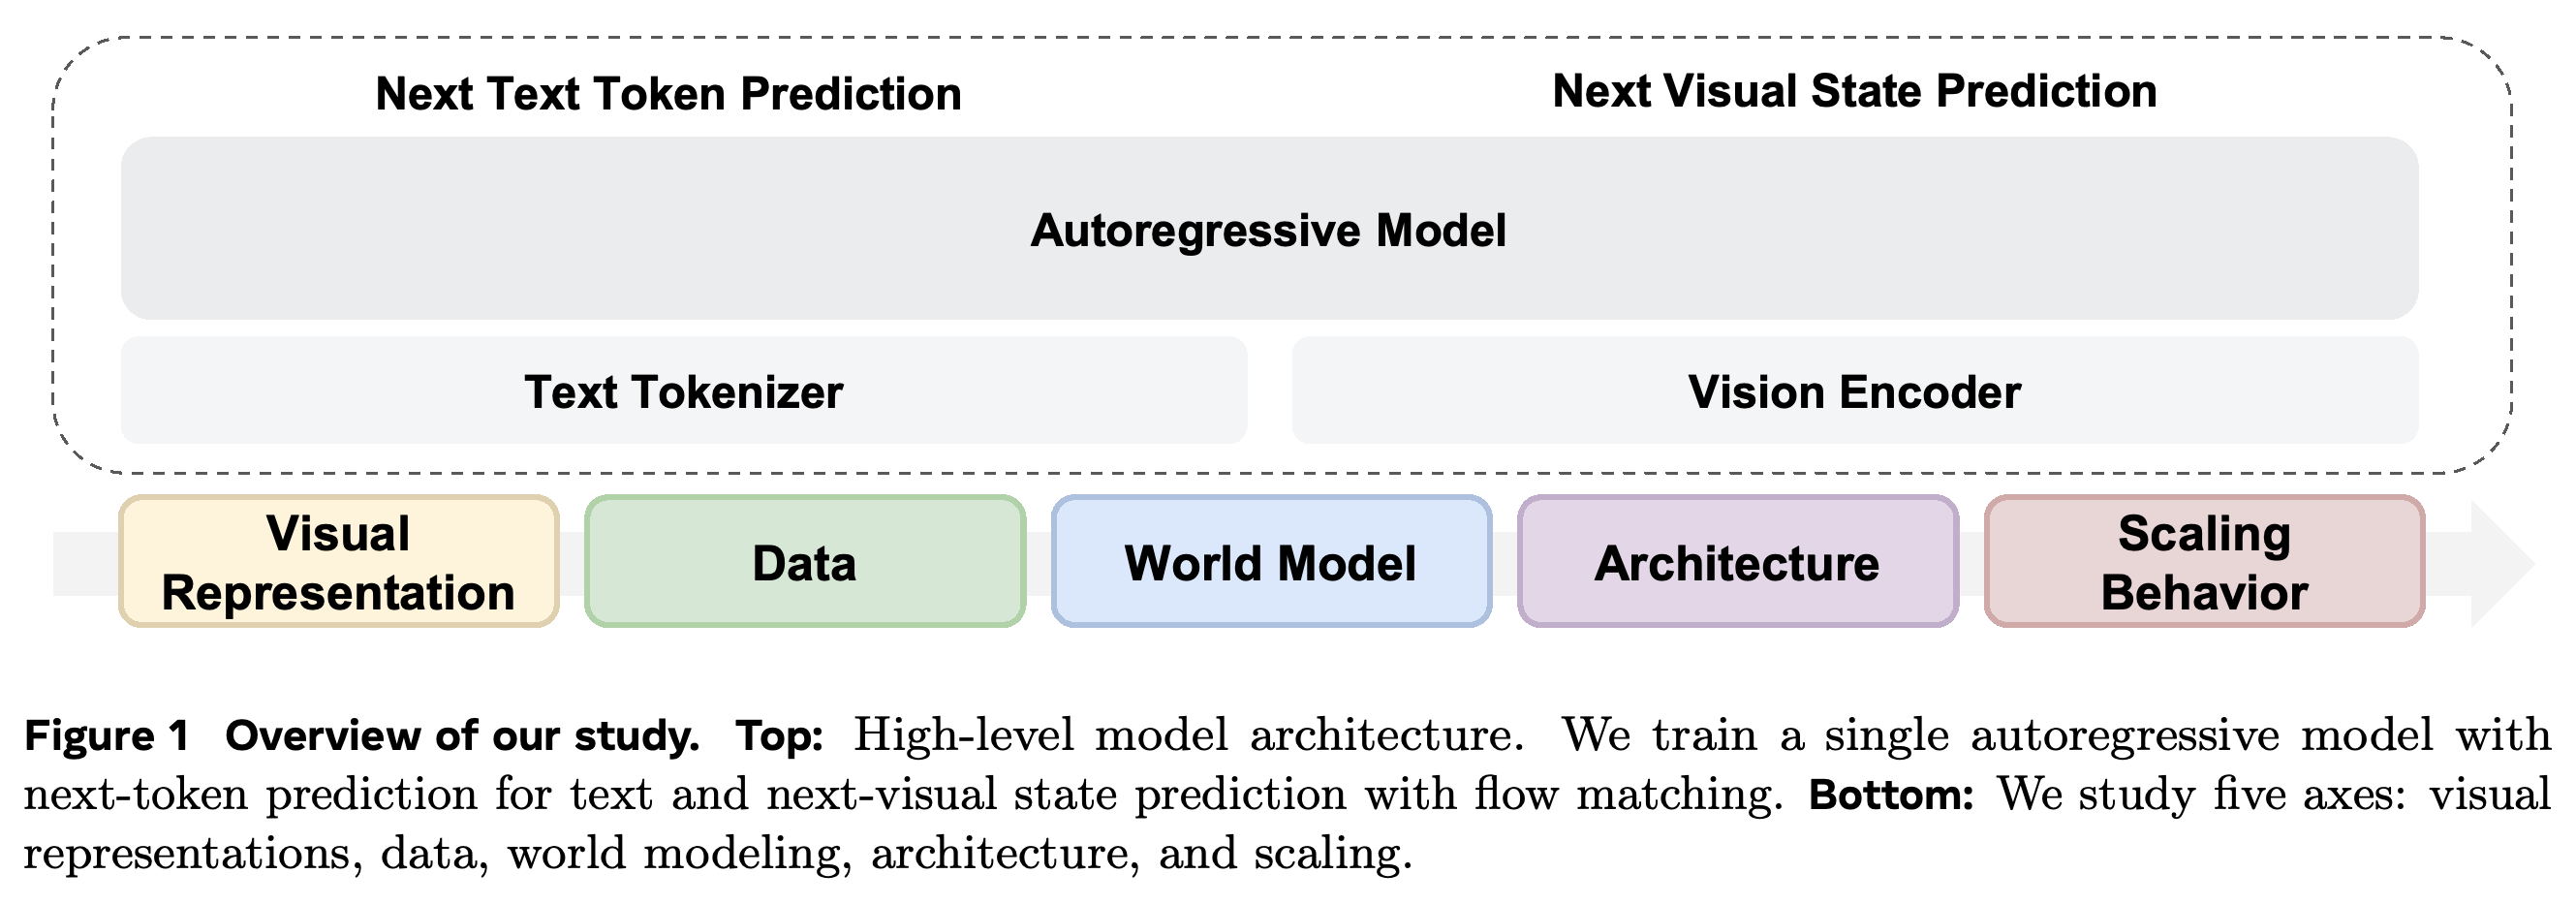
- Figure 1 summarizes the shared sequential model and the five experimental axes.
- The 57B-token MoE sweeps, approximately 1T-token representation studies, and 200B-token navigation-mixture studies use distinct training regimes and should not be compared as a single controlled experiment.
The diagram separates tokenization from the shared sequential backbone, showing how representation, data, architecture, and scaling can be varied within one framework. Text prediction and visual-state prediction use distinct objectives within the same model.
2.1 Training and Inference
Language training minimizes autoregressive cross-entropy, L_LM = −Σ_i log p_θ(x_i | x_<i). Visual training samples Gaussian noise ε and a frame-wise timestep t ∼ U[0, 1], constructs z_t = (1 − t)ε + tz_0, and minimizes L_flow = E[||v_θ(z_t, t, context) − (z_0 − ε)||²₂]. The joint objective is L = λ_LM L_LM + λ_flow L_flow, with default weights λ_LM = 1.0 and λ_flow = 3.0.
- All tokens within an image or frame share one noise timestep, sampled independently across frames. The noise schedule is shifted toward noisier inputs for high-dimensional representations; later experiments also test direct clean-latent prediction, or x-pred.
- FlexAttention implements causal attention for text and block-wise causal attention for vision: patches within a frame attend bidirectionally, while access to earlier text and frames remains causal.
- Visual inference uses a 25-step Euler sampler followed by a pretrained decoder. Conditioning is dropped 10% of the time during training, and image-generation evaluations use a fixed classifier-free guidance scale of 3.0.
2.2 Model and Tokenization
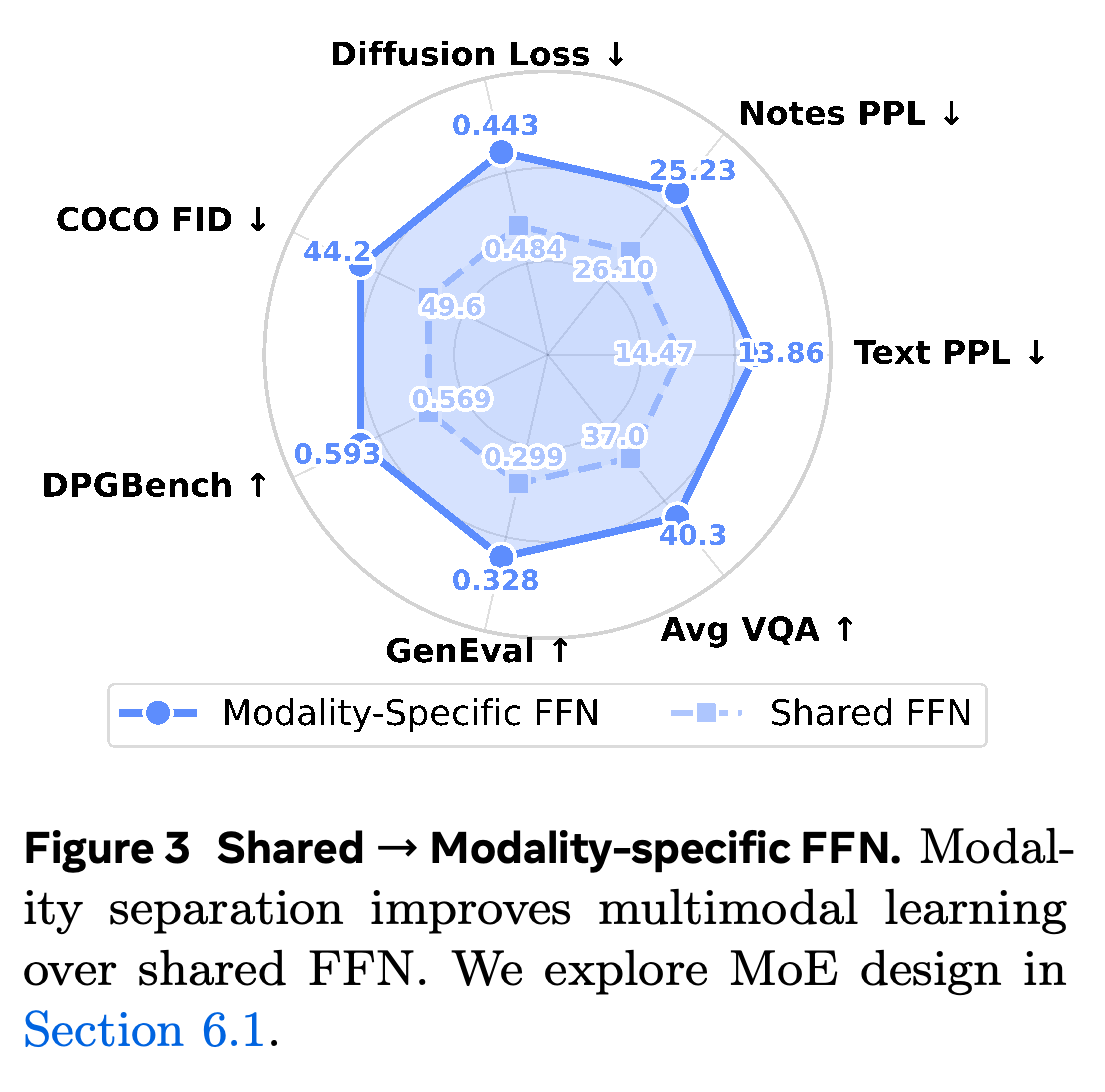
The default decoder-only Transformer uses linear visual input/output projections and separate text and vision FFNs within shared attention blocks. It has 2.3B total parameters but activates 1.5B per token, compared with 1.5B total and active parameters for the shared-FFN baseline.
- LLaMA-3 BPE tokenizes text. Frozen visual encoders map images and individual video frames into continuous latent tokens; SigLIP 2 So400M is the default.
- Figure 3 shows improvements across all reported metrics with modality-specific FFNs, including DCLM PPL from 14.47 to 13.86 and average VQA accuracy from 37.0% to 40.3%.
- The main description specifies 224×224 frames. Appendix E.4 and Table 4 distinguish 224×224 RAE and raw-pixel inputs from 256×256 VAE inputs, whose latent grids are rearranged to maintain 256 visual tokens.
Modality-specific FFNs improve language perplexity, diffusion loss, generation metrics, and VQA together. The comparison increases total capacity while keeping only one modality-specific FFN active per token.
2.3 Data Sources
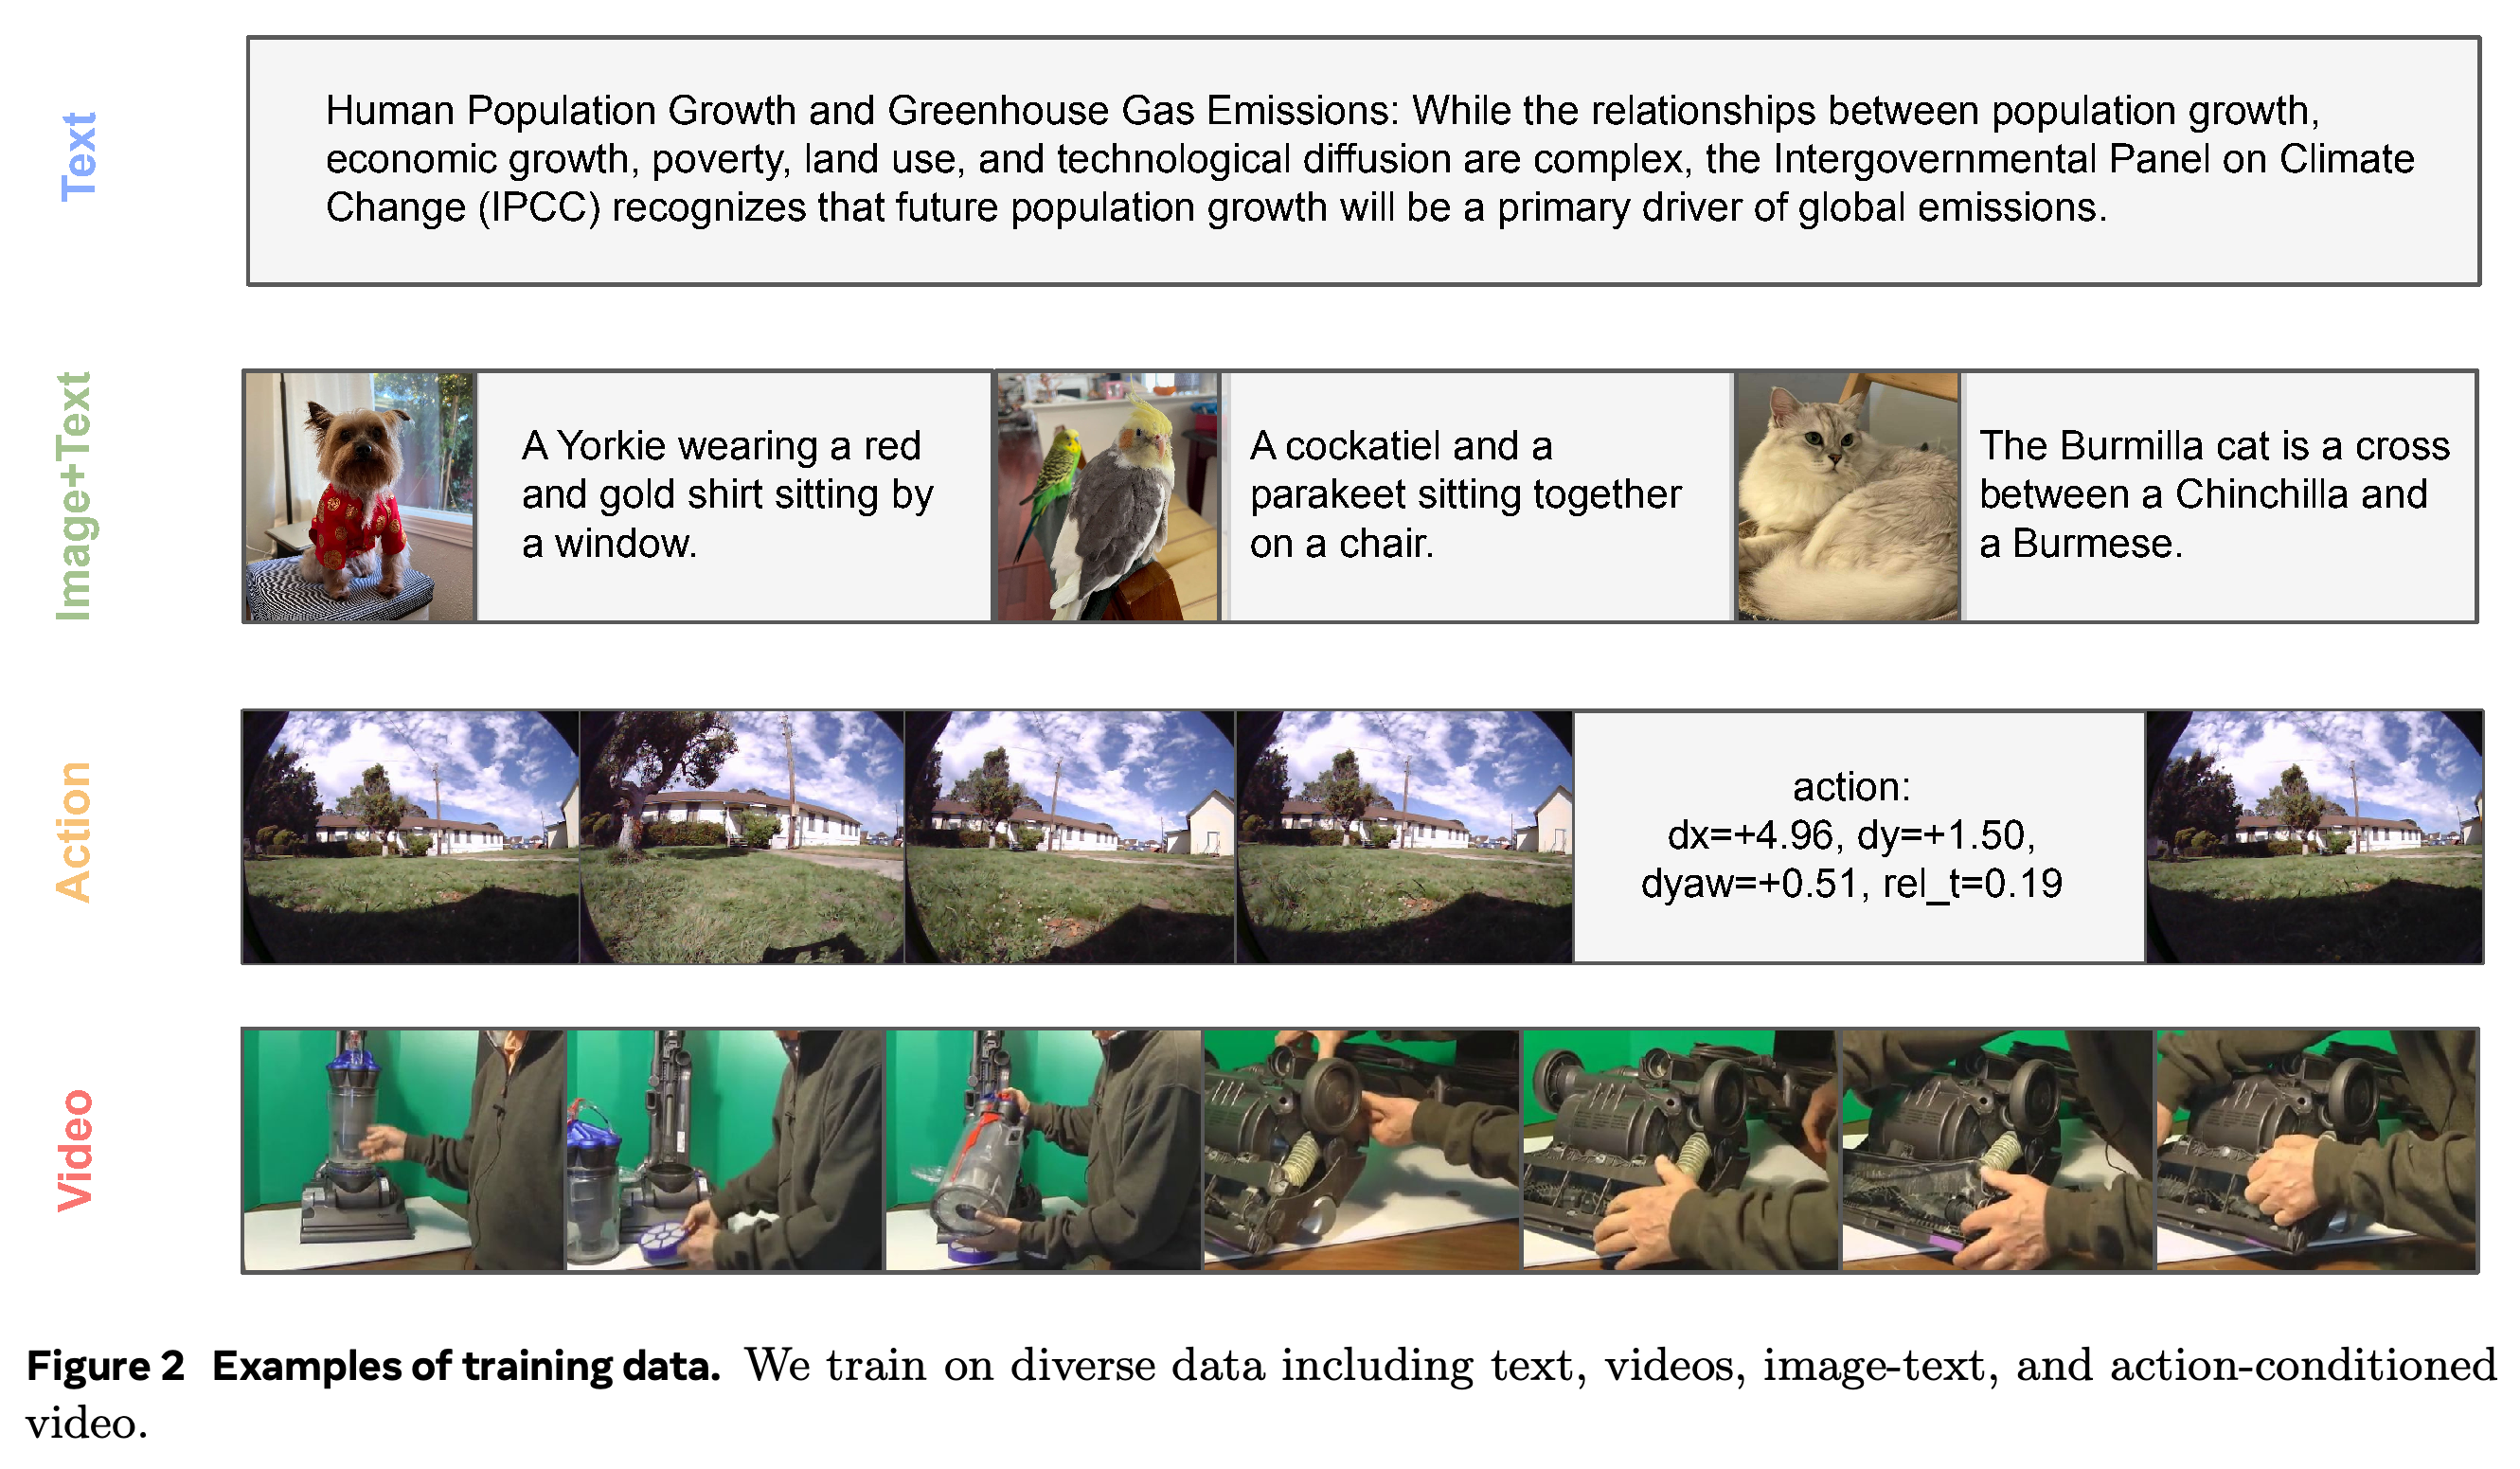
Training combines DCLM web text, raw videos sampled at 1 FPS, MetaCLIP and in-house Shutterstock image-text pairs, and action-conditioned visual trajectories. Navigation examples and text-annotated videos use the same I + T → I prediction format.
- Video sources include YouTube-Temporal 1B, SomethingSomething V2, and Kinetics.
- Figure 2 illustrates how text, paired images, frame sequences, and numerical action strings enter the unified training framework.
Navigation actions appear as ordinary text between visual context and a target frame. Raw video supplies temporal prediction examples without requiring captions for every sequence.
2.4 Evaluation
Language evaluation measures perplexity on held-out DCLM and the more out-of-distribution in-house Notes corpus. Visual evaluation uses held-out CC12M diffusion loss, DPGBench and GenEval generation scores, and average VQA accuracy across 16 Cambrian benchmarks.
- All reported VQA results follow 1 epoch of finetuning on Cambrian-7M with the visual encoder frozen.
- Text-only baselines first receive vision-adapter alignment on Cambrian-Alignment before the same VQA finetuning recipe. VQA therefore measures performance after adaptation, not zero-shot pretraining accuracy.
3 Visual Representations for Unified Multimodal Pretraining
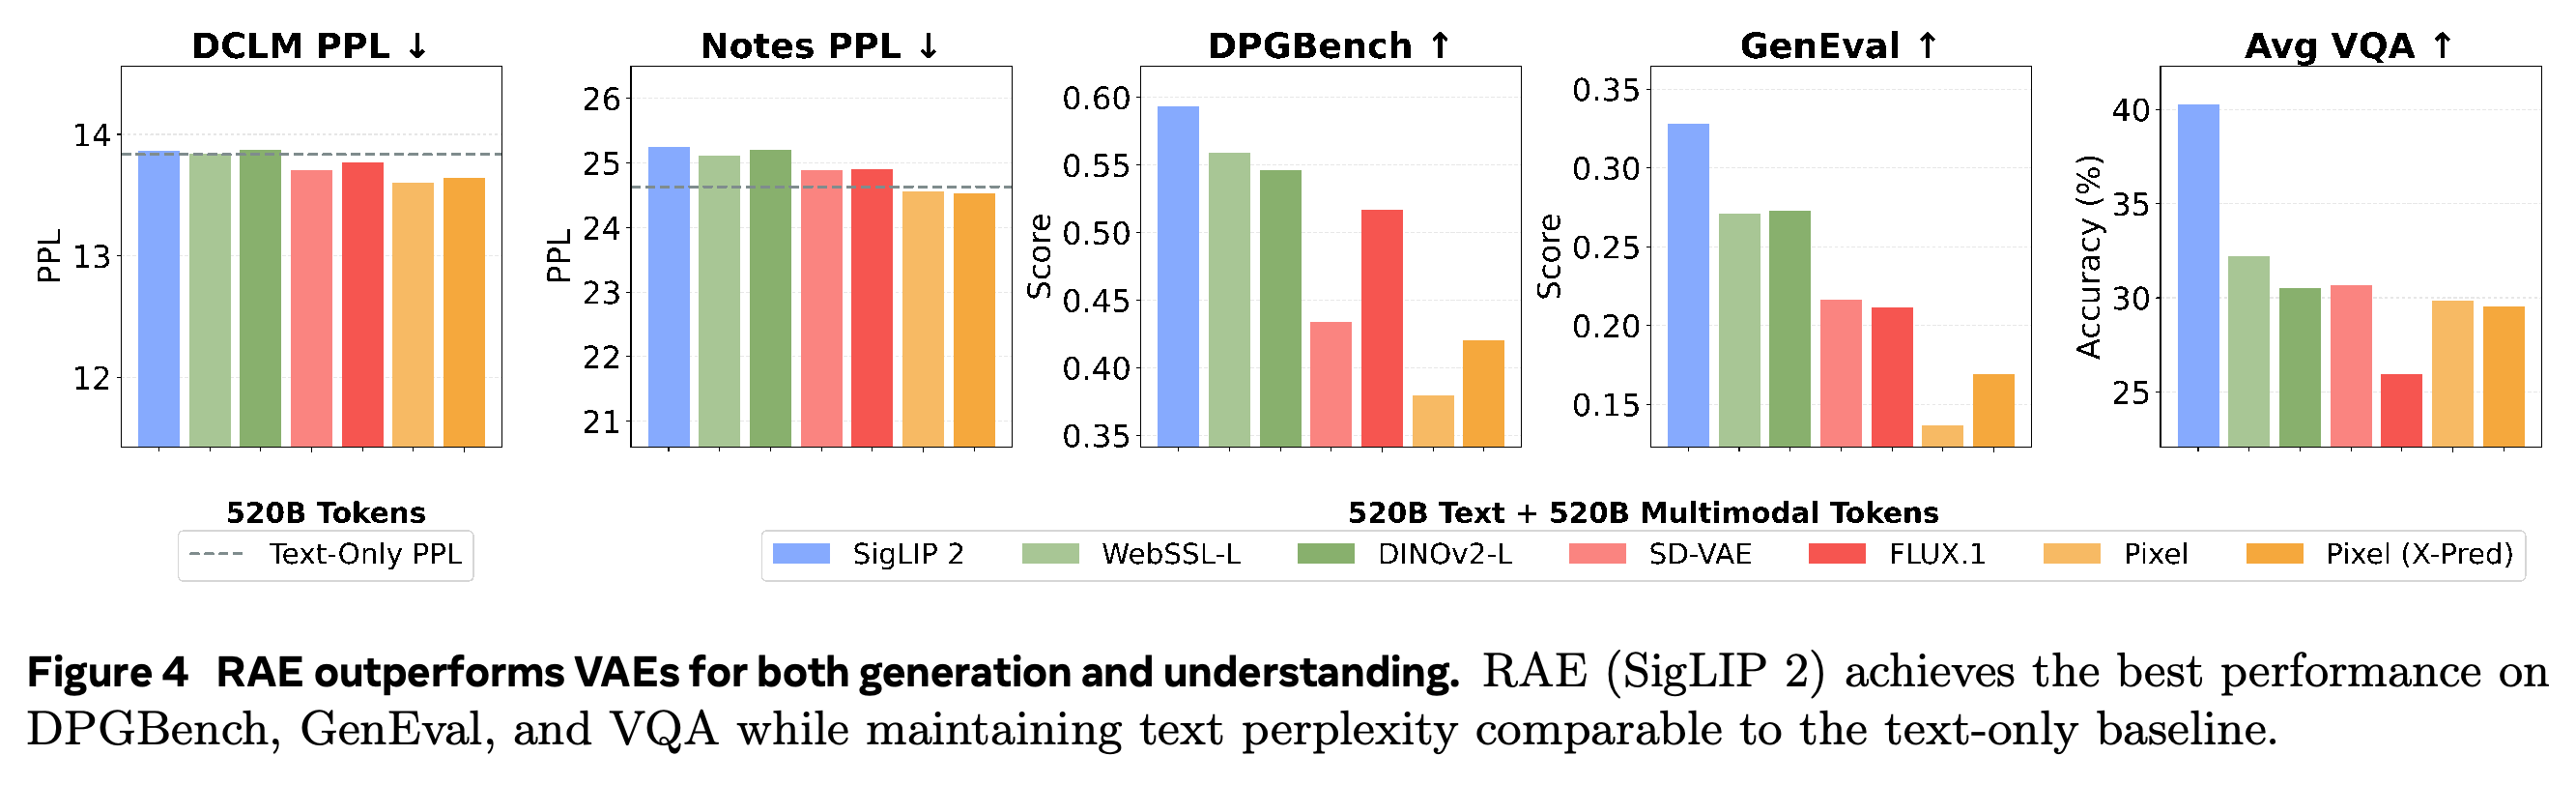
The representation ablation compares SD-VAE and FLUX.1, semantic encoders SigLIP 2 So400m, DINOv2-L, and WebSSL-L with RAE decoders, and raw 14×14 RGB patches. Figure 4 shows that SigLIP 2 gives the strongest combined generation and understanding results while retaining language perplexity close to the text-only baseline.
- The multimodal runs use 520B text + 520B multimodal tokens, whereas the language-only reference uses 520B text tokens. This holds text exposure constant but does not establish equal total training compute.
- The tested semantic latent space supports both understanding and generation without separate encoders for the two tasks.
- Raw pixels have the lowest text perplexity among the tested representations and remain competitive with some alternatives on VQA, but lag semantic encoders in generation. Closing this gap through additional scale is proposed as future work, not demonstrated.
SigLIP 2 gives the strongest combined generation and understanding results among the tested encoders, whereas language-perplexity differences are small. The language-only reference has the same text exposure but fewer total training tokens.
4 Understanding the Impact of Data
The data study separates three questions: whether visual co-training interferes with language, whether image-caption distributions explain language degradation, and whether diverse data improves downstream capabilities. The unified sequence format permits these comparisons without changing the architecture.
4.1 Pretraining Data Composition
The authors compare Text + Video, Text + MetaCLIP, and Text + Video + MetaCLIP + Action, each using 520B text + 520B multimodal tokens, against a 520B-token text-only baseline. Text + Video produces the best language perplexity among the multimodal mixtures and slightly improves DCLM perplexity relative to text-only, while every multimodal mixture worsens Notes perplexity.
- Figure 5 supports compatibility between raw video and in-distribution language modeling while showing an out-of-distribution generalization cost.
- Text + MetaCLIP has the worst perplexity among the tested mixtures, motivating the caption-distribution analysis.
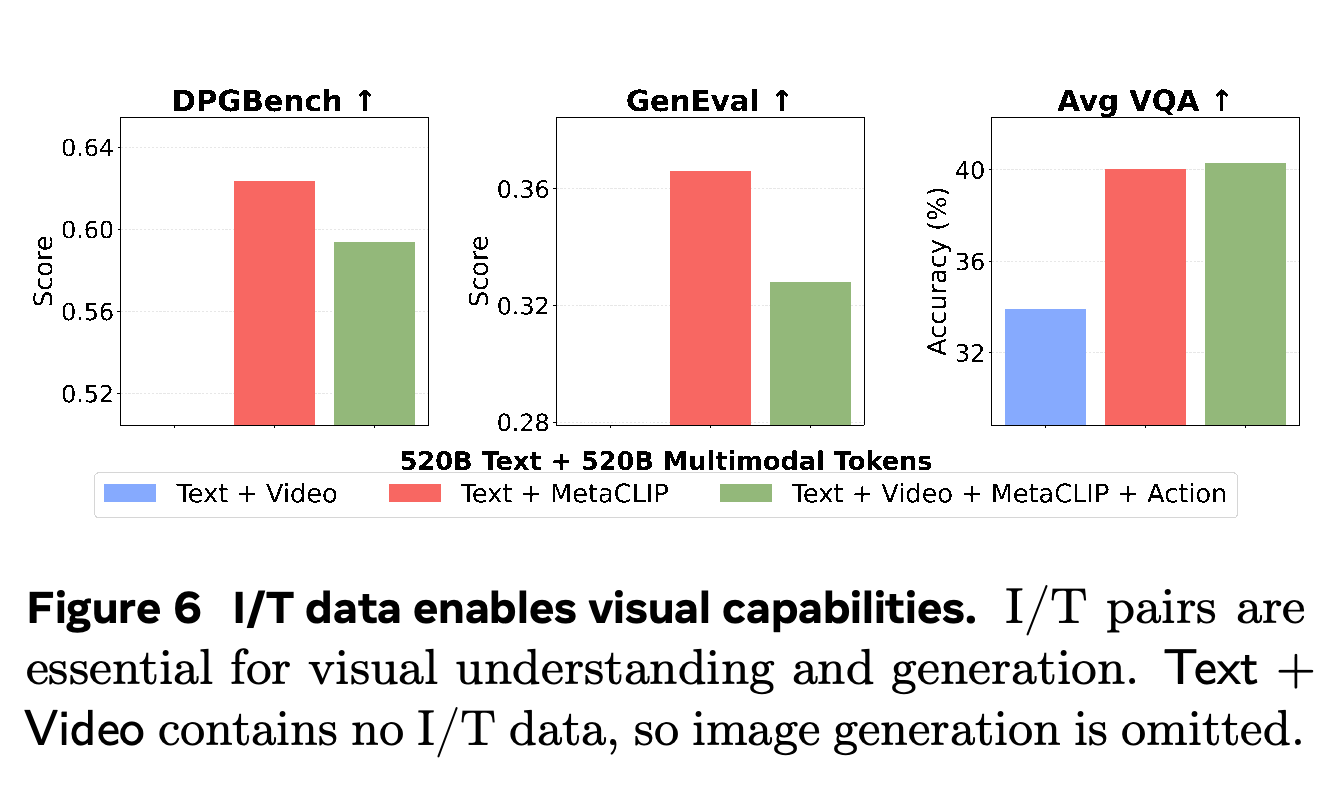
- Figure 6 shows that paired image-text data supports text-conditioned visual generation and improves understanding; the full diverse mixture gives the highest average VQA accuracy. Generation is not reported for Text + Video because it lacks image-text pairing.
Text + Video slightly improves DCLM perplexity, but its Notes perplexity remains worse than the text-only baseline. The results distinguish compatibility with in-distribution language modeling from preservation of out-of-distribution generalization.
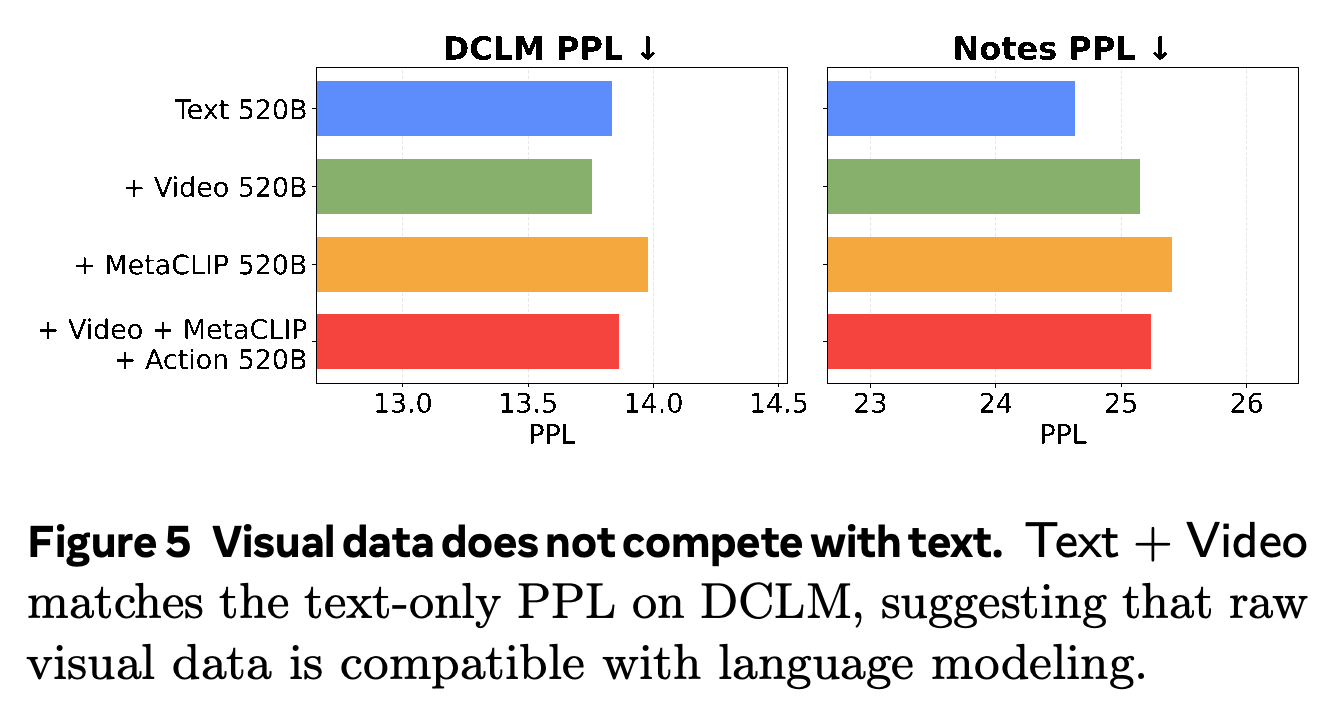
The full diverse mixture has the best VQA result, while image-text-only co-training has stronger generation scores. Mixture choice therefore depends on the target capability.
4.2 Image-Text Distribution
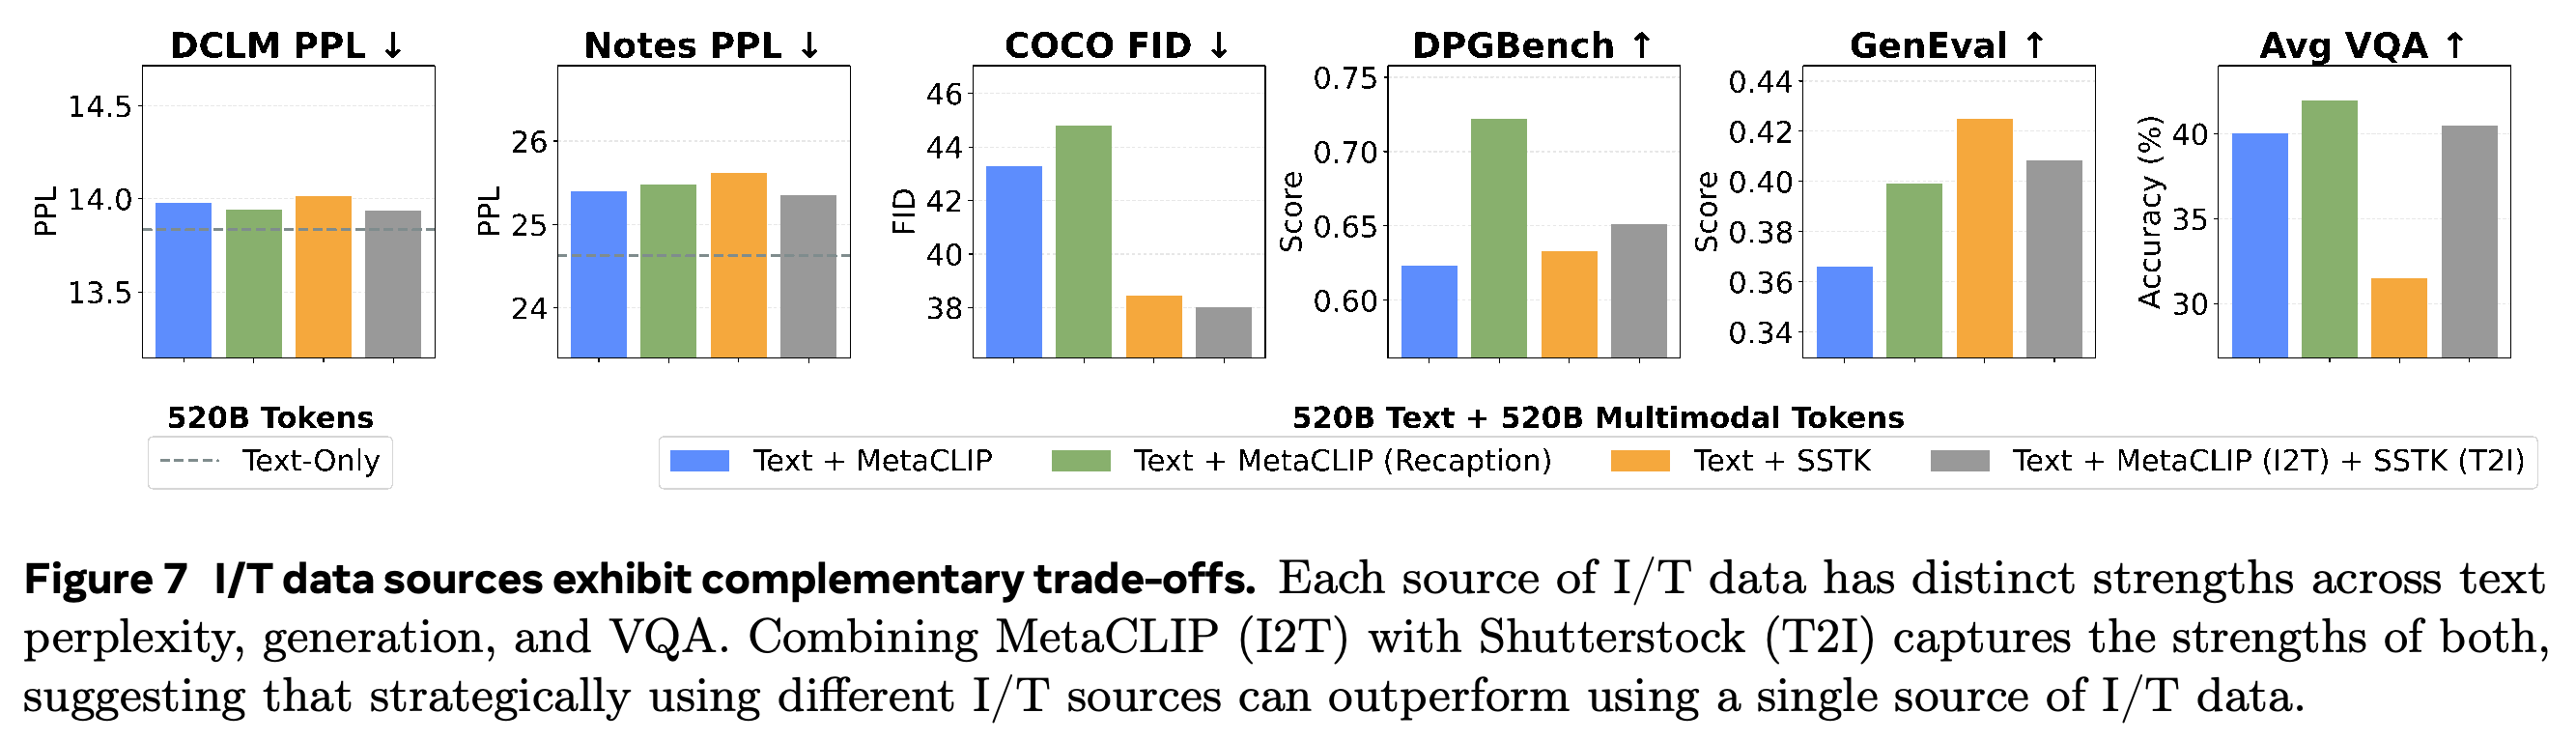
Image-caption distributions differ from DCLM: Table 1 reports centroid cosine distances of 0.196 for MetaCLIP, 0.286 for MetaCLIP (Recap), and 0.215 for SSTK. Figure 7 shows metric-specific trade-offs: recaptioning improves VQA and DPGBench, whereas Shutterstock gives stronger FID and GenEval results than standard MetaCLIP.
- Using MetaCLIP for image-to-text and SSTK for text-to-image combines useful properties of both sources, but does not dominate every single-source result.
- Distances are computed from 100K samples per dataset, truncated at 2000 characters and embedded with Qwen3-Embedding-8B.
- The centroid-distance analysis supports a distribution-shift hypothesis but is correlational. It does not independently isolate caption style, image content, and other dataset differences; the distance ranking also does not exactly match the plotted Notes-perplexity ranking.
Recaptioning gives the highest VQA and DPGBench scores, while Shutterstock improves FID and GenEval relative to standard MetaCLIP. Objective-specific MetaCLIP I2T and SSTK T2I combines useful properties of both, without surpassing every single-source result.
4.3 Synergy in Multimodal Pretraining
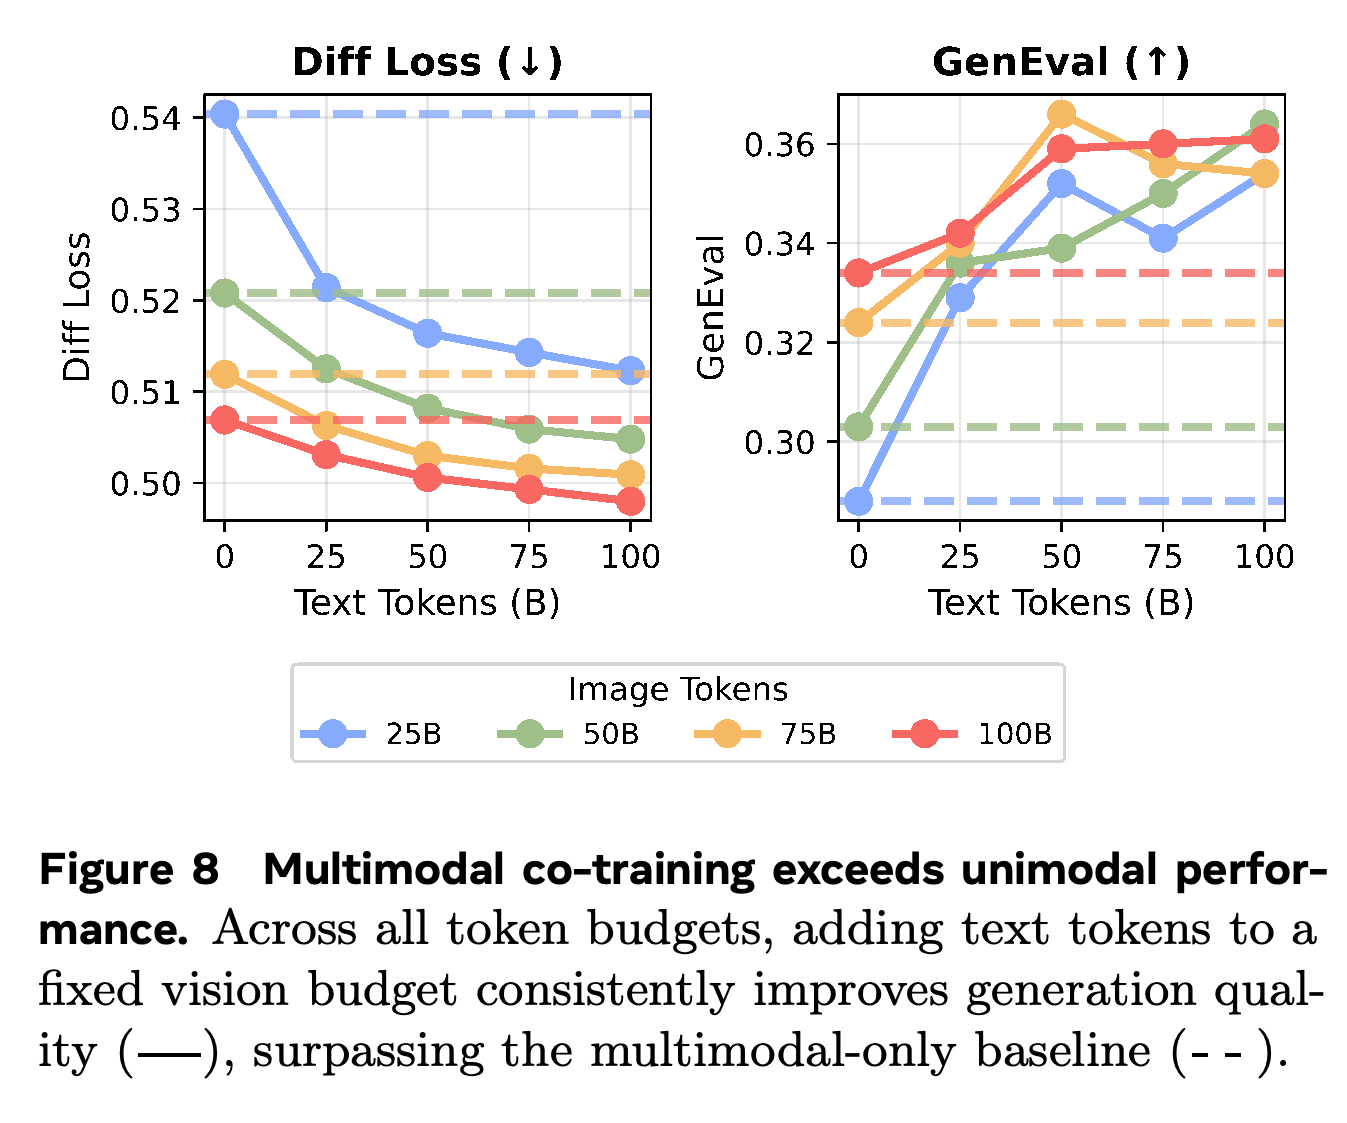
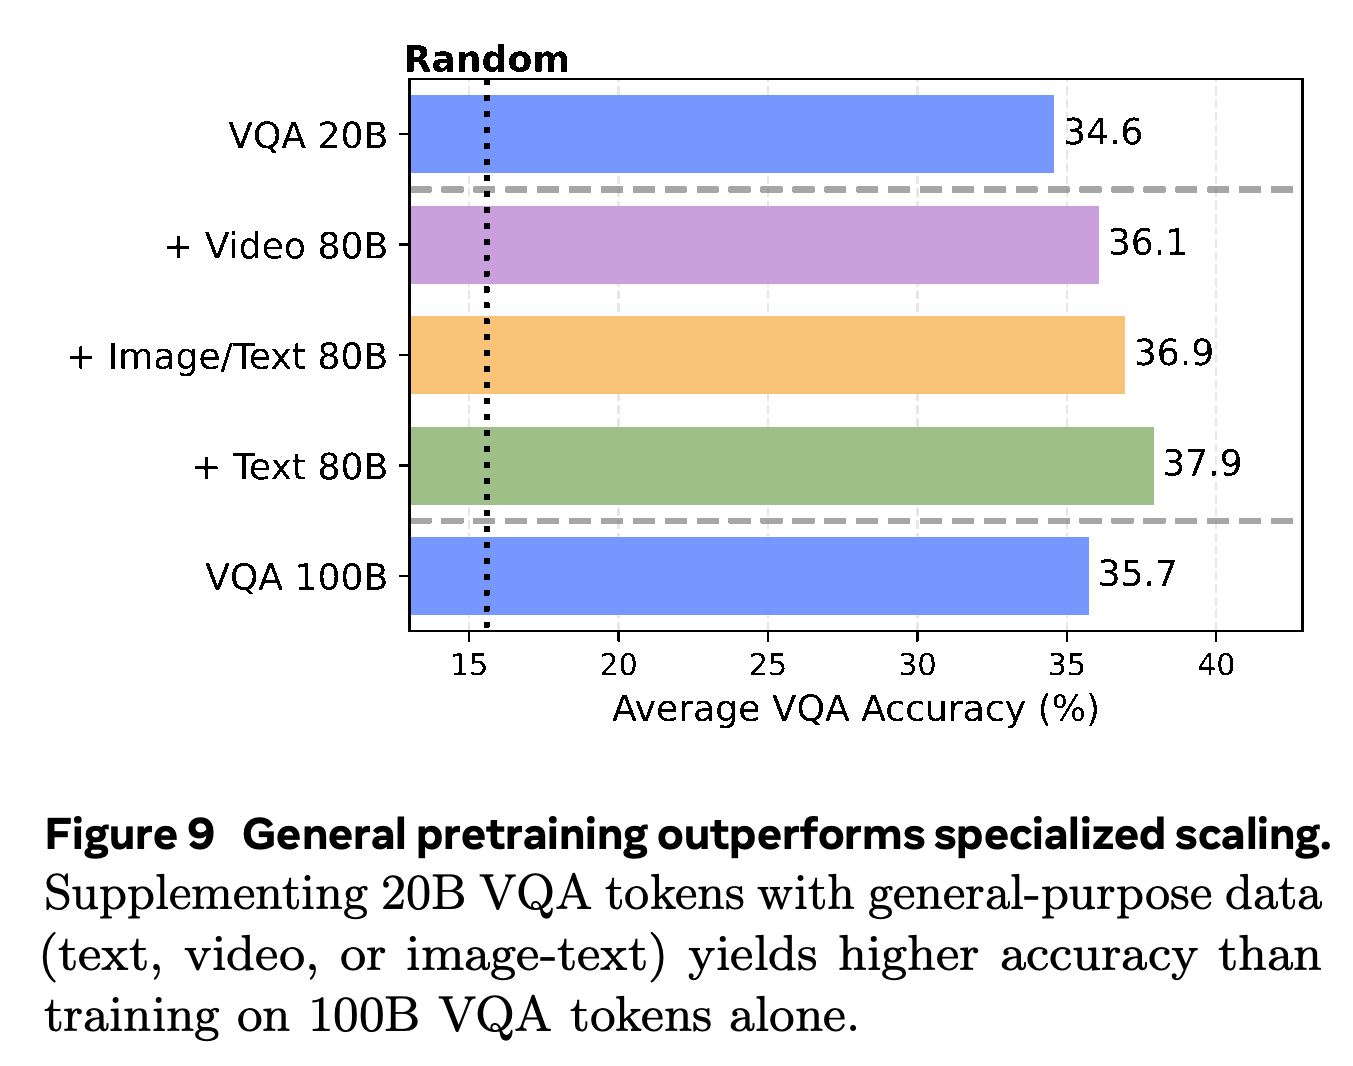
A grid spanning {0, 25, 50, 75, 100}B text and image-token budgets shows that adding text at a fixed visual budget reduces diffusion loss and improves text-conditioned generation relative to the no-added-text baseline. In the downstream VQA study, 20B VQA tokens supplemented with 80B video, image-text, or text tokens achieve 36.1%, 36.9%, and 37.9% accuracy, respectively, exceeding the 100B VQA-only baseline at 35.7%.
- The 20B VQA-only baseline reaches 34.6%. The mixed runs improve over both the lower-budget baseline and the equal-total-token specialized baseline while using 5× less VQA data.
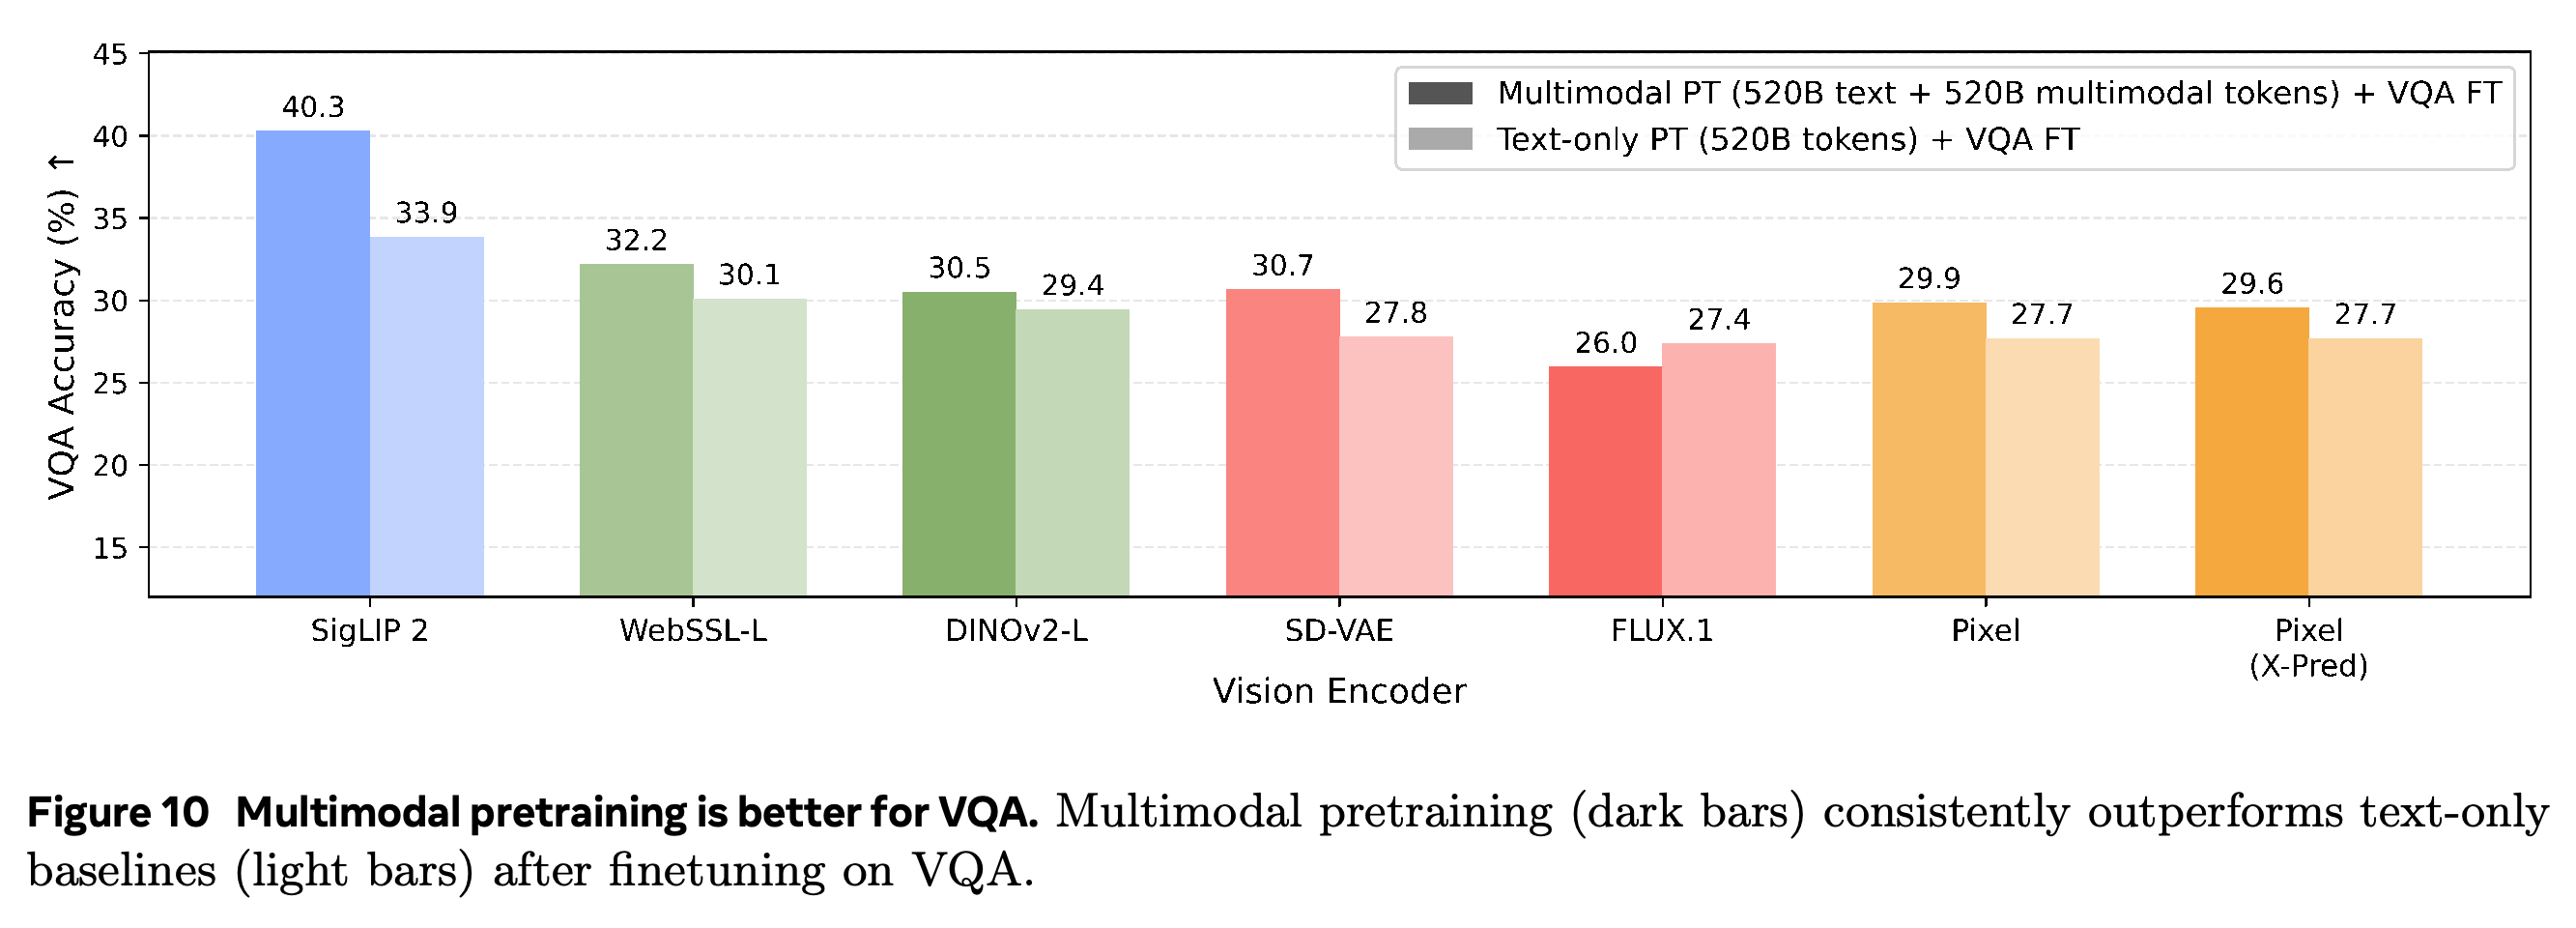
- Figure 10 extends the comparison to 520B text + 520B multimodal pretraining followed by VQA finetuning: SigLIP 2 reaches 40.3%, versus 33.9% after text-only pretraining.
- Improvement is not universal across encoders: FLUX.1 reaches 26.0% after multimodal pretraining versus 27.4% after text-only pretraining, contrary to the figure caption’s claim of consistent gains.
At each fixed image-token budget, adding text lowers diffusion loss and improves GenEval relative to the no-added-text reference. GenEval is not monotonic at every increment, and adding text also increases total training exposure.
The mixed 100B-token runs outperform 100B VQA-only despite using only 20B VQA tokens. Text supplementation performs best at 37.9%, compared with 35.7% for specialized scaling.
SigLIP 2 benefits substantially from multimodal pretraining, reaching 40.3% versus 33.9% after VQA finetuning. FLUX.1, at 26.0% versus 27.4%, is an exception to the caption's claim of consistent improvement.
5 Towards World Modeling in Unified Multimodal Models
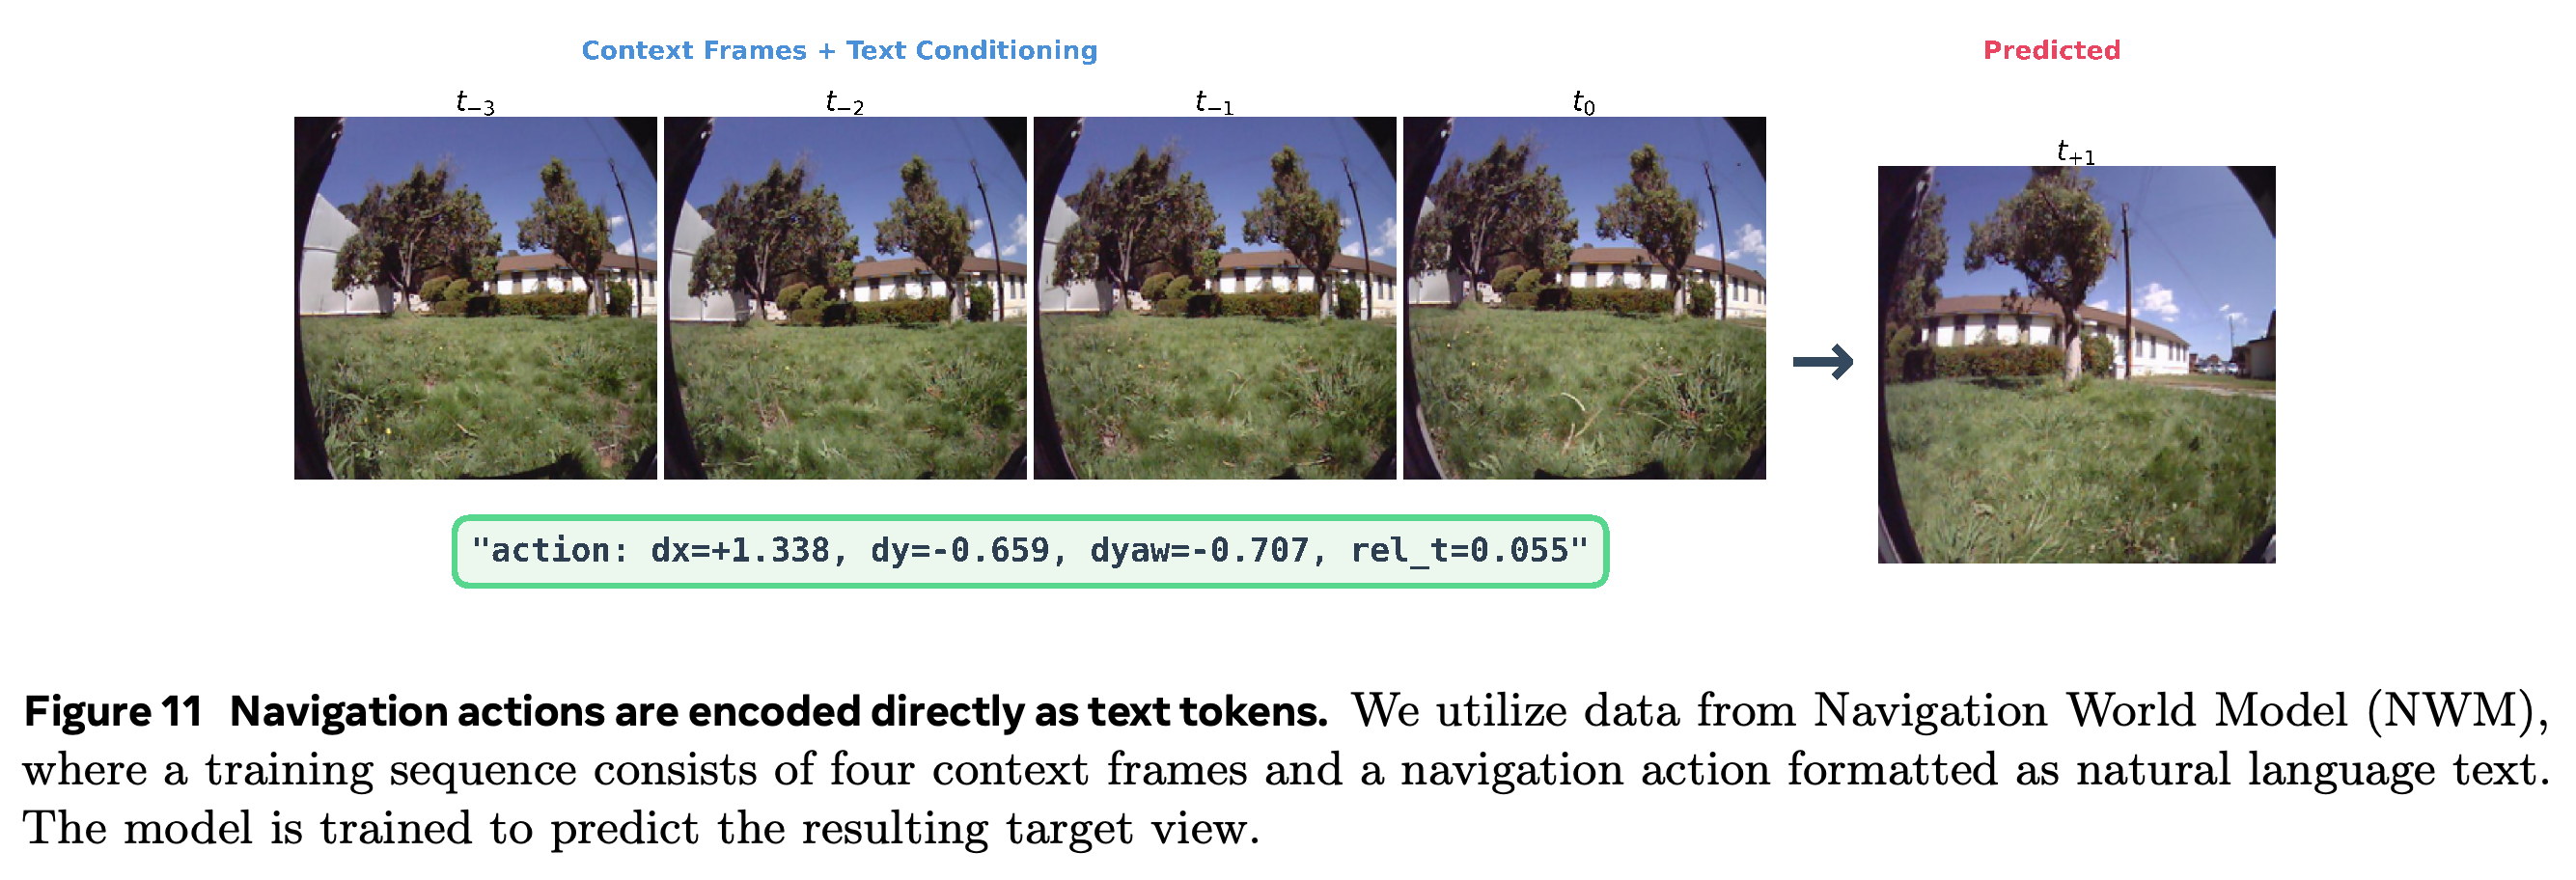
World modeling is formulated as State_t + Action → State_t+1 using the Navigation World Model (NWM) setting. Unlike NWM’s dedicated continuous action representation, this model encodes translation and rotation deltas as numerical text strings, making navigation another I + T → I task without action-specific adapters.
- Figure 11 illustrates four context frames followed by an action string and a predicted target view.
Four context views and the string “action: dx=+1.338, dy=-0.659, dyaw=-0.707, rel_t=0.055” condition a target-view prediction. The example specifies how numerical actions enter the sequence without dedicated action adapters.
5.1 NWM Data and Protocol
Navigation training uses egocentric robot datasets including SCAND and RECON, with 4 context frames, an action, and a target frame per sample. Evaluation uses Cross-Entropy Method (CEM) planning with N = 120 candidate action sequences over an 8-step horizon, minimizing LPIPS distance between the predicted final frame and the goal image.
- Appendix F.1 specifies an 8-step horizon of 2 seconds, selection of the top K = 5 trajectories, averaging their actions, and 3 repetitions per evaluation instance.
- Absolute trajectory error (ATE) and relative pose error (RPE) are measured against ground-truth trajectories. This protocol evaluates planning through predicted visual states, not unrestricted natural-language control of deployed robots.
5.2 World Modeling Emerges from Multimodal Pretraining
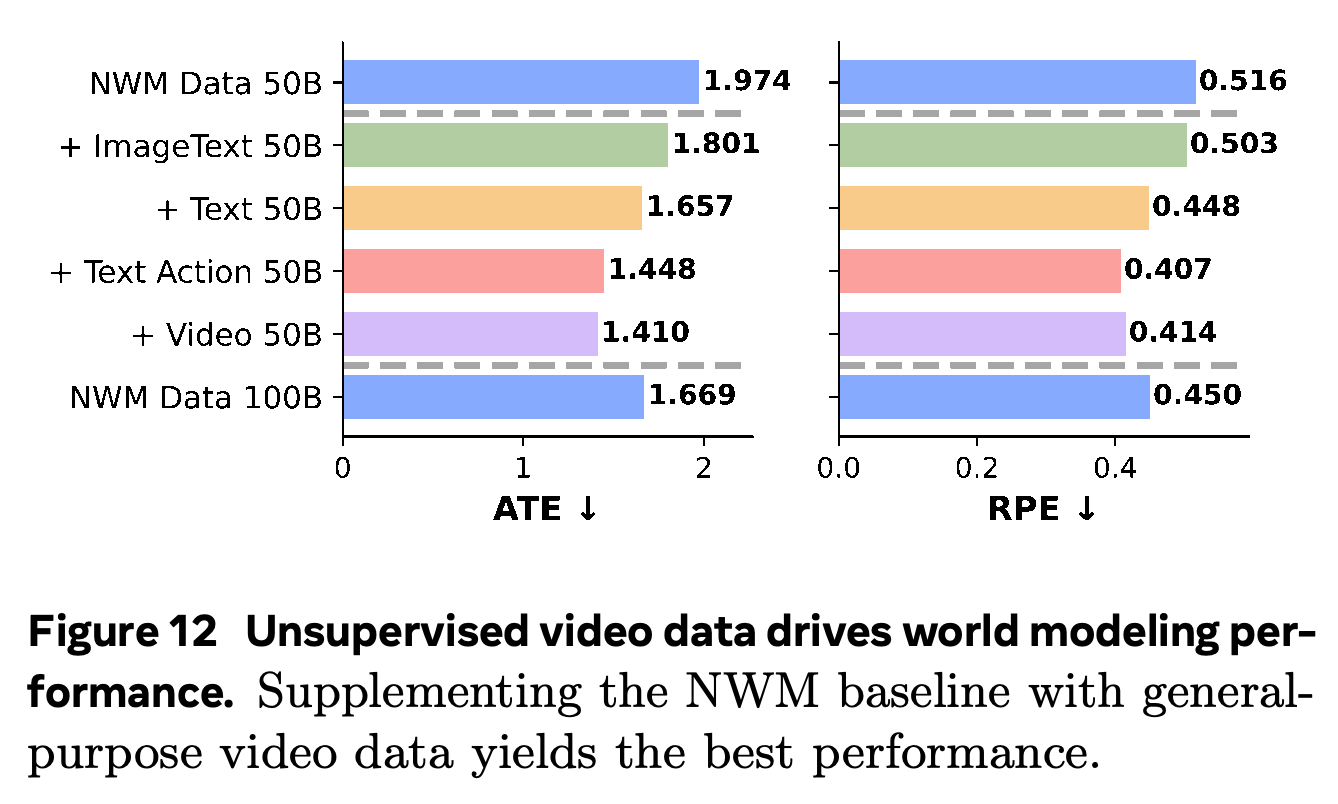
Adding 50B raw-video tokens to 50B NWM tokens yields ATE 1.410 and RPE 0.414, compared with 1.974 and 0.516 for 50B NWM-only and 1.669 and 0.450 for 100B NWM-only. Text-action video produces the best RPE, 0.407, while raw video produces the best ATE.
- All tested supplements improve over 50B NWM-only, but not all beat 100B NWM-only: image-text supplementation reaches ATE 1.801 and RPE 0.503.
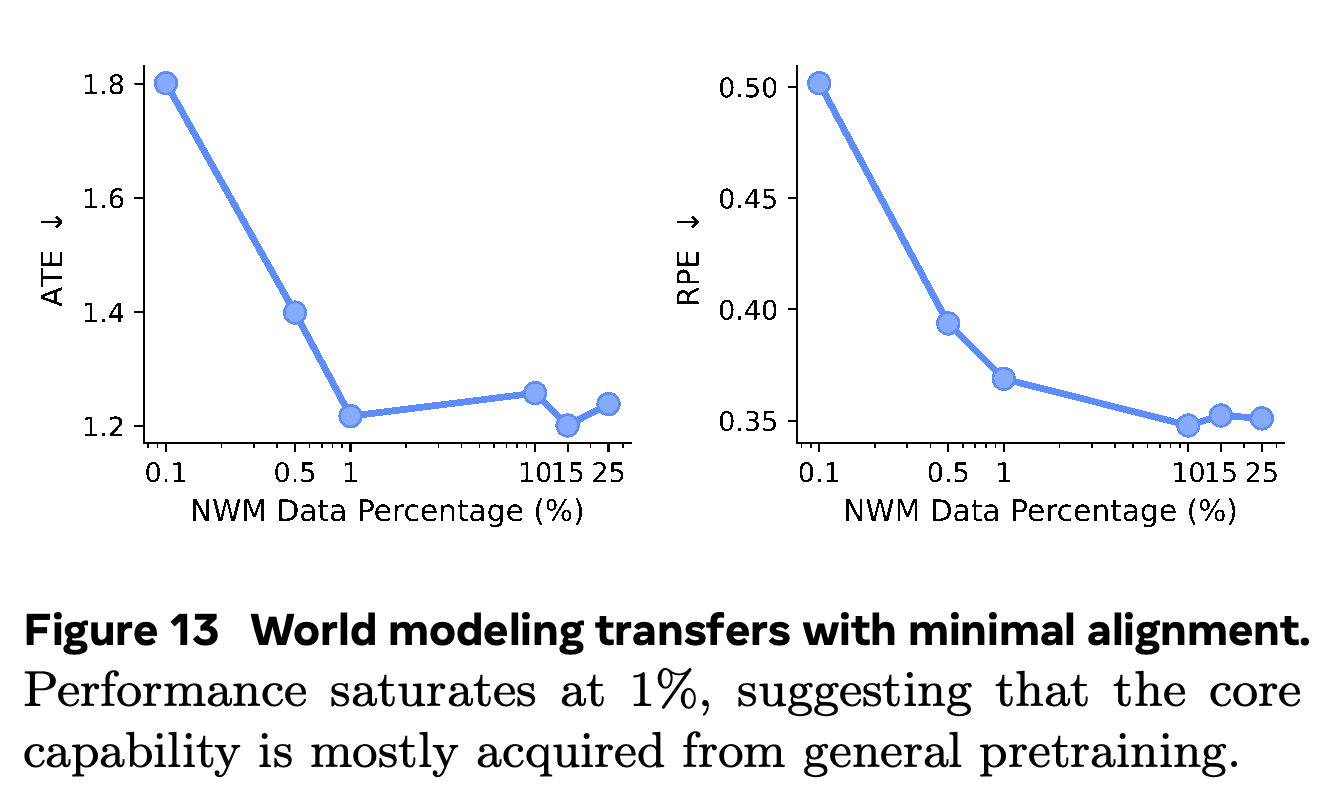
- At a fixed 200B-token training budget, varying NWM data from 0.1% to 25% yields competitive performance with approximately 1% in-domain data and limited subsequent improvement.
- The ratio experiment demonstrates data-efficient transfer from general pretraining, but its smallest condition still contains navigation data. It does not establish planning without domain alignment.
Raw video gives the lowest ATE, 1.410, while text-action supplementation gives the lowest RPE, 0.407. Image-text supplementation improves over 50B NWM-only but remains worse than 100B NWM-only on both metrics.
The largest gains occur as navigation data increases from the smallest fractions toward approximately 1% of the fixed 200B-token budget. Higher ratios provide limited additional improvement, but no zero-navigation-data condition is shown.
5.3 Qualitative Rollouts with Free-form Language as Actions
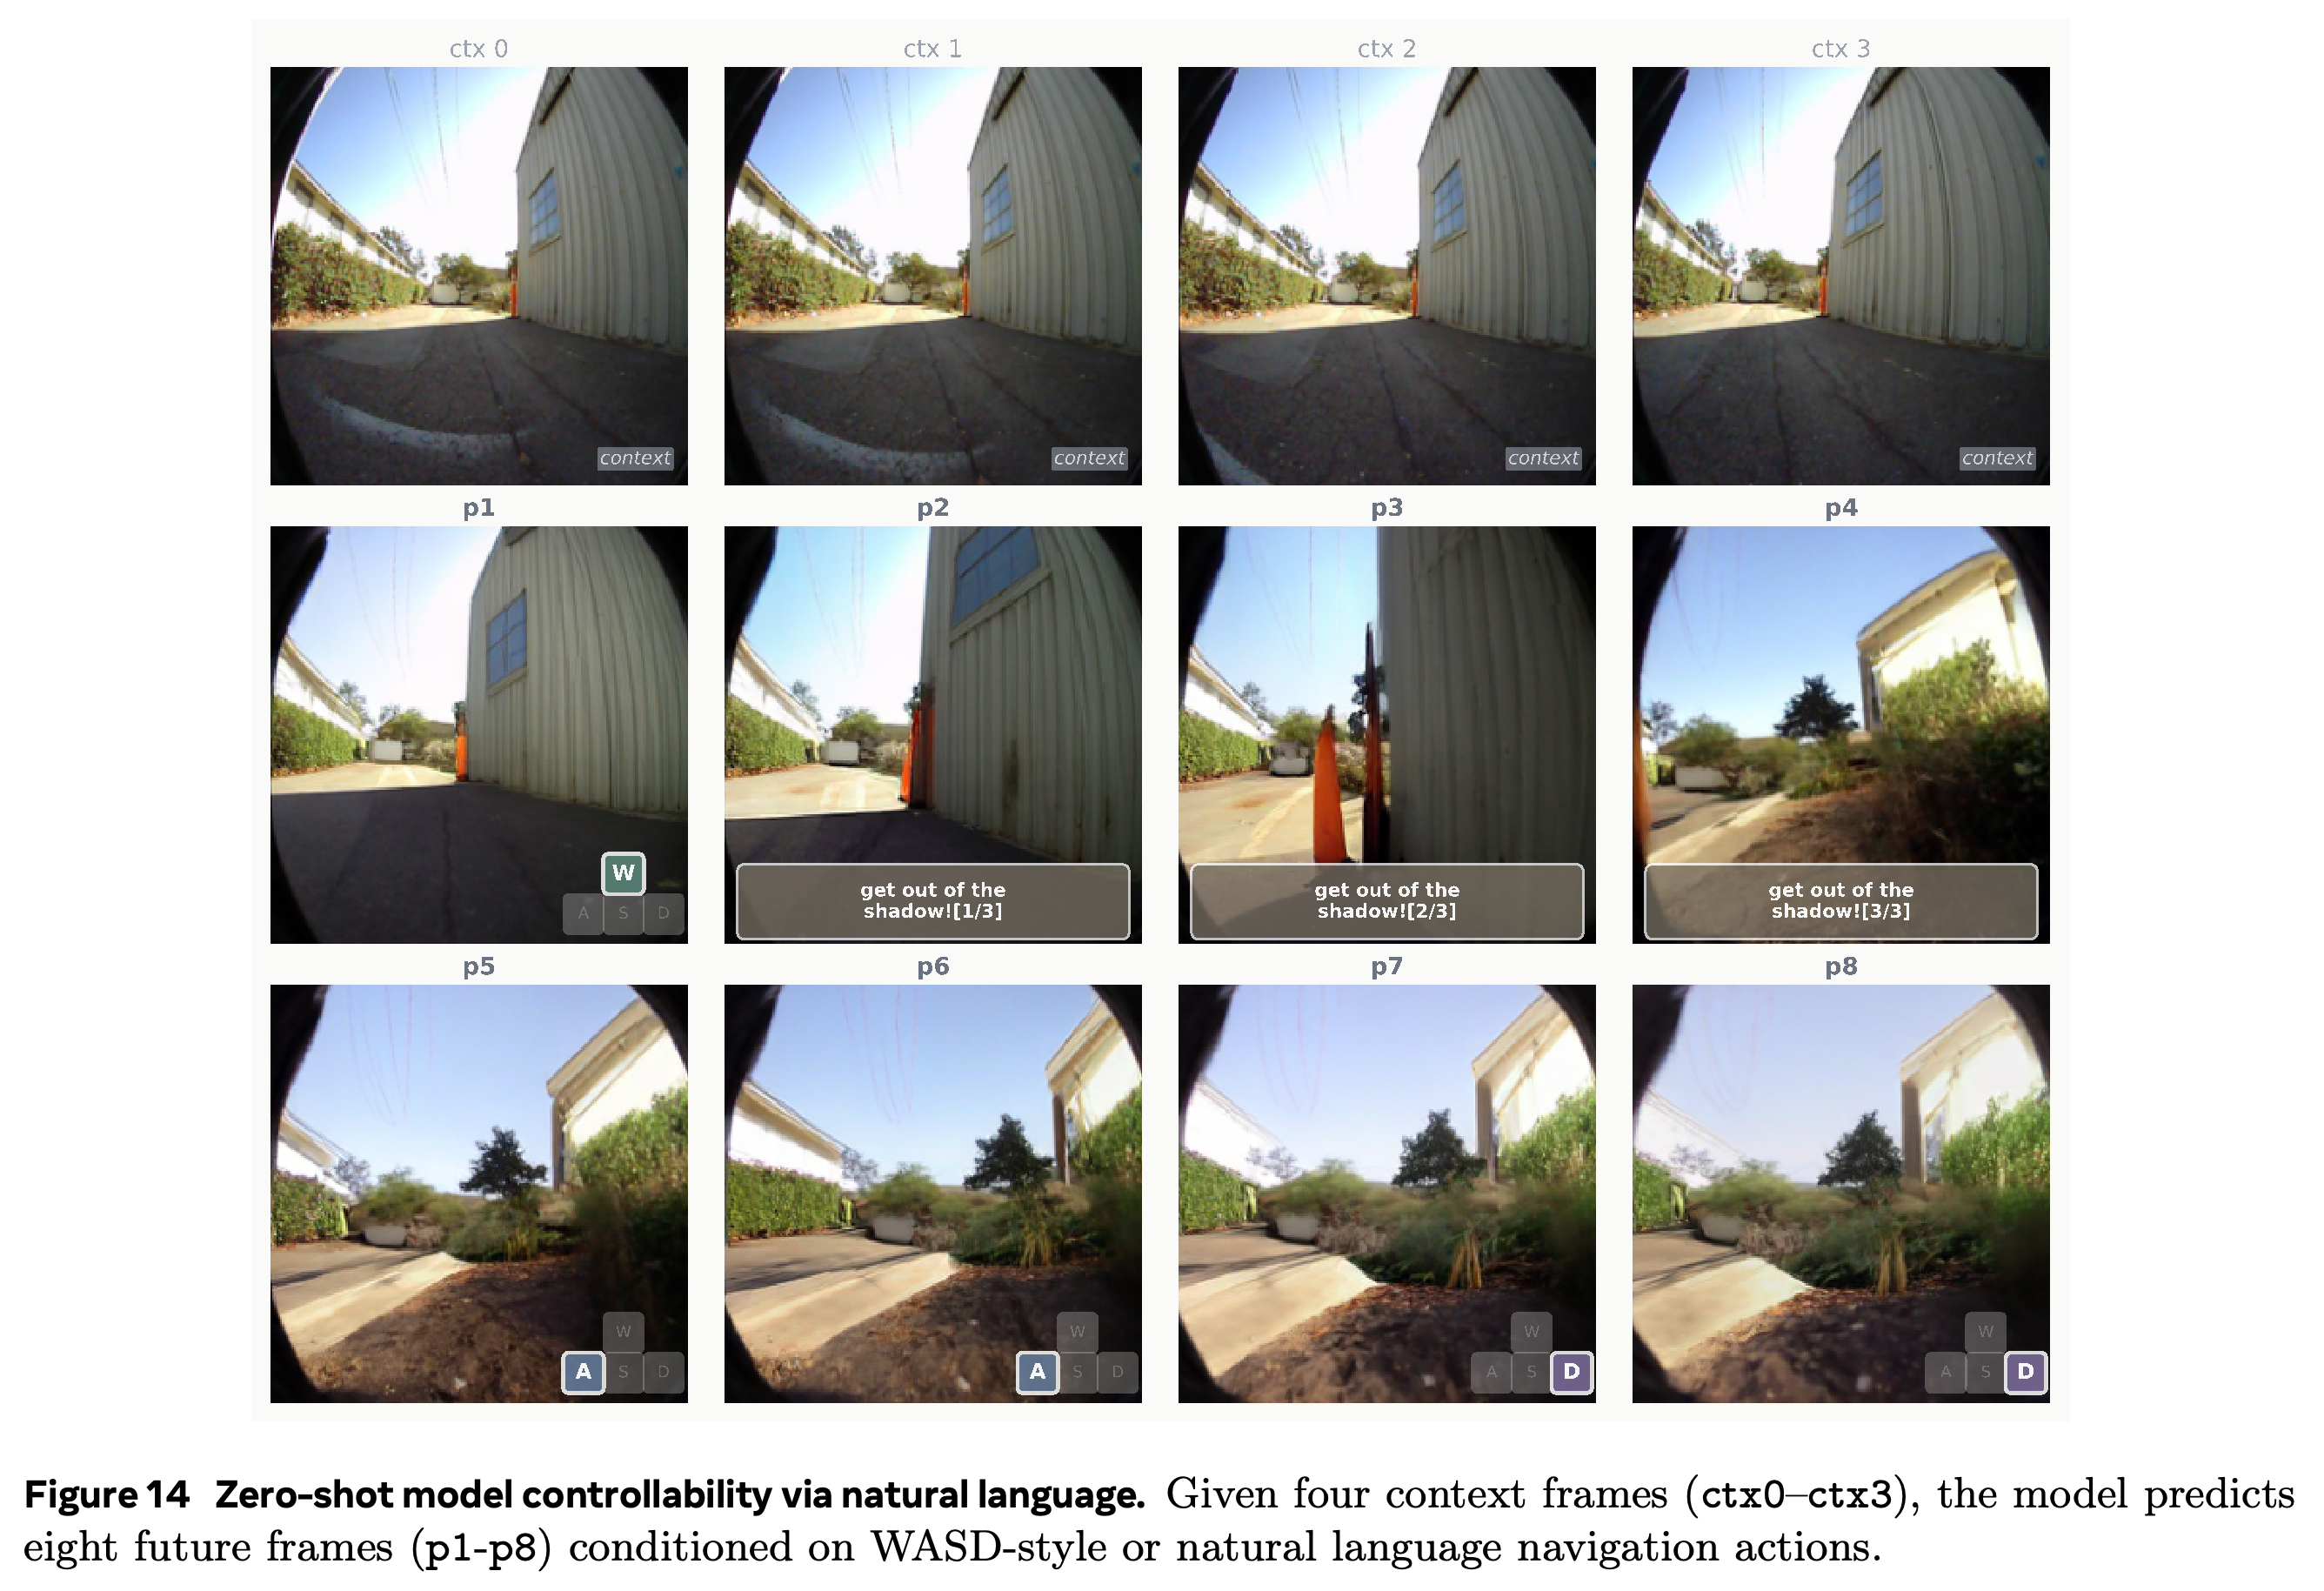
Figure 14 demonstrates autoregressive rollouts from four context frames using both predefined WASD actions and the free-form command “get out of the shadow!”. The generated viewpoints are qualitatively consistent with the requested movement, illustrating language-conditioned visual transitions beyond the numerical action format.
- The defined actions are W = (+0.5, 0, 0), S = (−0.5, 0, 0), A = (+0.2, 0, +0.5), and D = (+0.2, 0, −0.5) in robot-centric coordinates.
- Free-form language control is illustrated qualitatively rather than evaluated through a quantitative command-following benchmark. These selected rollouts do not establish general physical fidelity or command reliability.
The rollout combines numerical WASD controls with “get out of the shadow!” and shifts toward a brighter viewpoint. It illustrates language-conditioned control but does not measure success across a command set.
6 Unified Multimodal Architecture Design
Fixed modality-specific FFNs improve over a shared FFN but allocate capacity equally between text and vision by construction. MoE instead learns token-dependent allocation while separating total model capacity from the computation activated per token.
- The architecture investigation tests expert granularity, sparsity, prediction targets, shared experts, emergent routing patterns, and combinations with the preferred visual representation.
6.1 Exploring MoEs for Unified Multimodal Models
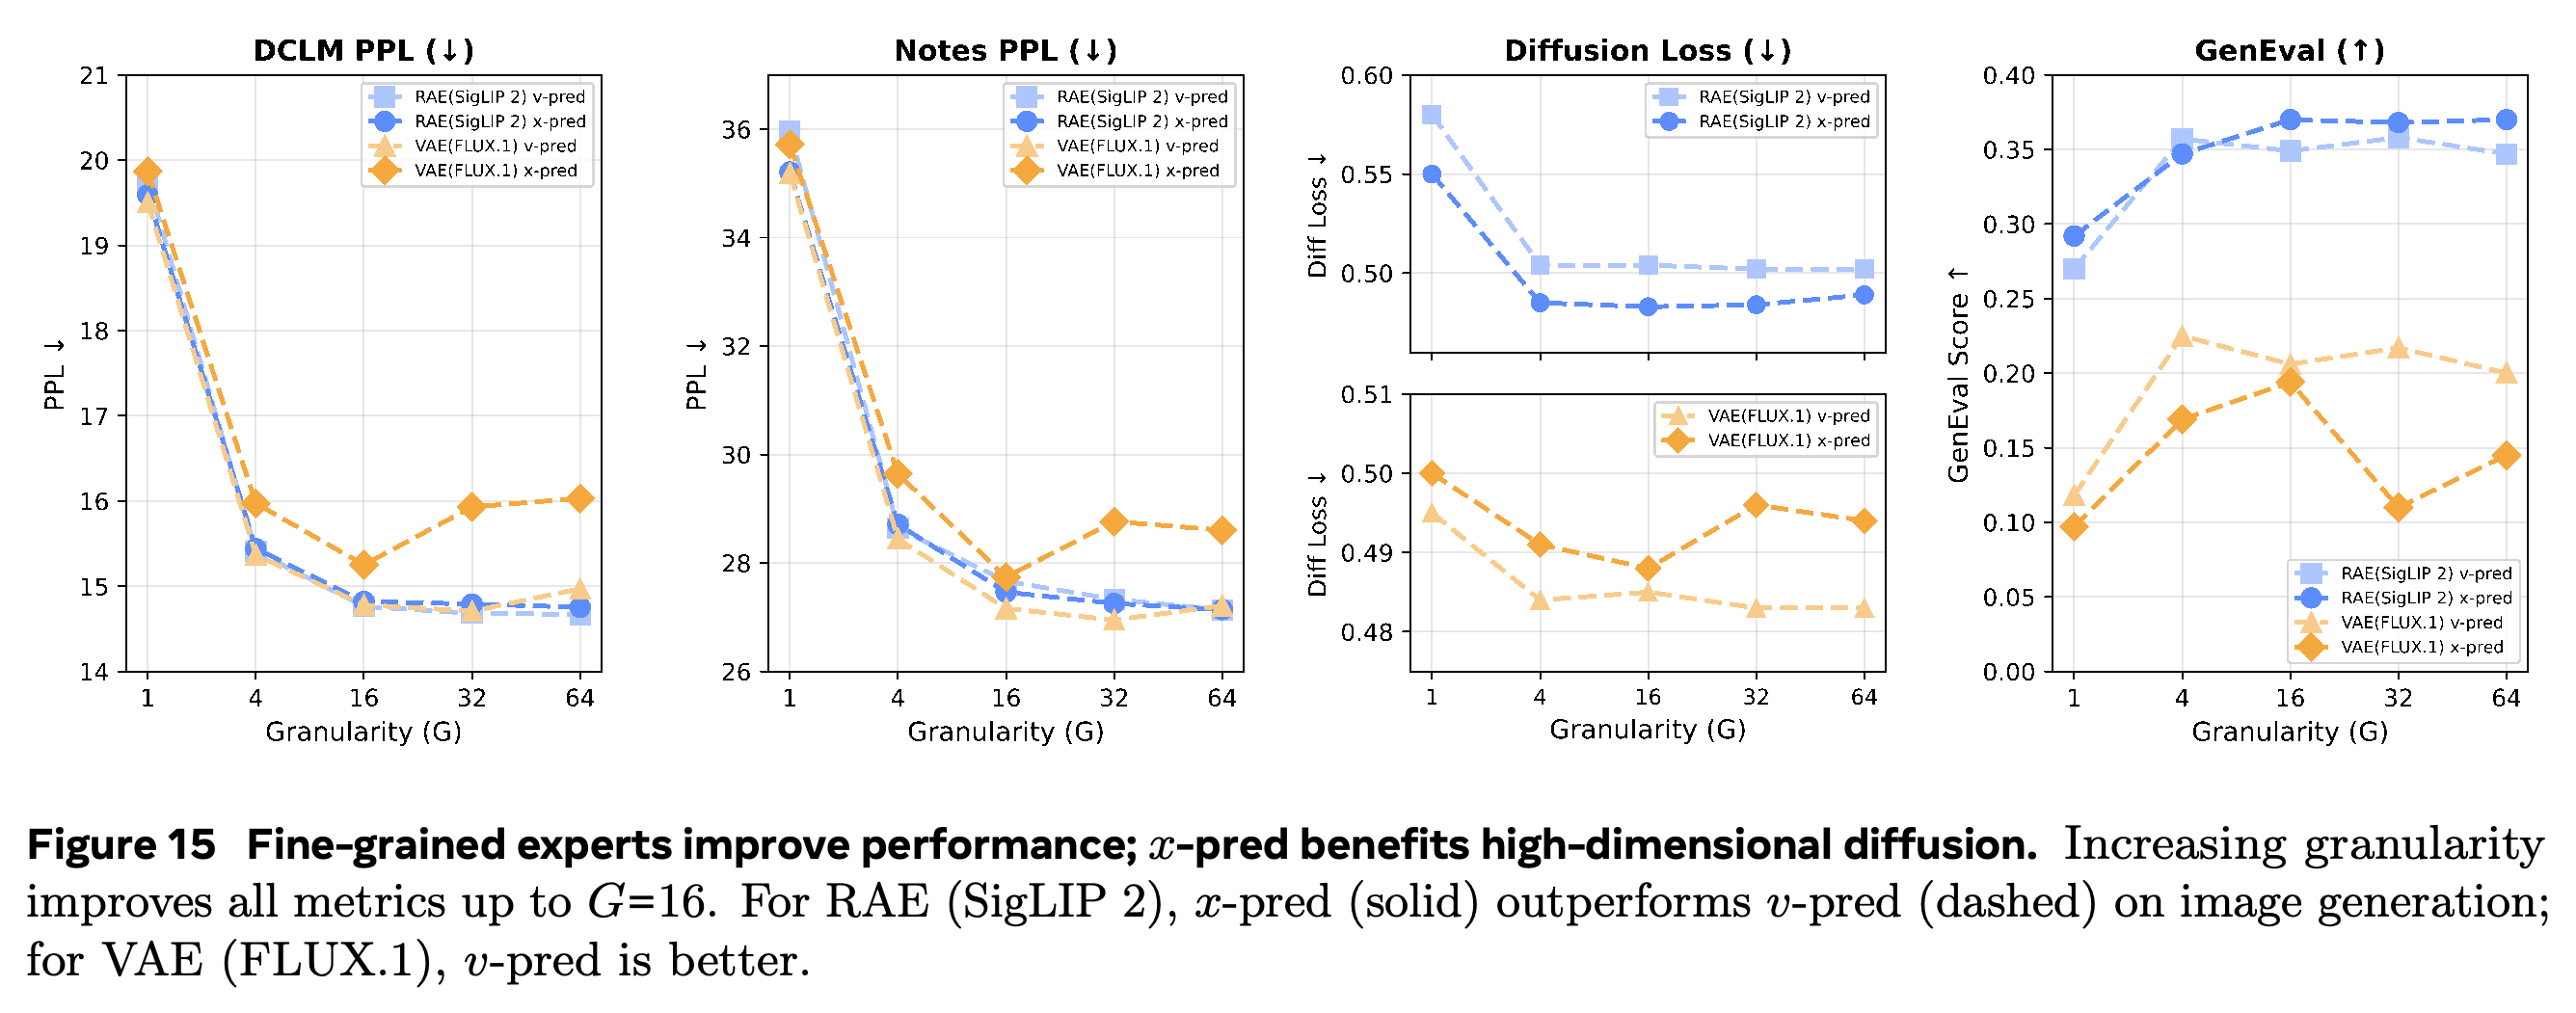
The default MoE sweeps train for 57B tokens on a 50/50 mixture of DCLM text and Shutterstock image data. Expert granularity is G = 4d_model/d_expert; sweeping G ∈ {1, 4, 16, 32, 64} at approximately fixed active computation gives substantial gains from finer routing. The authors report earlier saturation for vision around G = 4 than for language around G = 16 and adopt G = 16 for later experiments.
- The granularity sweep uses approximately 13.5B total and 1.5B active parameters. G = 1 uses large experts with Top-1 routing; the G = 64 implementation uses 1008 rather than 1024 experts because of TorchTitan constraints.
- RAE with SigLIP 2 benefits from x-pred relative to v-pred for generation. FLUX.1 is better served by v-pred; x-pred produces worse language perplexity at higher granularity.
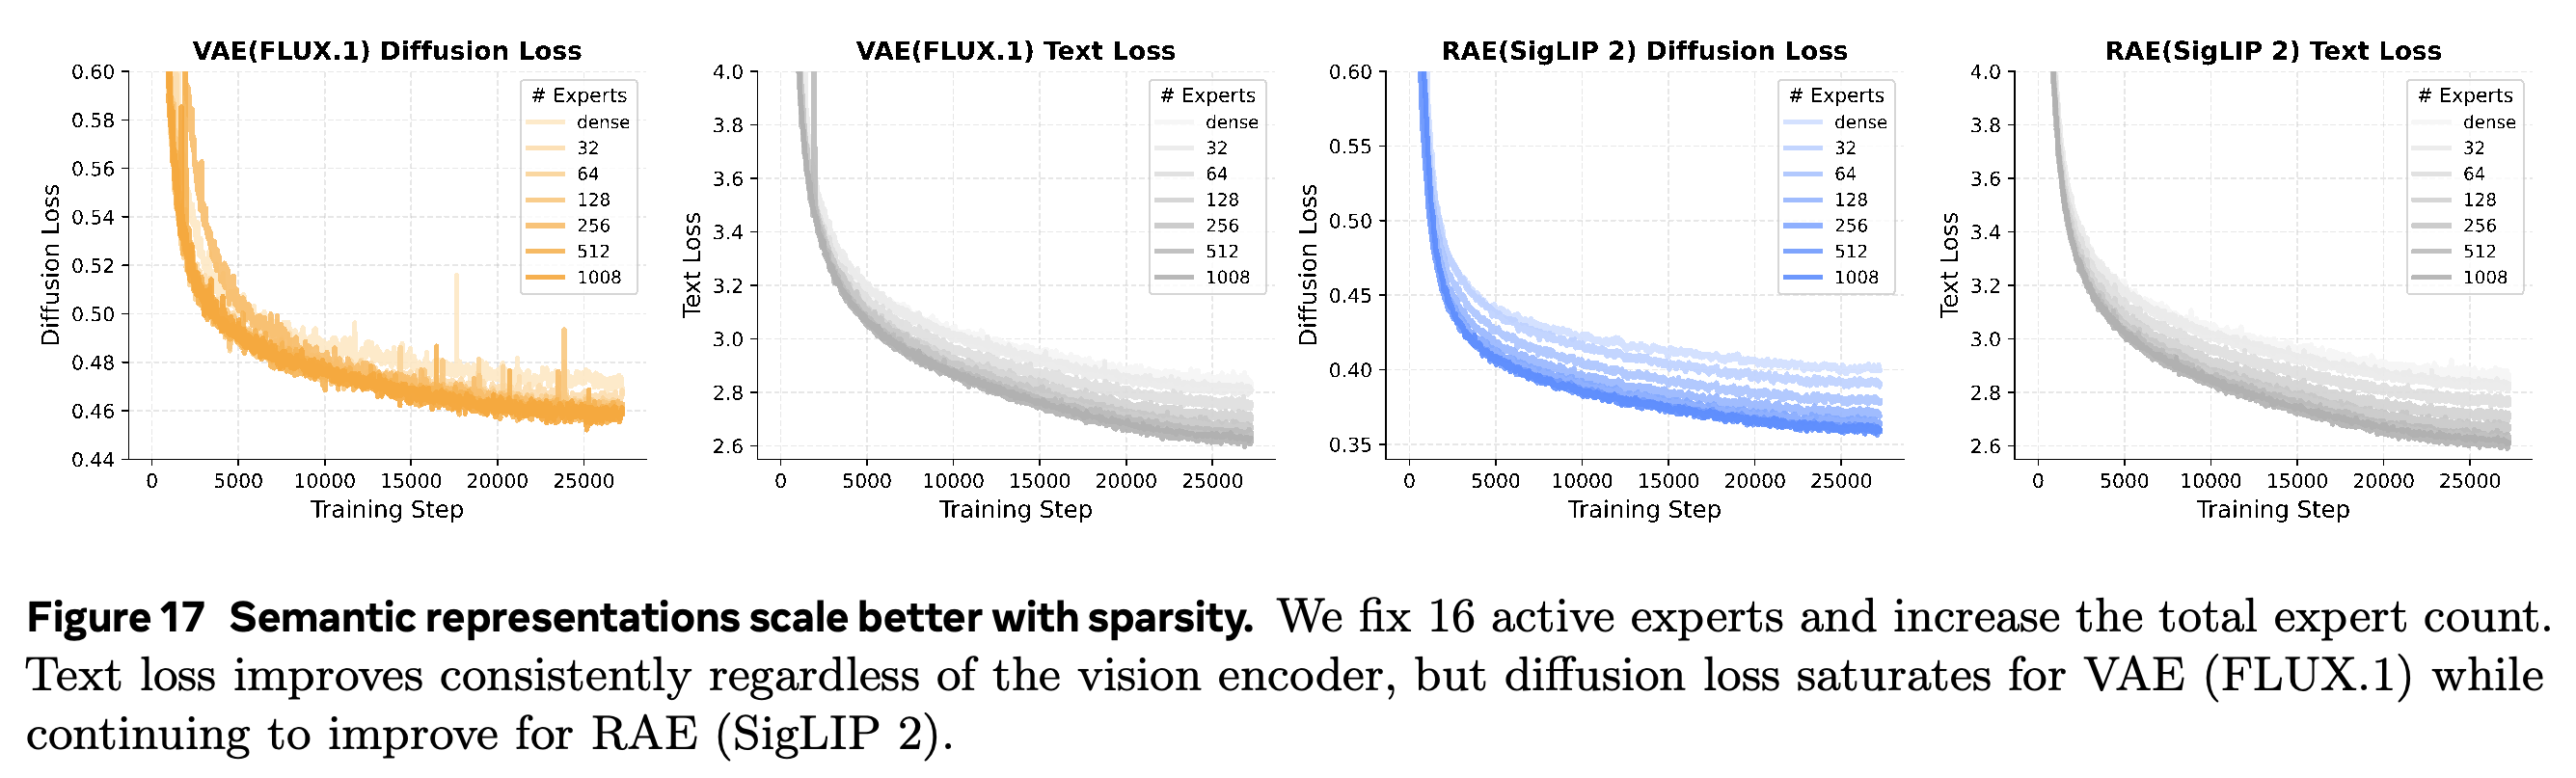
- At G = 16, the sparsity sweep keeps 16 active experts of dimension 512 while increasing the pool from 32 to 1008. Language loss improves for both representations, whereas the VAE diffusion-loss benefit saturates and the RAE benefit continues.
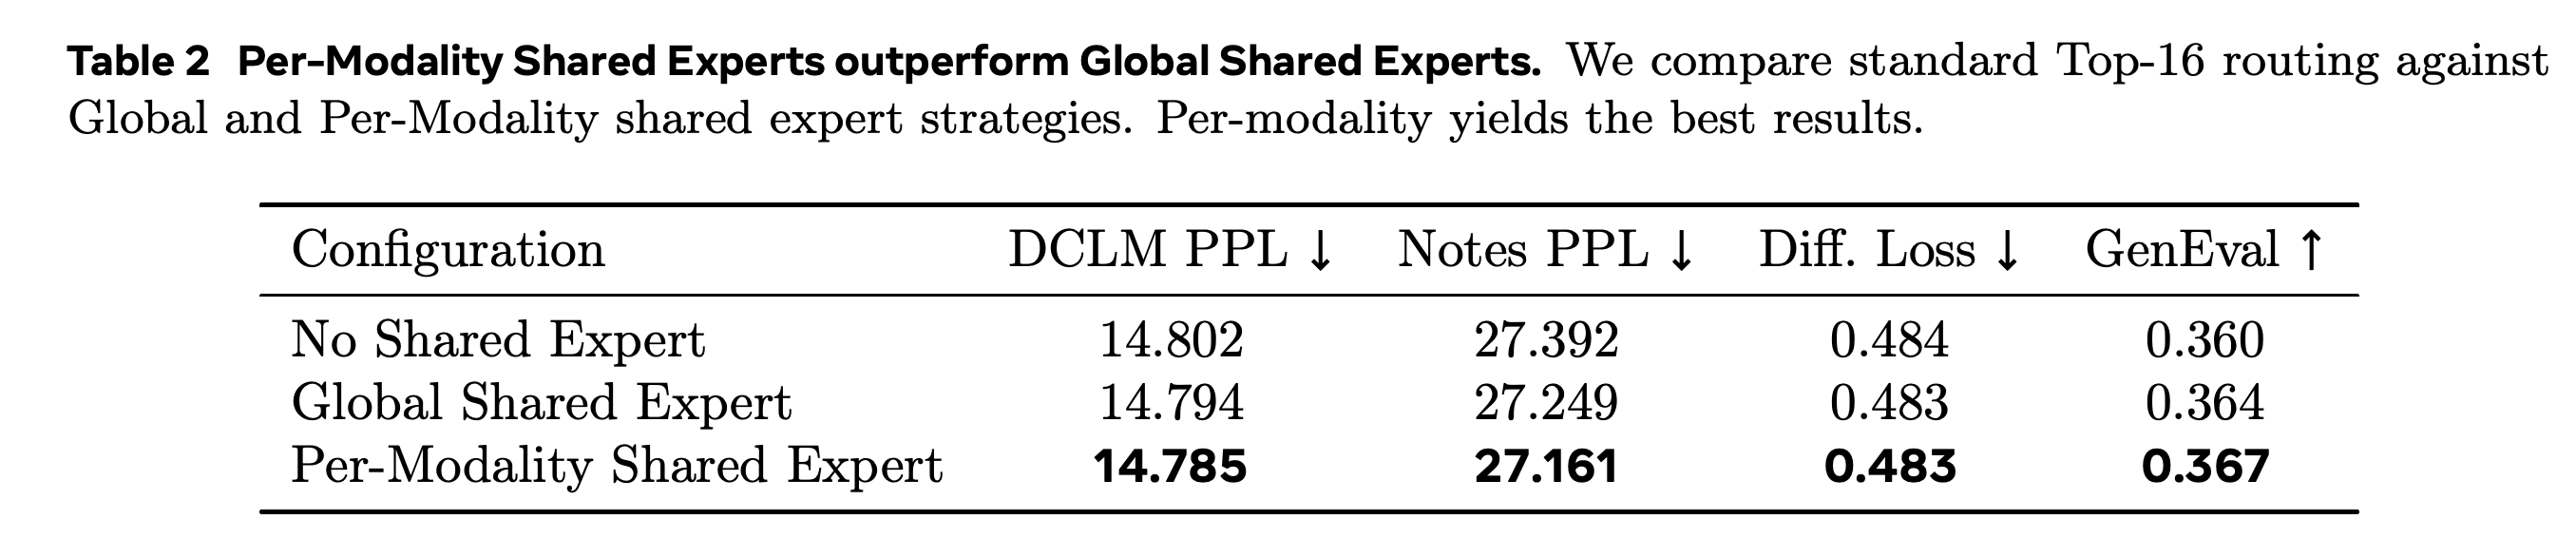
- Table 2 compares no shared expert, one globally shared expert, and per-modality shared experts at 256 total and 16 active experts. Per-modality sharing yields DCLM PPL 14.785, Notes PPL 27.161, diffusion loss 0.483, and GenEval 0.367; the differences from standard routing are small, with no uncertainty estimates reported.
Finer expert granularity sharply improves language performance before gains level off. SigLIP 2 favors x-pred for generation, whereas FLUX.1 x-pred produces worse language perplexity at high granularity; saturation points differ by modality and metric.
Expanding the expert pool while retaining 16 active experts lowers perplexity and diffusion loss. Generation gains are strongest for RAE, although GenEval does not increase monotonically at every expert-count increment.
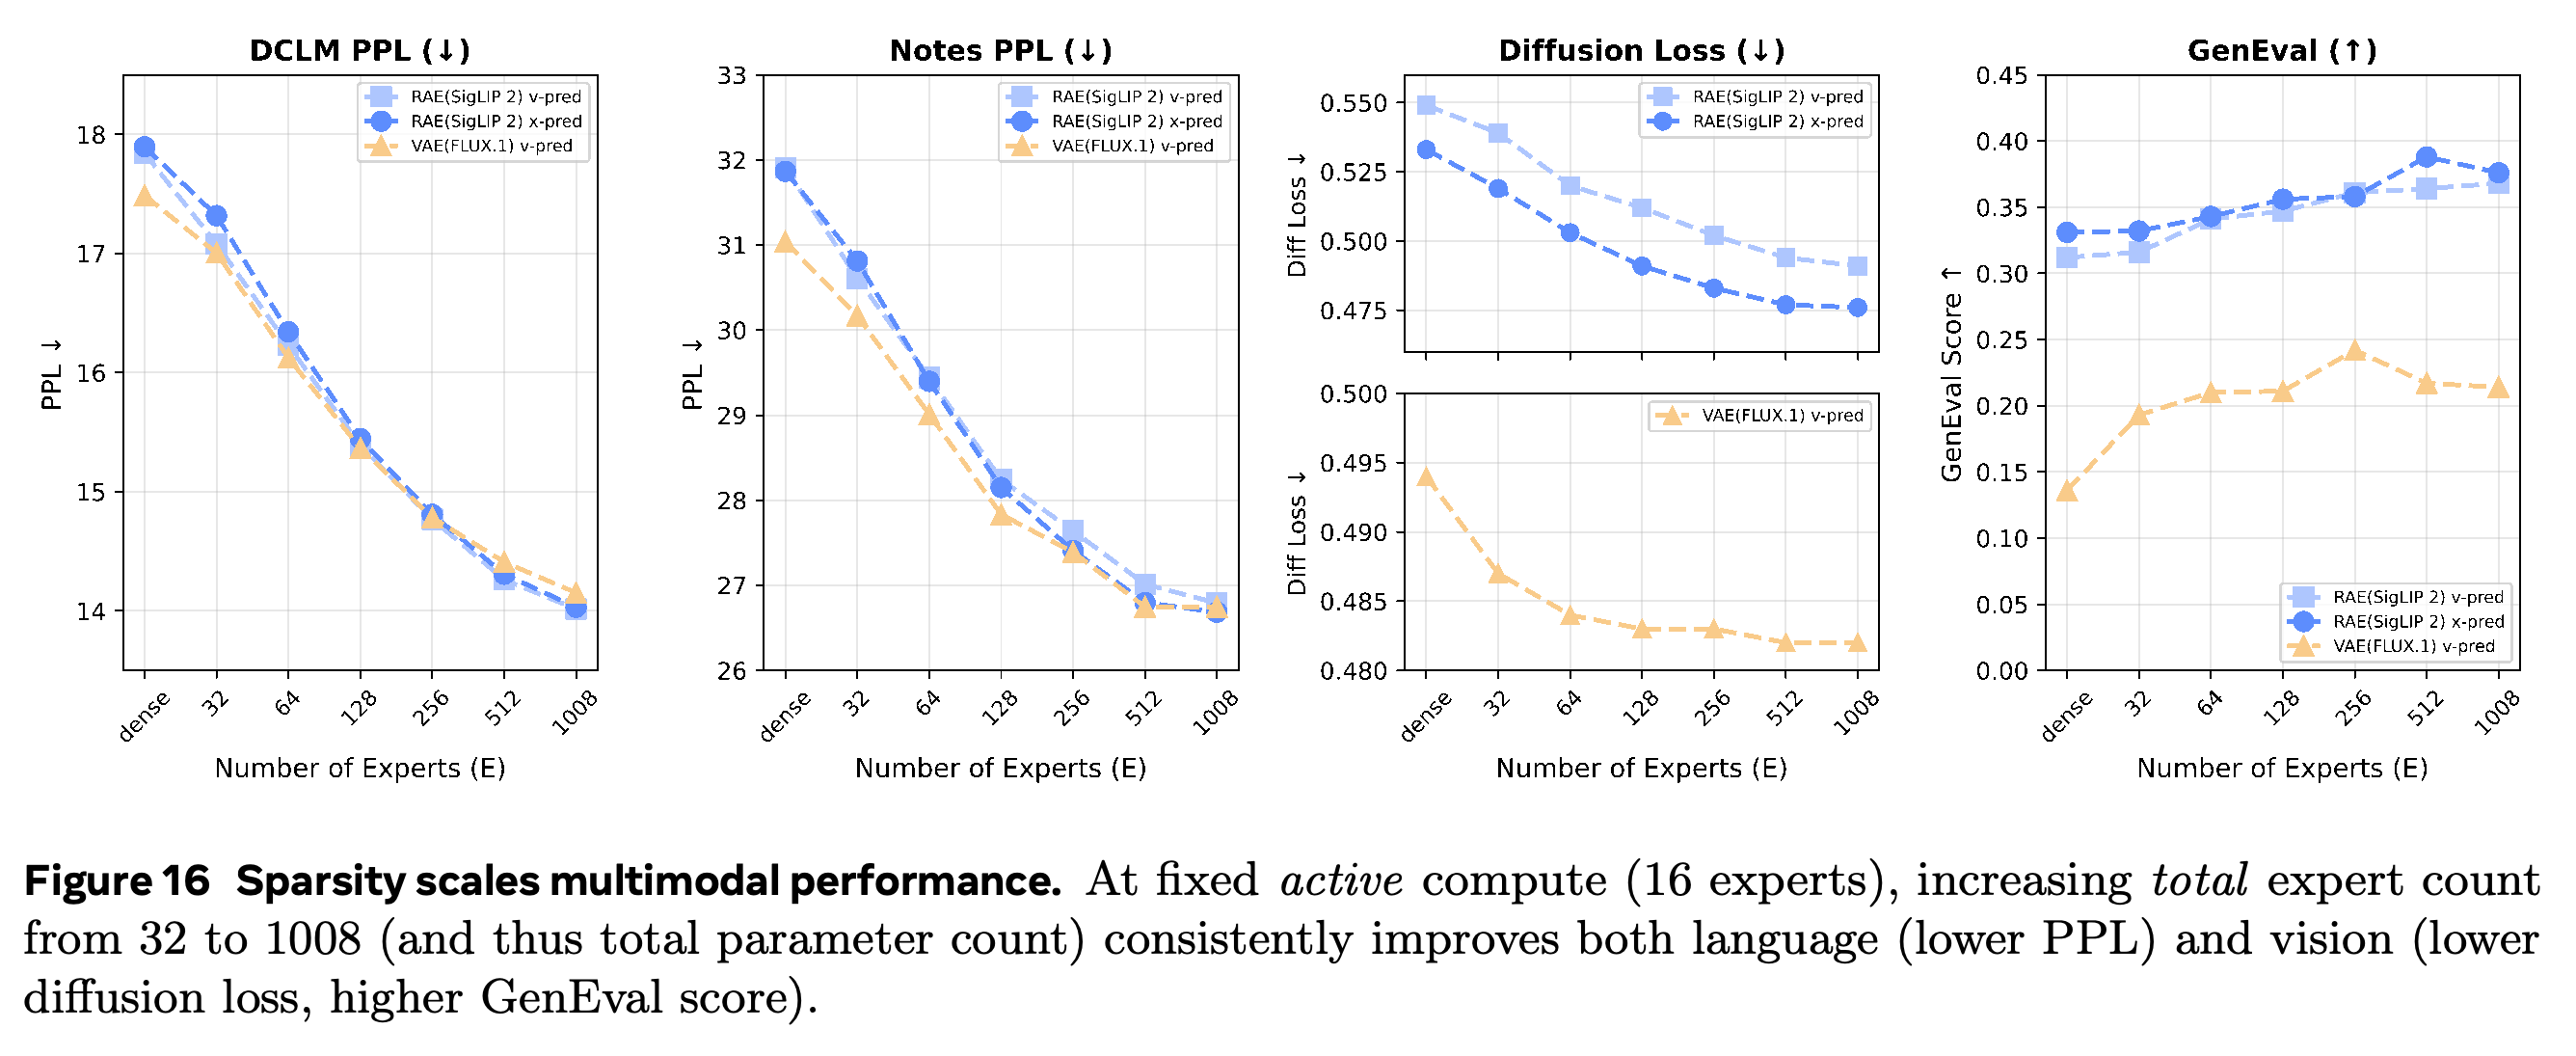
Language-loss curves improve with more experts for both encoders. FLUX.1 diffusion curves converge toward similar losses, whereas SigLIP 2 retains greater separation by expert count, indicating representation-dependent benefits from sparse capacity.
Per-modality shared experts give the best reported perplexities and GenEval, with diffusion loss tied with global sharing at 0.483. The differences are small, and the table provides no uncertainty estimates.
6.2 Emergent Expert Specialization
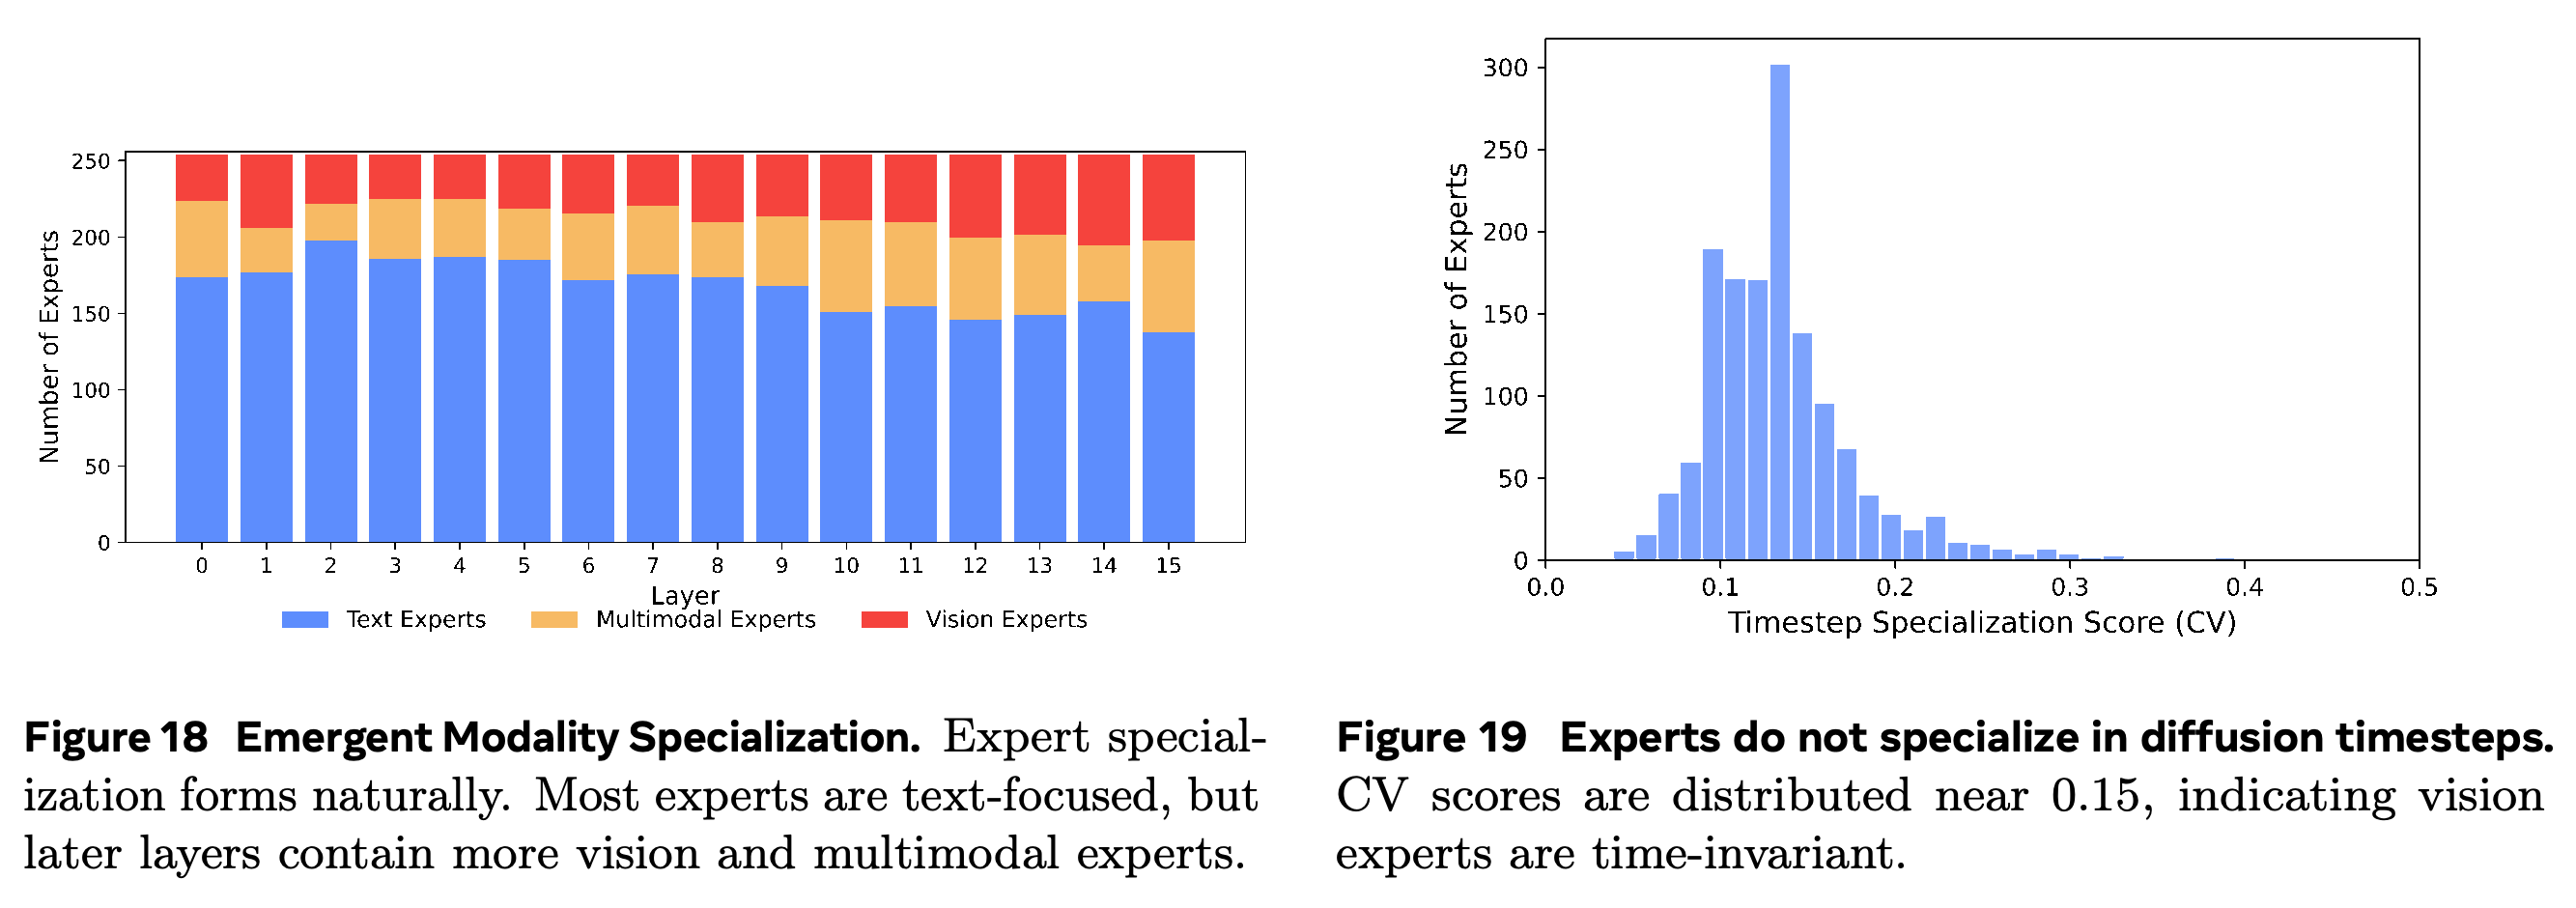
Routing analysis examines a SigLIP 2, x-pred MoE trained on 1T mixed tokens, with approximately 13.5B total parameters, 1.5B active parameters, G = 16, and 256 experts. Text-preferring experts dominate, while later layers contain more vision and multimodal experts.
- Experts are classified using normalized selection-rate differences. A score above 0.5 indicates text preference, below −0.5 indicates vision preference, and intermediate scores indicate multimodal use.
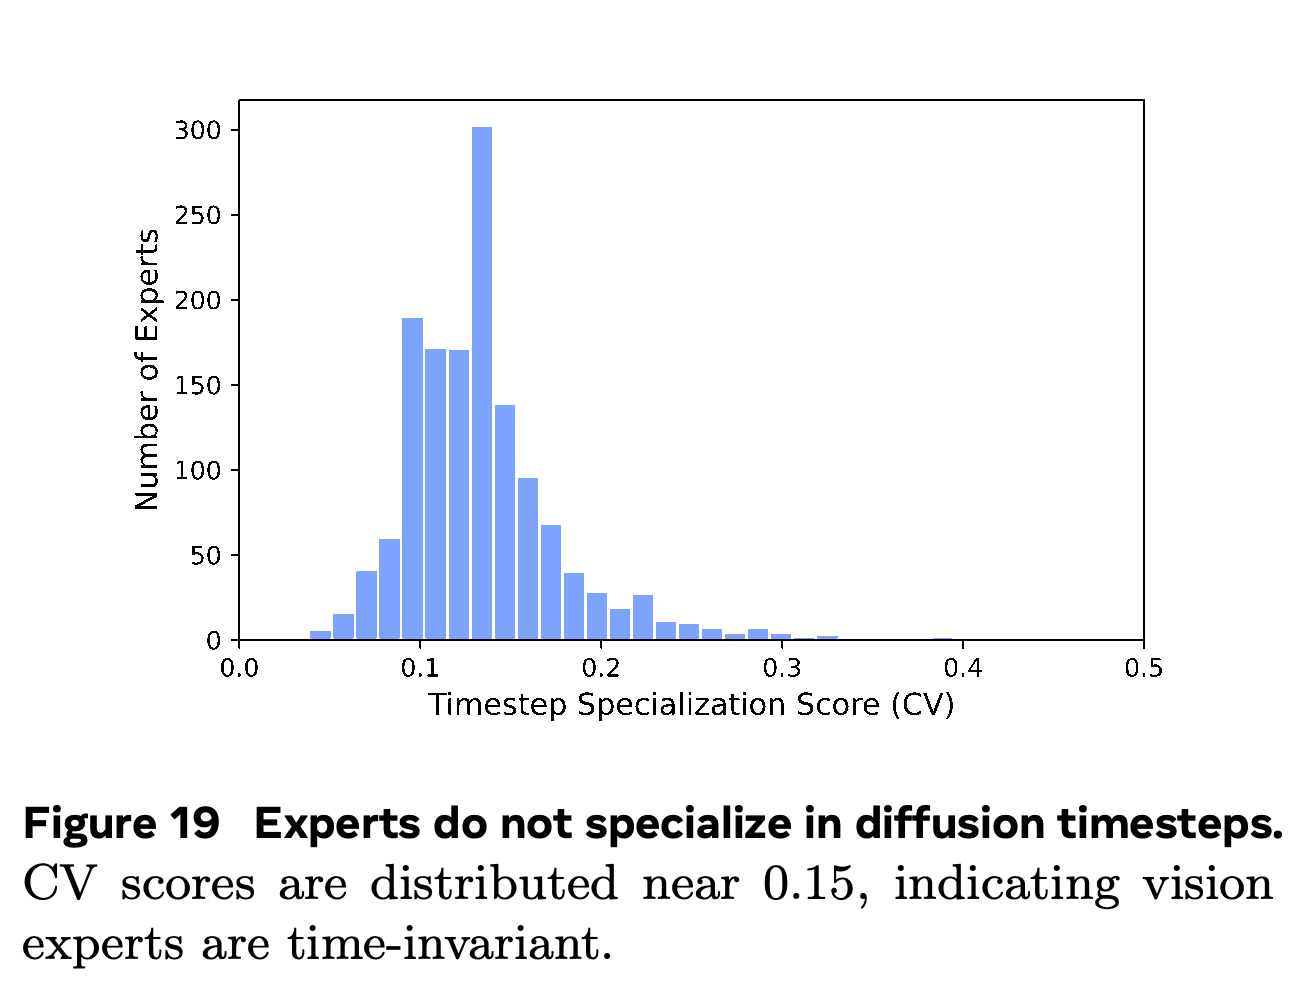
- Across 10 diffusion-timestep bins, expert-selection coefficient-of-variation scores cluster near 0.15, suggesting limited timestep specialization rather than strict time invariance.
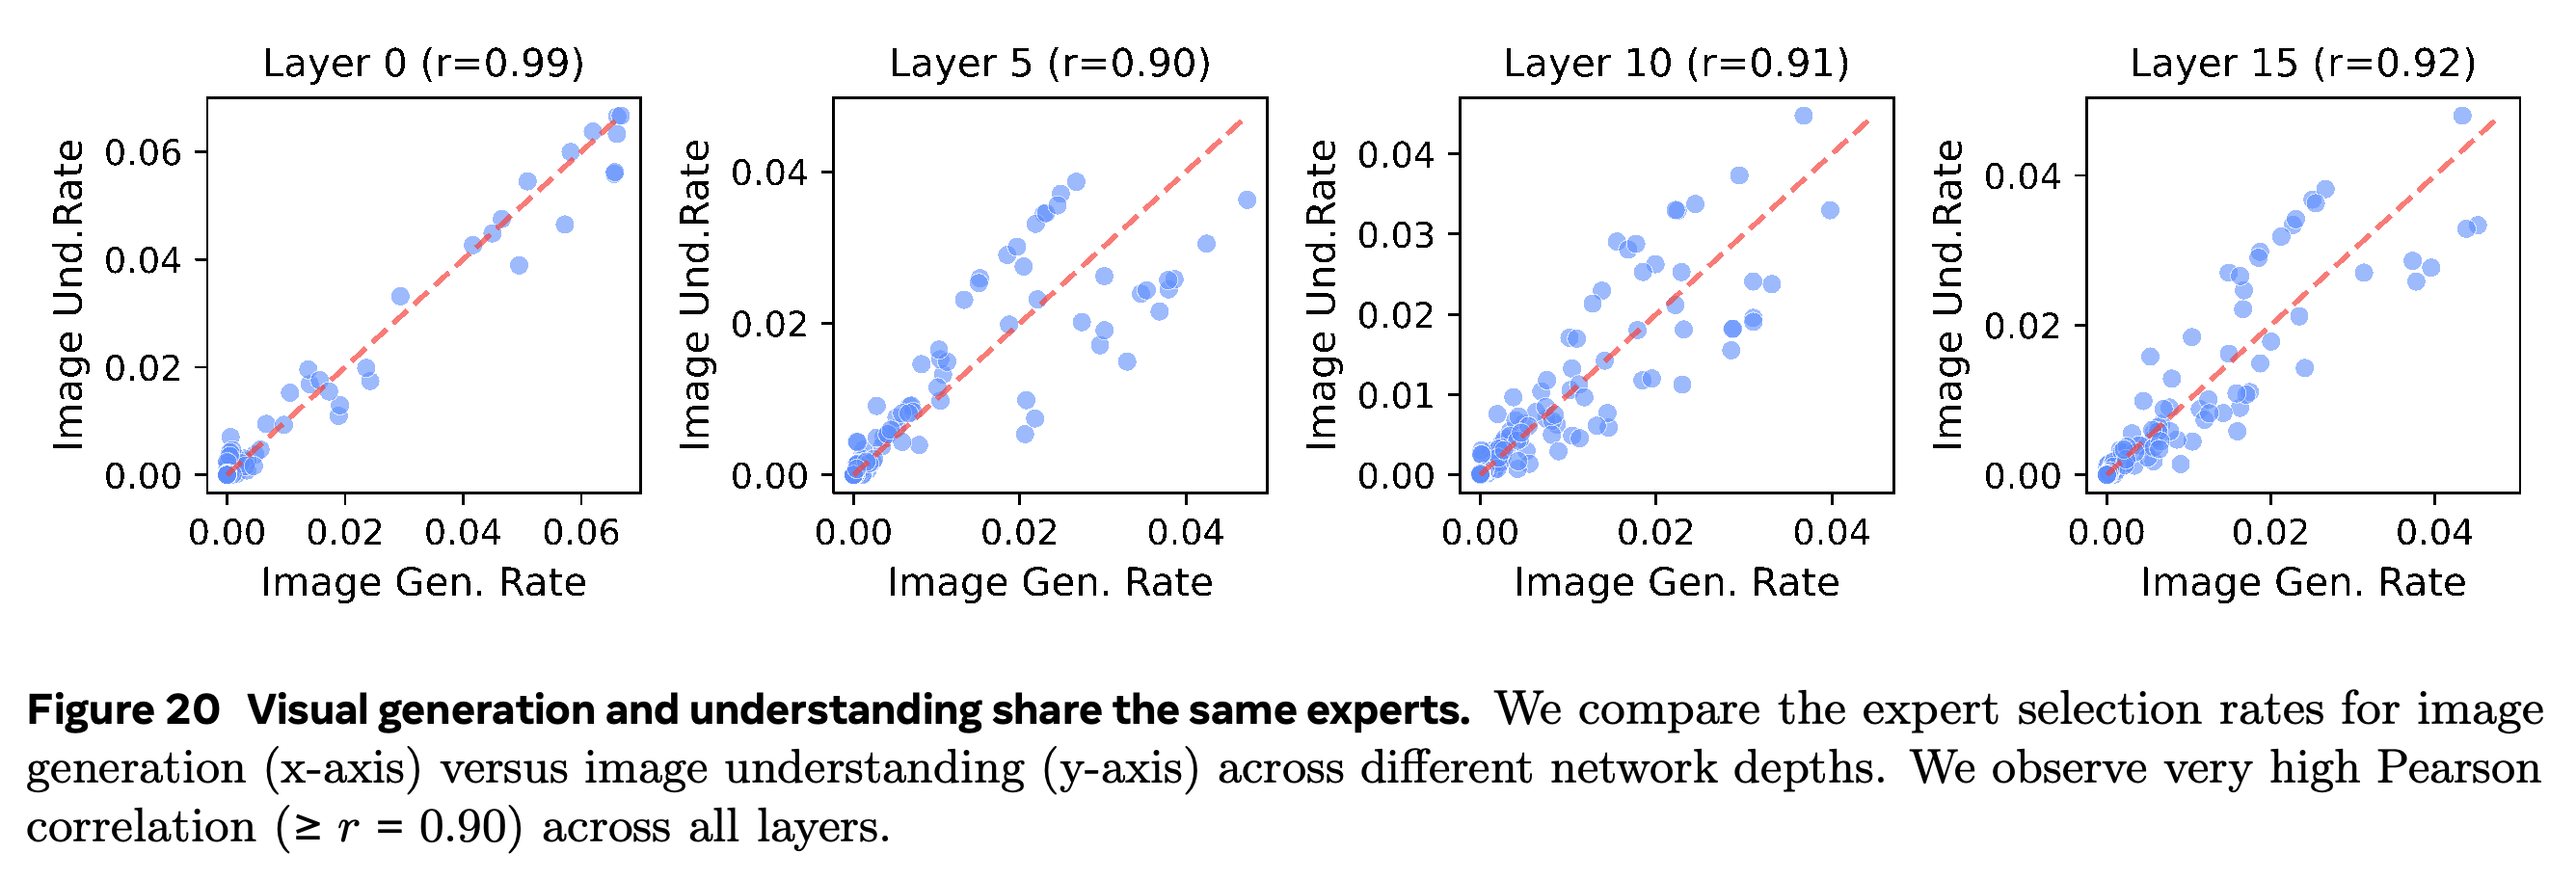
- Generation and understanding expert-selection rates correlate strongly across depth: Figure 20 shows r = 0.99, 0.90, 0.91, and 0.92 at layers 0, 5, 10, and 15. This demonstrates shared routing patterns, not identical causal functions for every expert.
Text-preferring experts are the largest category in every displayed layer. Later layers allocate a larger share to vision and multimodal use, indicating depth-dependent routing rather than a fixed equal partition.
Most timestep-specialization scores cluster near a coefficient of variation of 0.15. Routing varies relatively little across noise levels, but the nonzero scores do not establish exact time invariance.
Generation and understanding selection rates cluster near the diagonal, with correlations from 0.90 to 0.99 in the displayed layers. This indicates substantial reuse of visual experts across tasks.
6.3 Stacking Design Choices
Under matched hyperparameters, data, token counts, and FLOPs, successive design changes improve the Transfusion baseline. Modality-specific FFNs change PPL from 15.93 to 15.13 and DPG from 0.45 to 0.47; SigLIP 2 then reaches PPL 15.06 and DPG 0.57, and MoE reaches PPL 12.49 and DPG 0.63.
- The single SigLIP 2 encoder outperforms the tested SigLIP 2/SD-VAE dual-encoder configuration. Learned MoE separation also outperforms dense and Mixture of Transformers (MoT) alternatives in this from-scratch setting.
- Figure 21 shows that switching MoE + SigLIP 2 to x-pred improves DPG to 0.65 while increasing PPL to 12.69, leaving a small language-generation trade-off.
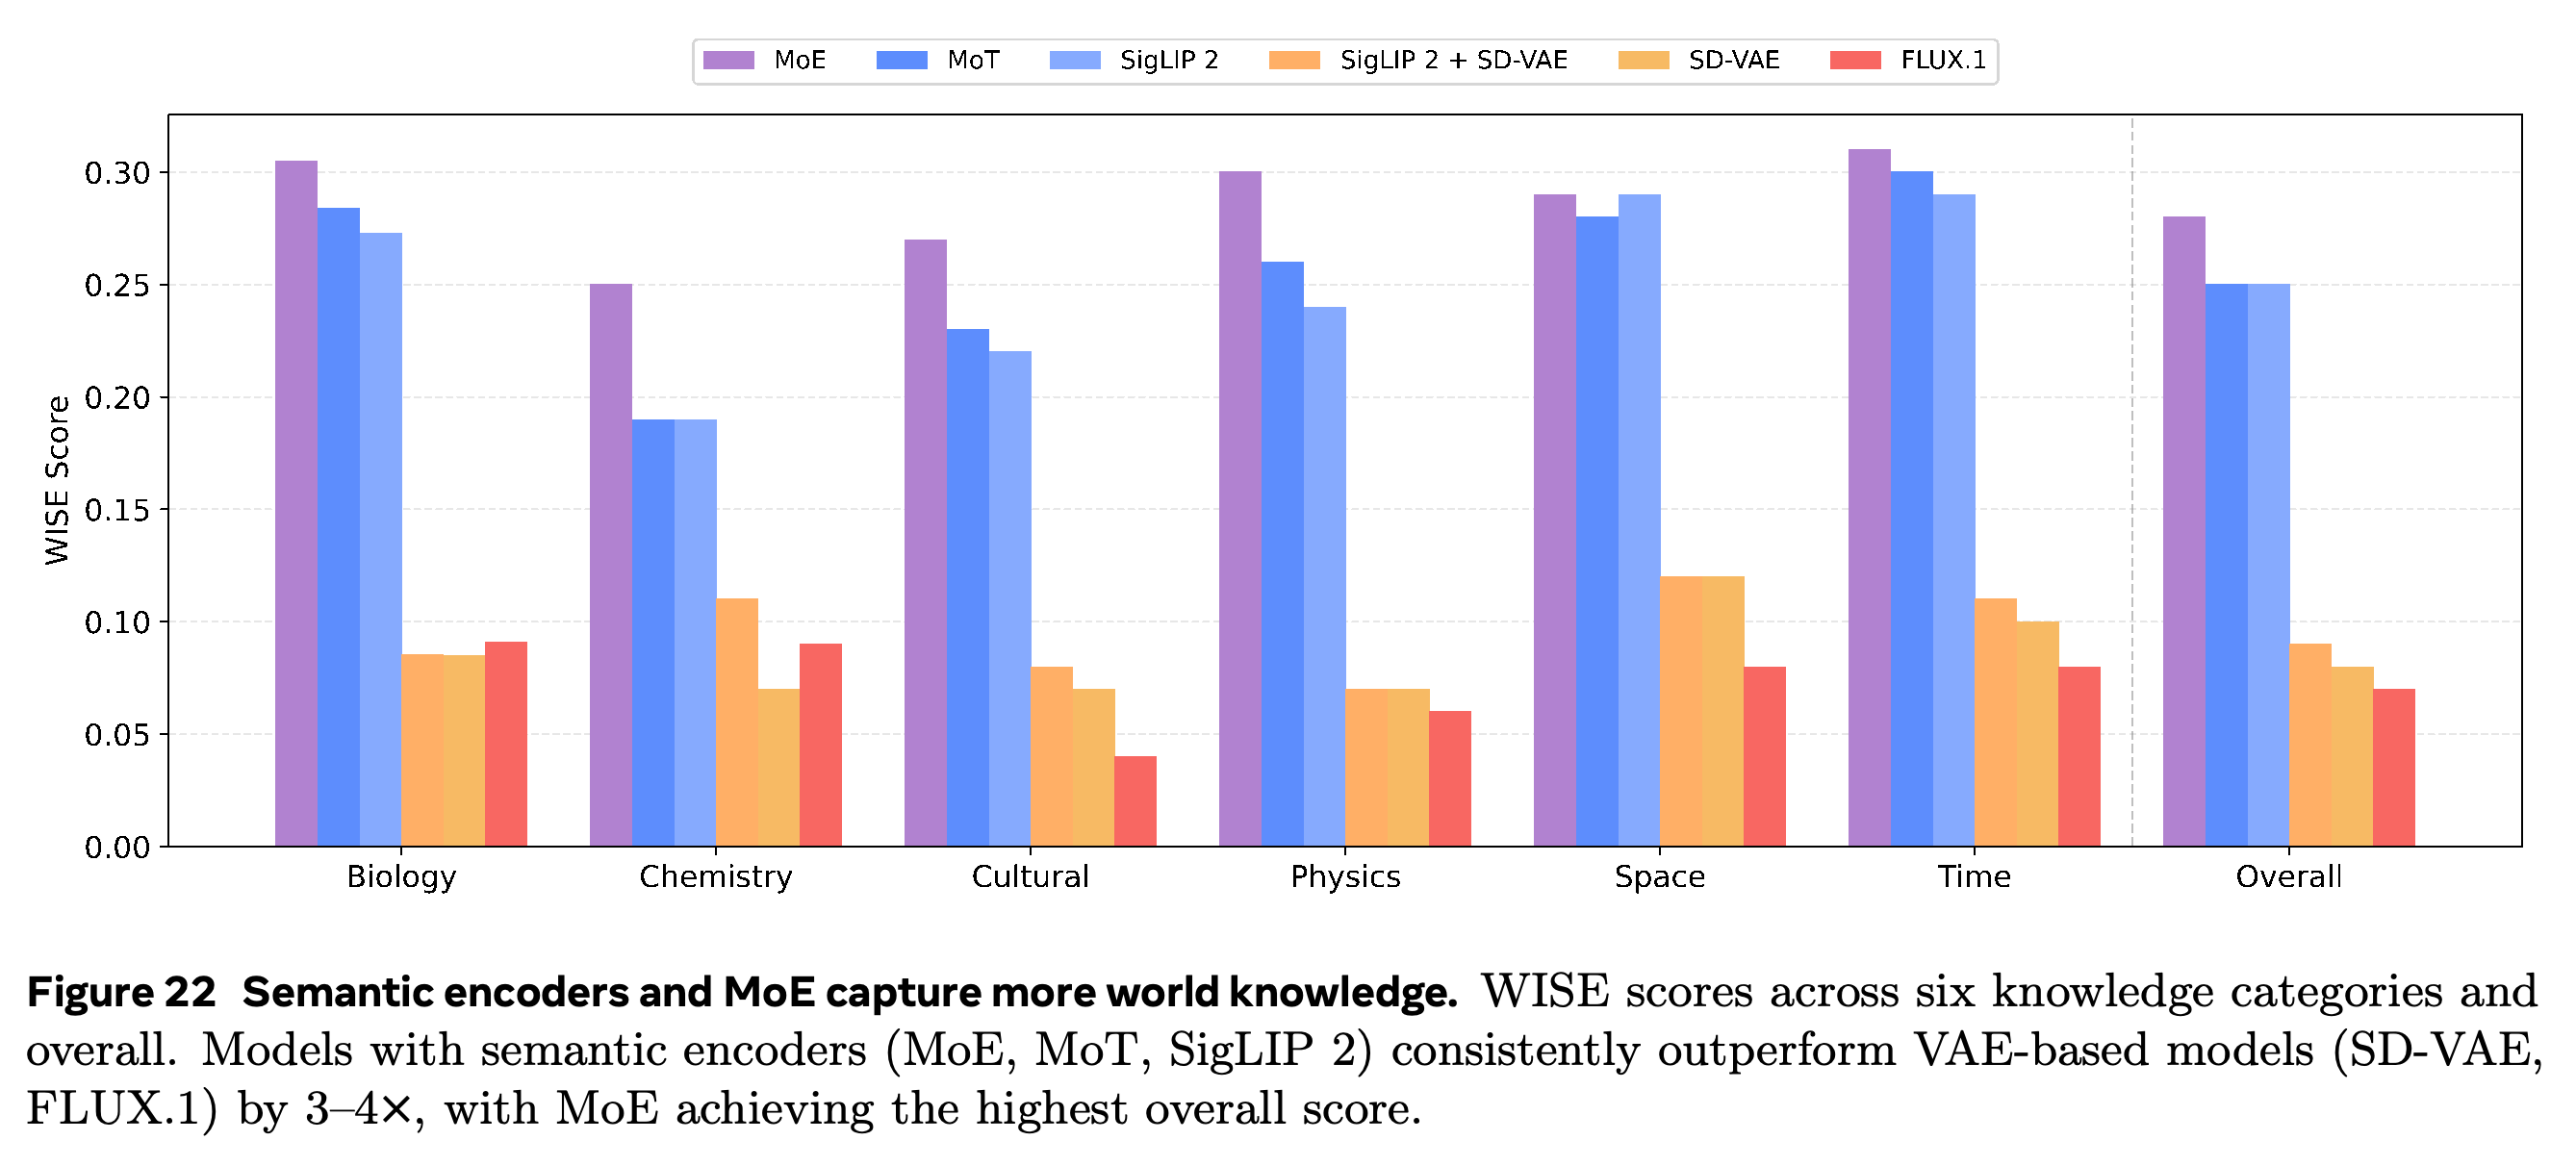
- On WISE, semantic-encoder configurations substantially outperform VAE-based configurations; the authors summarize the difference as approximately 3–4×, and MoE has the highest overall score. The category-wise ratios vary, so this is not a uniform multiplicative gain or a comprehensive measure of physical understanding.
Semantic-encoder models outperform VAE-based configurations across the displayed WISE categories, with varying category-wise ratios. MoE gives the strongest overall score on knowledge-informed generation.
7 Scaling Laws for Unified Multimodal Models
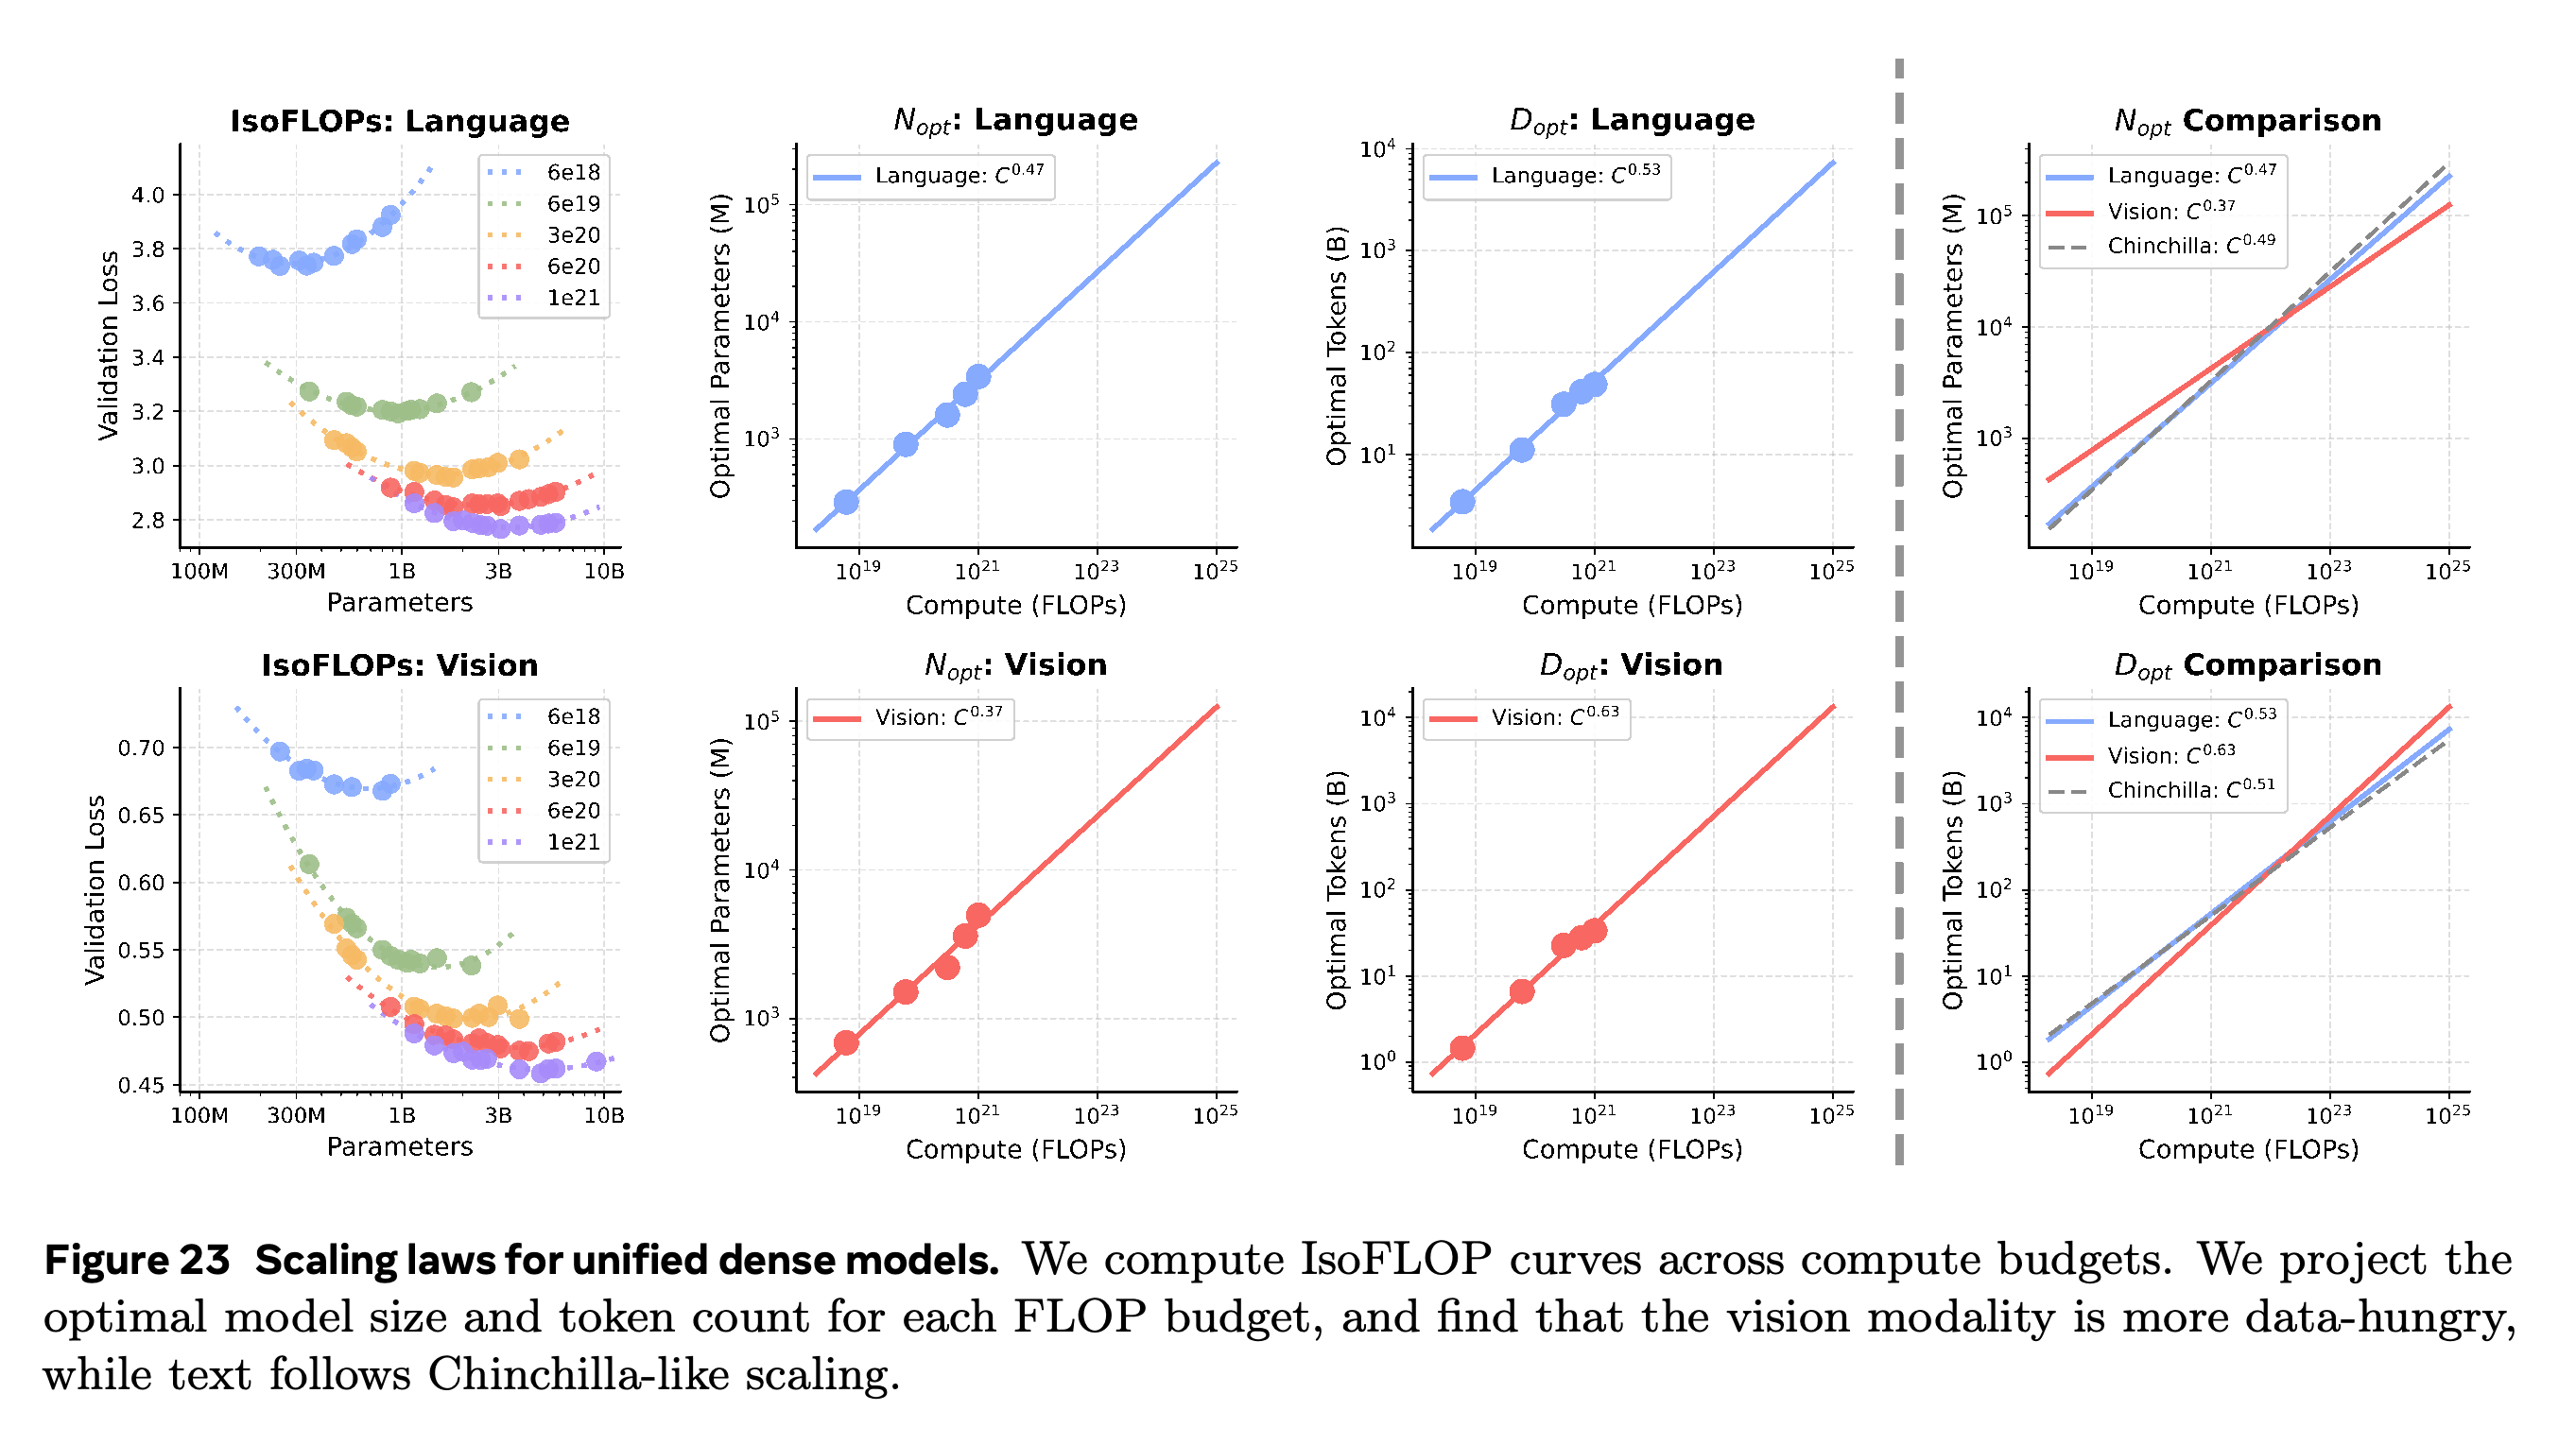
IsoFLOP analysis sweeps model size N and token count D at fixed compute C, using 6ND ≈ C for dense models and active parameters for MoE. Parabolic fits in log-parameter space estimate the loss-minimizing model size, followed by power-law fits N_opt ∝ C^a and D_opt ∝ C^b with a + b = 1.
- Dense fits use compute budgets 6×10^18, 6×10^19, 3×10^20, 6×10^20, and 10^21 FLOPs. Language gives a ≈ 0.47 and b ≈ 0.53; vision gives a ≈ 0.37 and b ≈ 0.63.
- These fits make vision more data-intensive relative to language. The paper extrapolates relative data-demand growth of O(N^0.57), corresponding to 14× at 100B parameters and 51× at 1T parameters relative to 1B.
- The 100B- and 1T-parameter estimates are extrapolations from fitted trends, not measurements from models trained at those sizes.
Separate loss minima imply different parameter/data allocations for the two modalities. Dense language fits favor nearly balanced scaling, while vision has a larger data exponent, 0.63 versus 0.53; the extended fitted lines are extrapolations.
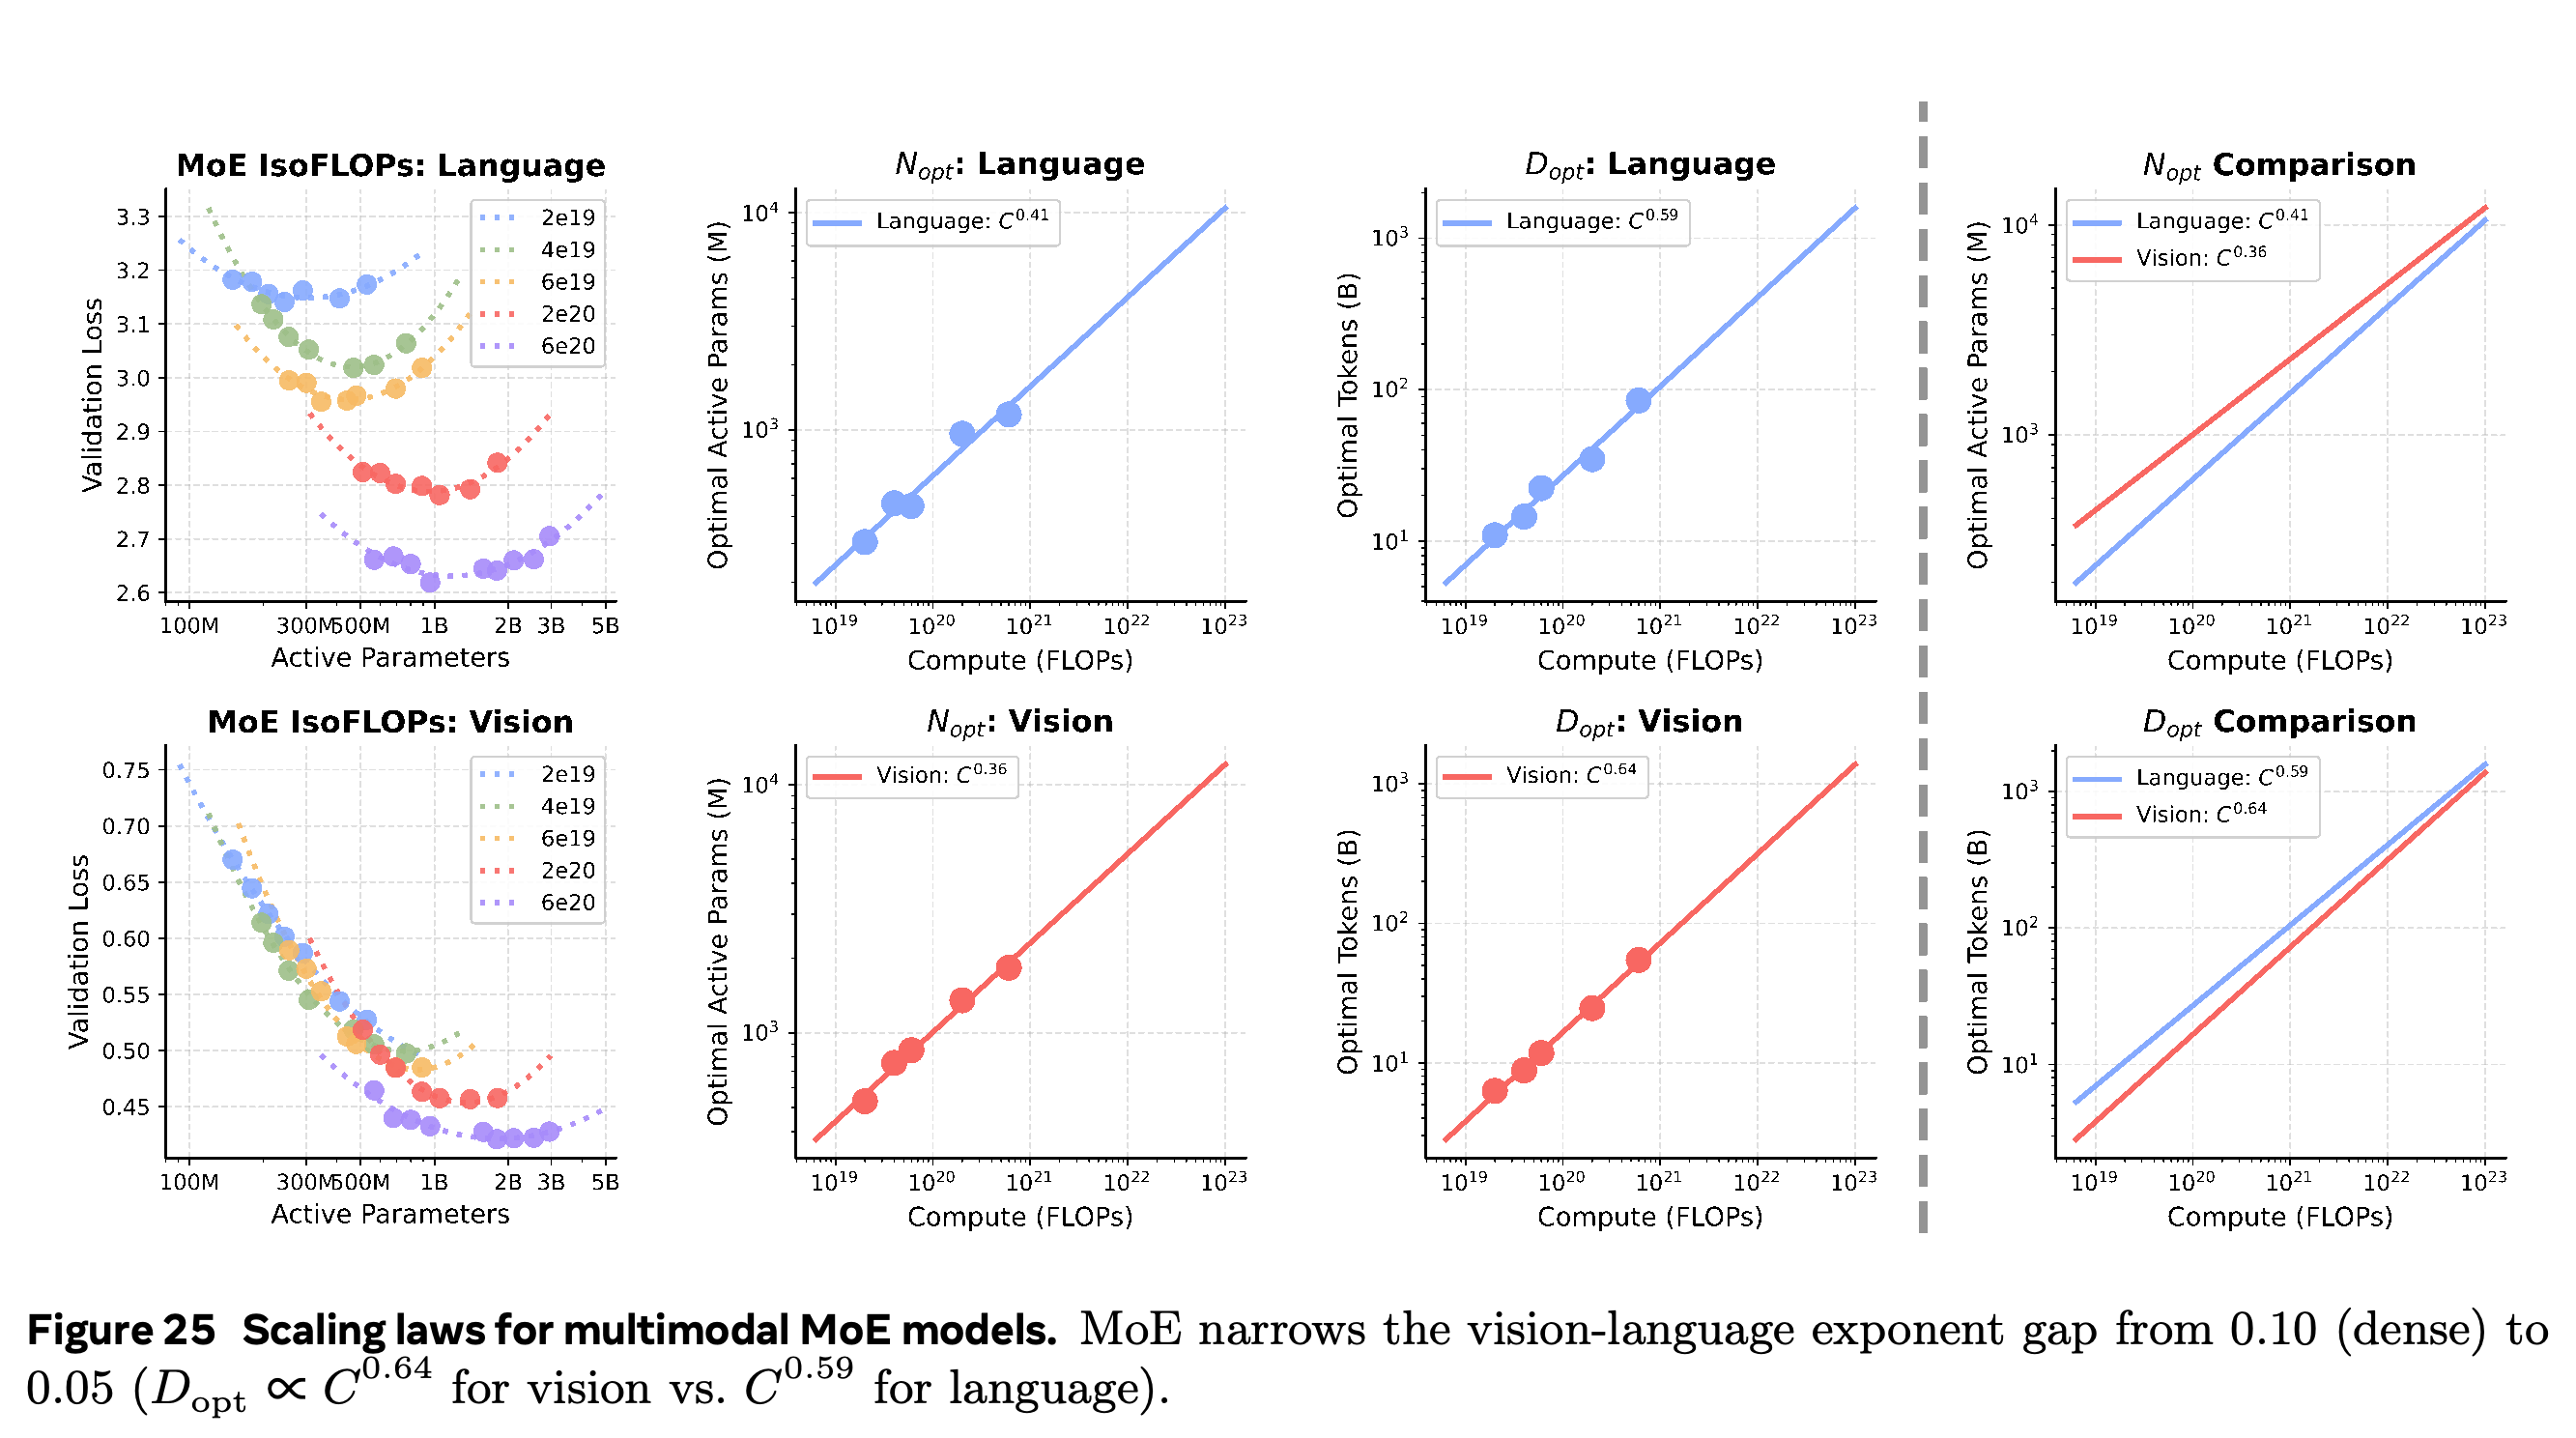
With a sparsity ratio of 16, MoE fits give language a ≈ 0.41, b ≈ 0.59 and vision a ≈ 0.36, b ≈ 0.64. The exponent gap falls from 0.10 to 0.05 because language shifts toward a more data-intensive regime, while vision’s fitted exponent changes little.
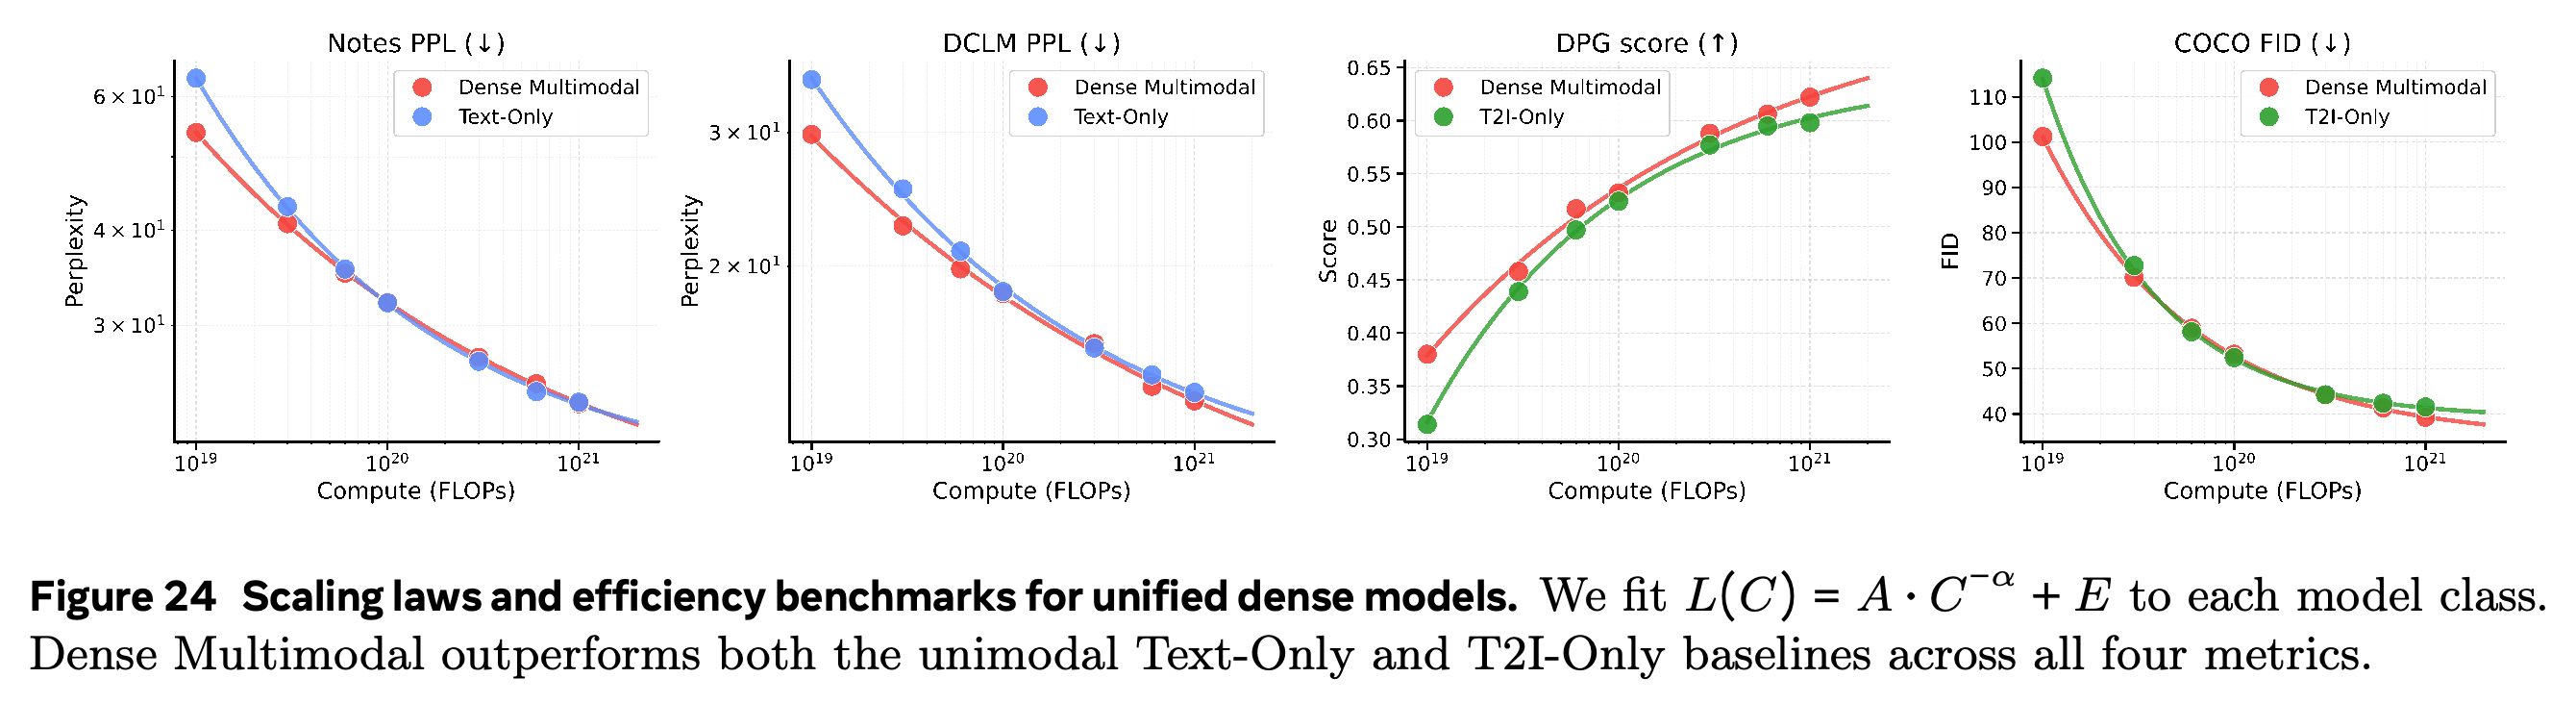
- Efficiency curves fit L(C) = A·C^(−α) + E, with E selected by grid search to minimize log-space MSE.
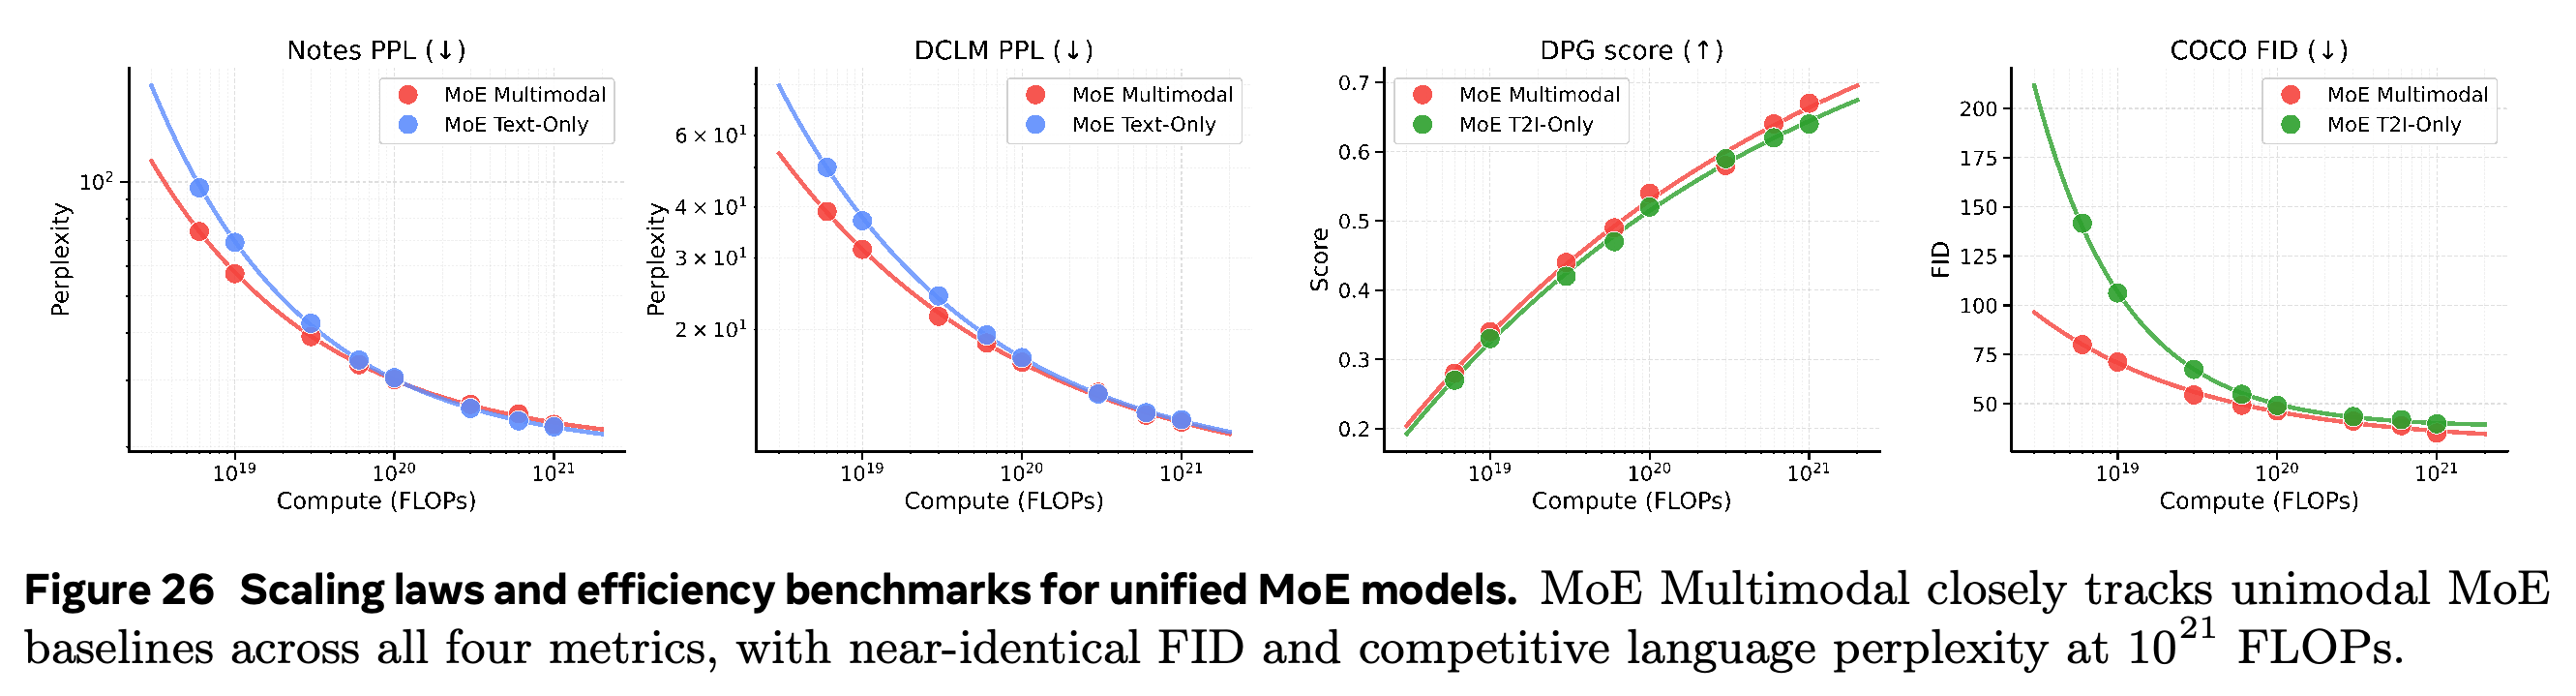
- At 10^21 FLOPs, dense multimodal training reaches Notes PPL 23.7 versus 23.8 and DCLM PPL 13.3 versus 13.6 for text-only; generation reaches DPG 0.622 versus 0.598 and FID 39.3 versus 41.5 for T2I-only.
- At 10^21 FLOPs, multimodal MoE reaches DCLM PPL 12.3 versus 12.0 for MoE text-only and FID 39.2 versus 39.8 for MoE T2I-only. This supports near-unimodal performance at matched compute, not superiority on every metric.
- Fixed active FLOPs do not imply unchanged memory requirements or wall-clock cost. Appendix A identifies uneven token distribution across experts as a hardware-utilization bottleneck.
At matched compute, dense multimodal language curves remain close to text-only curves, while generation generally improves over T2I-only. The reported 10^21-FLOP results support joint-training efficiency without requiring uniform gains at every budget.
MoE shifts the fitted language token exponent to 0.59, closer to vision's 0.64. The remaining gap of 0.05 indicates partial alignment rather than identical compute-optimal scaling.
Unified MoE curves closely follow the unimodal references. At 10^21 FLOPs, multimodal DCLM PPL is slightly worse, 12.3 versus 12.0, while FID is slightly better, 39.2 versus 39.8.
8 Related Work
The paper distinguishes native multimodal pretraining from adaptation of pretrained language models, and understanding-only models from models that generate both text and images. Its contribution is a controlled study of the Transfusion design space rather than a new unified modeling objective.
- Architectural comparisons connect shared Transformers, modality-specific FFNs, deeper MoT separation, and learned MoE routing.
- The representation study extends work showing that semantic latent spaces support diffusion, while the navigation experiments connect general multimodal pretraining to action-conditioned world modeling.
- The scaling analysis extends Chinchilla-style parameter/data trade-offs to separate language and visual losses within one generative model.
9 Discussion
The discussion identifies caption-distribution shifts and rigid capacity allocation as candidate sources of modality competition. The experiments favor a single semantic representation, diverse data, and learned sparse routing within the tested pretraining regimes, without fully isolating the causes of language degradation.
- The authors acknowledge that semantic encoders can lose fine-grained reconstruction detail, multimodal training can slightly worsen out-of-distribution text generalization, and the MoE design exploration is incomplete.
- Navigation planning and selected language-conditioned rollouts demonstrate transfer to visual-state prediction. Broader claims about physical reasoning and future native multimodal systems remain interpretations rather than direct experimental findings.
Appendix
- A Limitations and Future Work: The appendix supplements the main experiments with methodology, additional analyses, implementation details, world-model examples, and data documentation. The study excludes interleaved training data and does not investigate reinforcement-learning post-training. Uneven expert loads remain a hardware-utilization limitation, so sparse active-compute advantages should be distinguished from realized system efficiency.
- B Extended Methodology: Unified Multimodal Mechanics: Each image or video frame is enclosed by <BOI> and <EOI>, with causal attention between blocks and bidirectional attention within a frame. Text following an image conditions on noisy visual latents during training, and modality-specific output heads compute the two losses in one forward-backward pass. During inference, sampling <BOI> suspends text generation, inserts noisy visual tokens, performs 25-step denoising, appends <EOI>, and resumes autoregressive text generation.
- C Shared vs. Modality-Specific FFNs: The approximately 1T-token comparison keeps active computation constant while increasing total parameters through separate vision and language FFNs. It supports the default capacity-separation choice but does not compare models with identical total parameter counts.
- D Additional Results and Exploration: D.1 Layer-wise Performance reports that SigLIP 2 ImageNet accuracy rises from 12.8% at layer 0 to 86.3% at layer 26 while reconstruction PSNR falls from 29.6 dB to 20.9 dB; the trained Transformer largely preserves the encoder’s semantic quality. D.2 Loss Centering uses an EMA-derived shared loss center and adaptive per-modality weights: for SigLIP 2, DPG rises from 0.570 to 0.612 while PPL rises from 15.06 to 15.36. D.3 Text Performance on Data Composition Studies finds small DCLM benefits and slight Notes degradation when visual data is added at fixed text budgets.
- E Implementation Details: E.1 and E.2 specify linear projections, default loss weights 1.0 and 3.0, sequence length 4096, 128 GPUs, batch size 4 per GPU, AdamW peak LR 3×10^−4, 1000 warmup steps, and cosine decay to 5% of peak LR. E.3 specifies autoregressive text inference, 25-step Euler visual sampling, CFG 3.0, and pretrained decoders; E.4 standardizes every encoder to 256 visual tokens, using PixelUnshuffle(2) and PixelShuffle(2) for VAE grids. E.5 documents the DCLM/SSTK token-budget grid; E.6 uses 1-epoch VQA finetuning at peak LR 1×10^−5; E.7 describes MoE sweeps on 64 NVIDIA H200 GPUs, with total parameters increasing from 2.30B to 51.46B and active parameters from 1.50B to 1.53B; E.8 documents normalized routing scores and generation-understanding correlations for a 1T-token model.
- F World Modeling: F.1 Implementation Details specifies CEM planning, RECON evaluation, the WASD displacement tuples, and a 200B-token data-ratio study on 128 H100 GPUs. Its base mixture assigns 25% to text and 25% to video, with navigation data varied within the remaining multimodal allocation. F.2 More Navigation Examples presents language-conditioned rollouts and counterfactual trajectories from shared context, extending the qualitative evidence without a quantitative natural-language action-following evaluation.
- G Data: G.1 Data Sources enumerates datasets and supervision formats. G.2 MetaCLIP Recaption uses Qwen2.5-VL-32B-Instruct through vLLM with 8-way tensor parallelism, temperature 0.6, top-p 0.95, and at most 128 generated tokens; the Recaptioning Prompt requests specific, information-dense captions of 1–2 sentences. G.3 Video Action Annotations describes approximately 12M model-generated, self-verified annotations with 1–4 context and 1–4 result frames, while G.4 Cosine Distance Computation documents the 100K-sample, 2000-character-truncated centroid analysis using Qwen3-Embedding-8B.
Brief Thoughts
The strongest contribution is the controlled separation of representation, data, and routing effects, supported by equal-compute unimodal comparisons. The evidence favors RAE-style semantic latents and fine-grained MoE, conditional on pretrained vision components, modest OOD language costs, representation-specific exceptions, and the limited navigation evaluation. The scaling results quantify a reduced allocation mismatch, with a residual exponent gap of 0.05; large-model data-demand estimates remain extrapolations. The 1% navigation result demonstrates data-efficient alignment within the tested mixture, not acquisition without domain data. General physical understanding requires evidence beyond trajectory errors and selected rollouts.