


Scaling Embeddings Outperforms Scaling Experts in Language Models | Summary
29 Jan 2026 | Paper Review N-gram Embeddings Mixture-of-Experts Scaling LawsContents
- Summary
- 1 Introduction
- 2 N-gram Embedding Layer
- 3 Comparative Analysis of Expert and Embedding Scaling
- 4 Efficient Inference
- 5 Integration with Per-Layer Embedding
- 6 LongCat-Flash-Lite
- 7 Conclusions
- Appendix
- Brief Thoughts
This article explains the key points of Scaling Embeddings Outperforms Scaling Experts in Language Models.
- 2026-01-29 (arXiv)
- Liu, Hong, Zhang, Jiaqi, Wang, Chao, Hu, Xing, Lyu, Linkun, Sun, Jiaqi, Yang, Xurui, Wang, Bo, Li, Fengcun, Qian, Yulei, et al.
- Meituan LongCat Team
- Paper
Summary
- The paper studies when sparse parameter capacity should be allocated to N-gram Embedding rather than additional MoE experts. Parameter-matched experiments show an embedding advantage after expert scaling reaches diminishing returns, but not at low sparsity or with excessive embedding allocation.
- Experiments with 280M, 790M, and 1.3B activated parameters use 300B training tokens and Chinese and English validation losses. The advantage increases with model width and contracts in deeper configurations; vocabulary sizing, multiple hash sub-tables, and Embedding Amplification also affect the results.
- LongCat-Flash-Lite applies these findings to a 68.5B-parameter model with 31.4B N-gram Embedding parameters and 2.9B–4.5B activated parameters per token. It improves on its parameter-equivalent expert-only baseline on 9 of 11 base-model benchmarks at 1.3T tokens, while its chat model leads the reported agentic comparisons but not the general-domain or mathematical comparisons.
1 Introduction
MoE expansion separates total capacity from per-token computation, but increasing expert counts brings diminishing performance gains, communication overhead, and memory-bandwidth pressure. The report investigates embeddings as another sparse scaling dimension, examining capacity allocation, architectural constraints, alternative embedding structures, and decoding efficiency.
- Embedding lookup has O(1) indexing complexity with respect to table size, although the complete N-gram Embedding branch also requires hashing, projections, and communication.
- The contribution is primarily a comparative scaling and systems study using established N-gram Embedding designs, rather than the introduction of N-gram Embedding itself.
2 N-gram Embedding Layer
N-gram Embedding augments each token with hashed representations of the local sequences ending at that token. Figure 1 shows the final Over-Encoding design: each n-gram order has K sub-tables with different vocabulary sizes, whose outputs are projected to the model hidden dimension and averaged with the base embedding.
- Equation (1): e_i = (1/N)(E_0(t_i) + ∑_{n=2}^{N} E_n(H_n(t_{i−n+1}, …, t_i))), with t_j = 0 for j ≤ 0.
- Equation (2) uses a polynomial rolling hash: H_n(t_{i−n+1}, …, t_i) = (∑_{j=0}^{n−1} t_{i−j} V_0^j) % V_n.
- Equation (3): e_i = (E_0(t_i) + ∑_{n=2}^{N}∑_{k=1}^{K} W_{n,k}E_{n,k}(H_{n,k}(t_{i−n+1}, …, t_i)))/((N−1)K+1). Each sub-table has width D/((N−1)K), keeping the embedding parameter budget invariant to N and K under the stated sizing design.
3 Comparative Analysis of Expert and Embedding Scaling
The scaling study integrates N-gram Embedding into the Longcat-Flash architecture and trains models from scratch with 280M, 790M, or 1.3B activated parameters. Base MoE sparsity ranges from 35% to 98%; each embedding-augmented configuration is paired with an expert-expanded baseline having the same total parameter count.
- All configurations are trained on 300B tokens and compared using training loss and separate Chinese and English validation losses.
- The horizontal scaling variable is the ratio of total parameters to activated parameters, used as a proxy for sparsity.
3.1 Optimal Timing for N-gram Embedding Integration
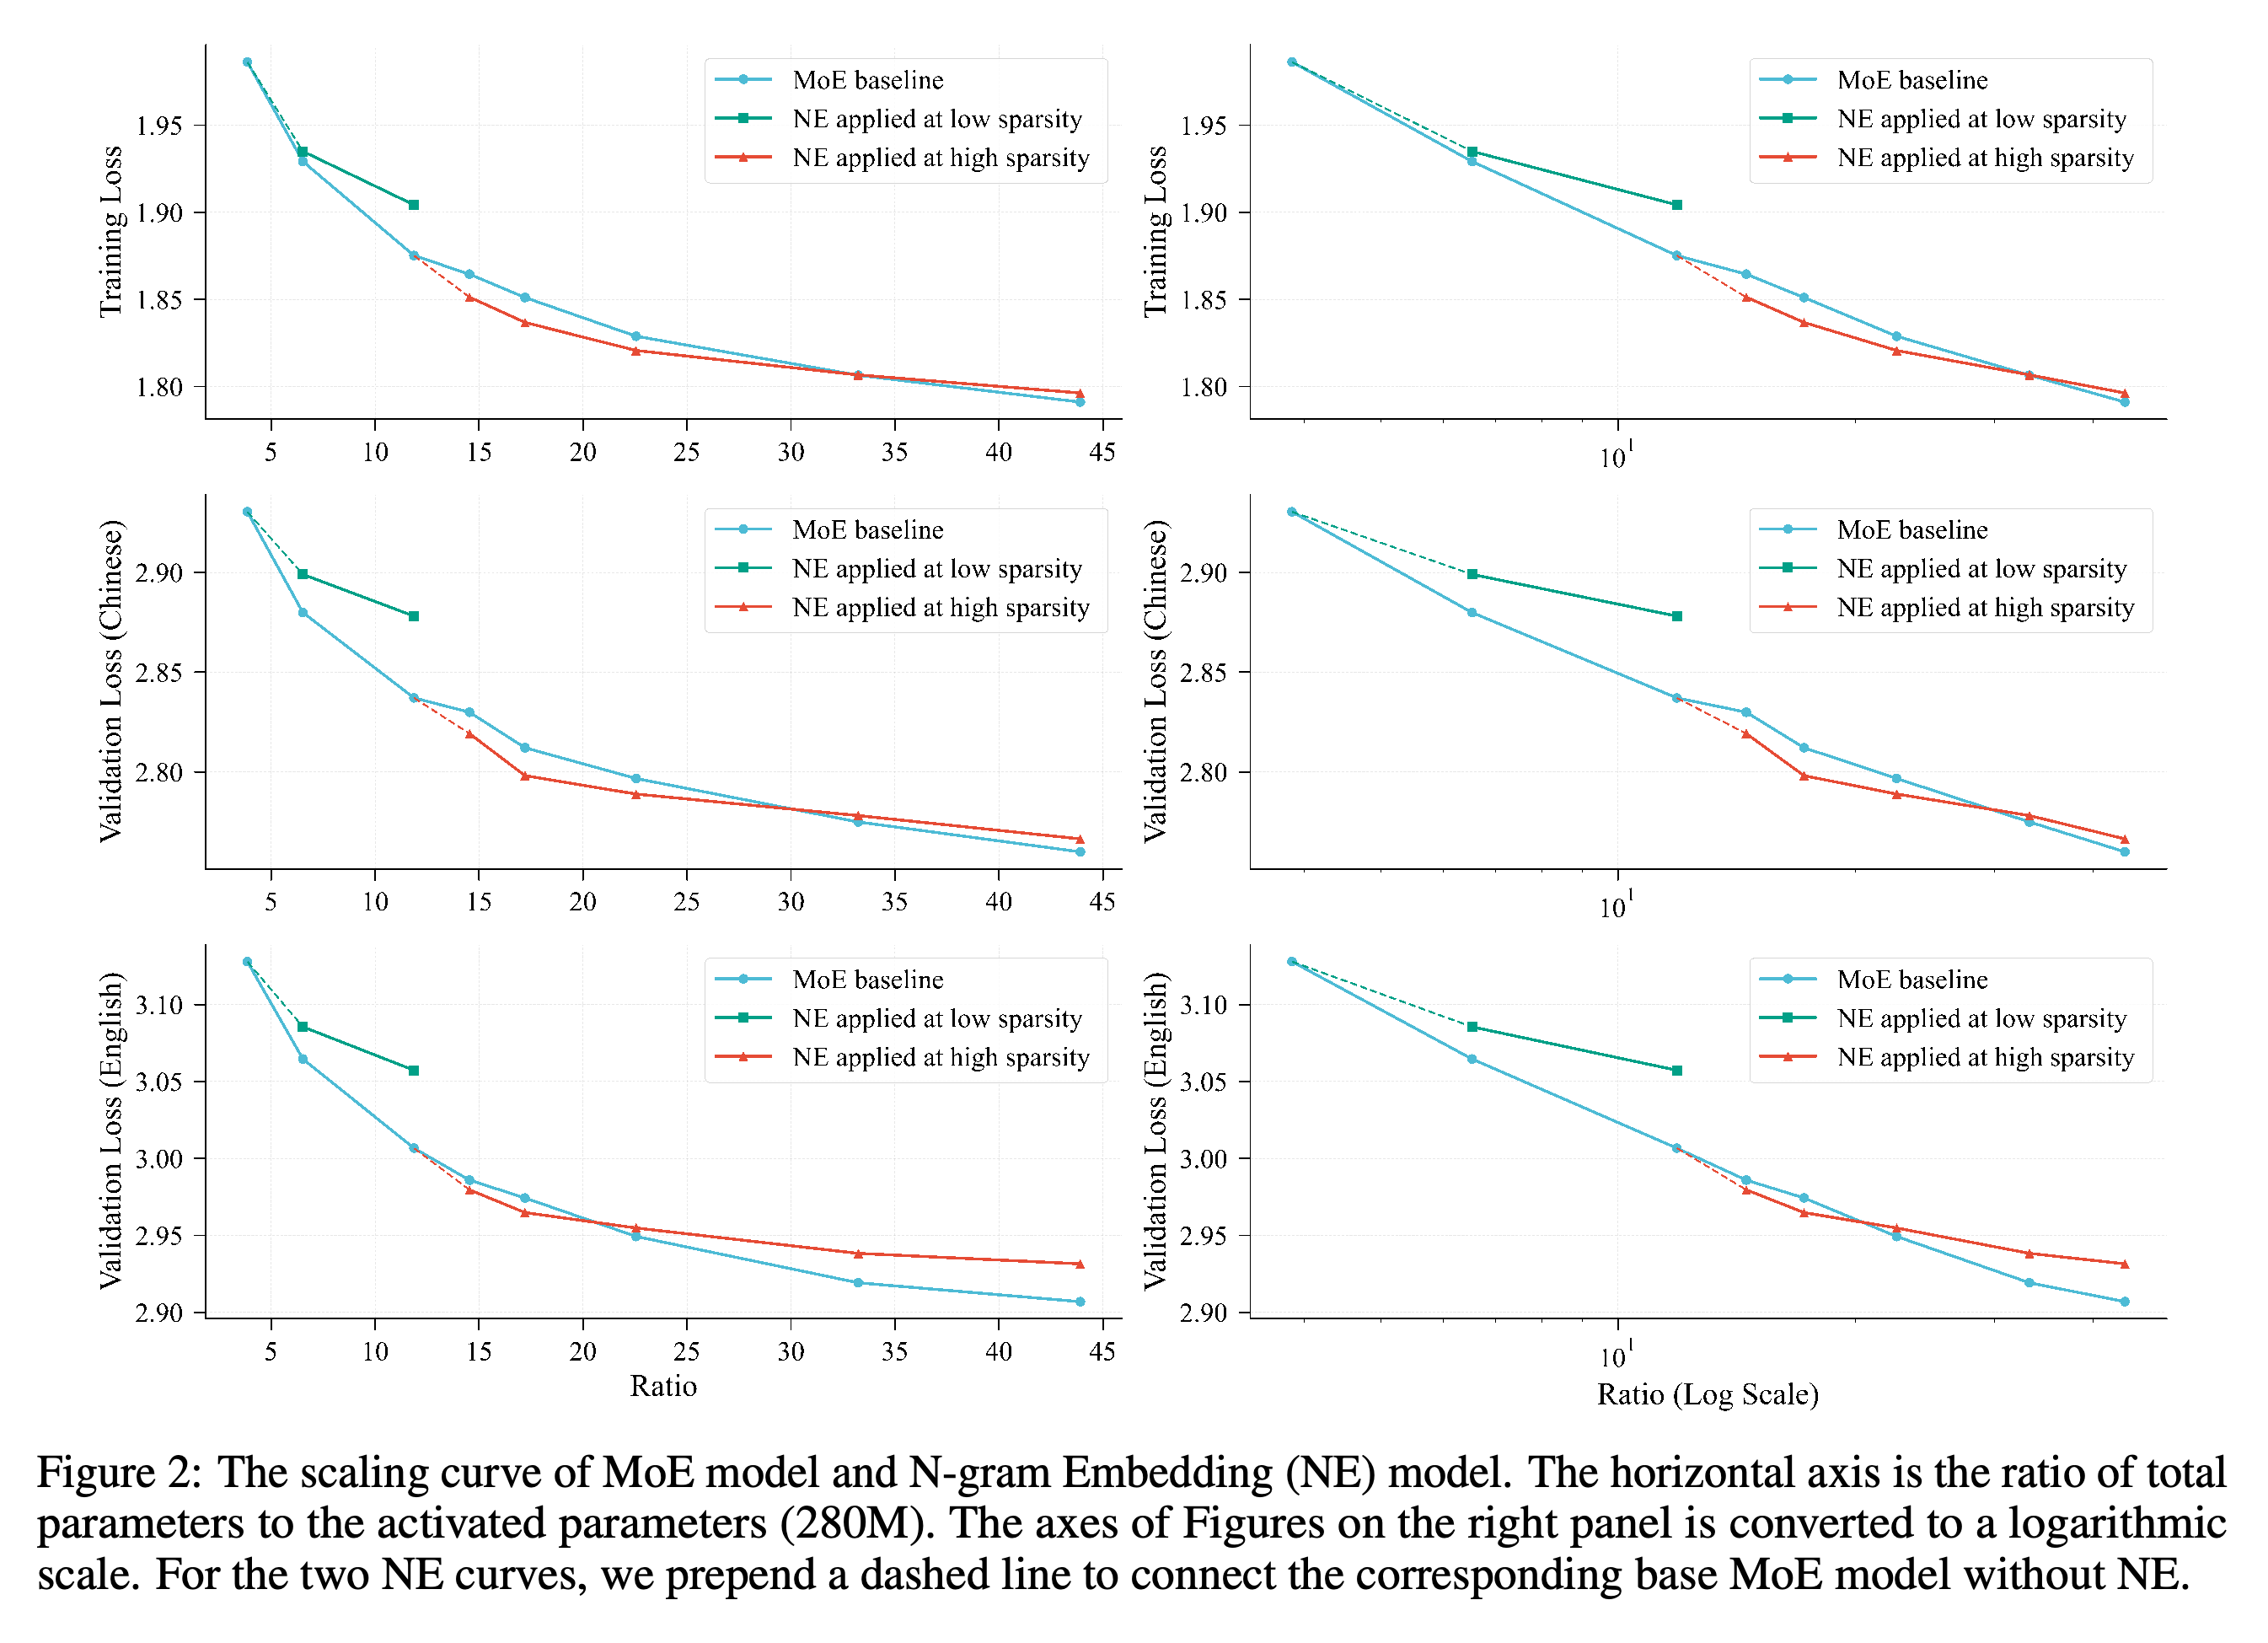
Figure 2 shows that adding embeddings to a low-sparsity base model is less effective than adding experts. When the base MoE already has a high total-to-activated parameter ratio, embedding expansion initially lowers loss more efficiently; the authors therefore recommend introducing it after expert counts pass their empirical “sweet spot.”
- The expert-only curves are approximately linear on the logarithmic ratio axis, indicating that equivalent loss reductions require progressively larger absolute parameter additions.
- “Timing” here means the architectural sparsity regime at which embedding capacity is introduced, not an intervention partway through training.
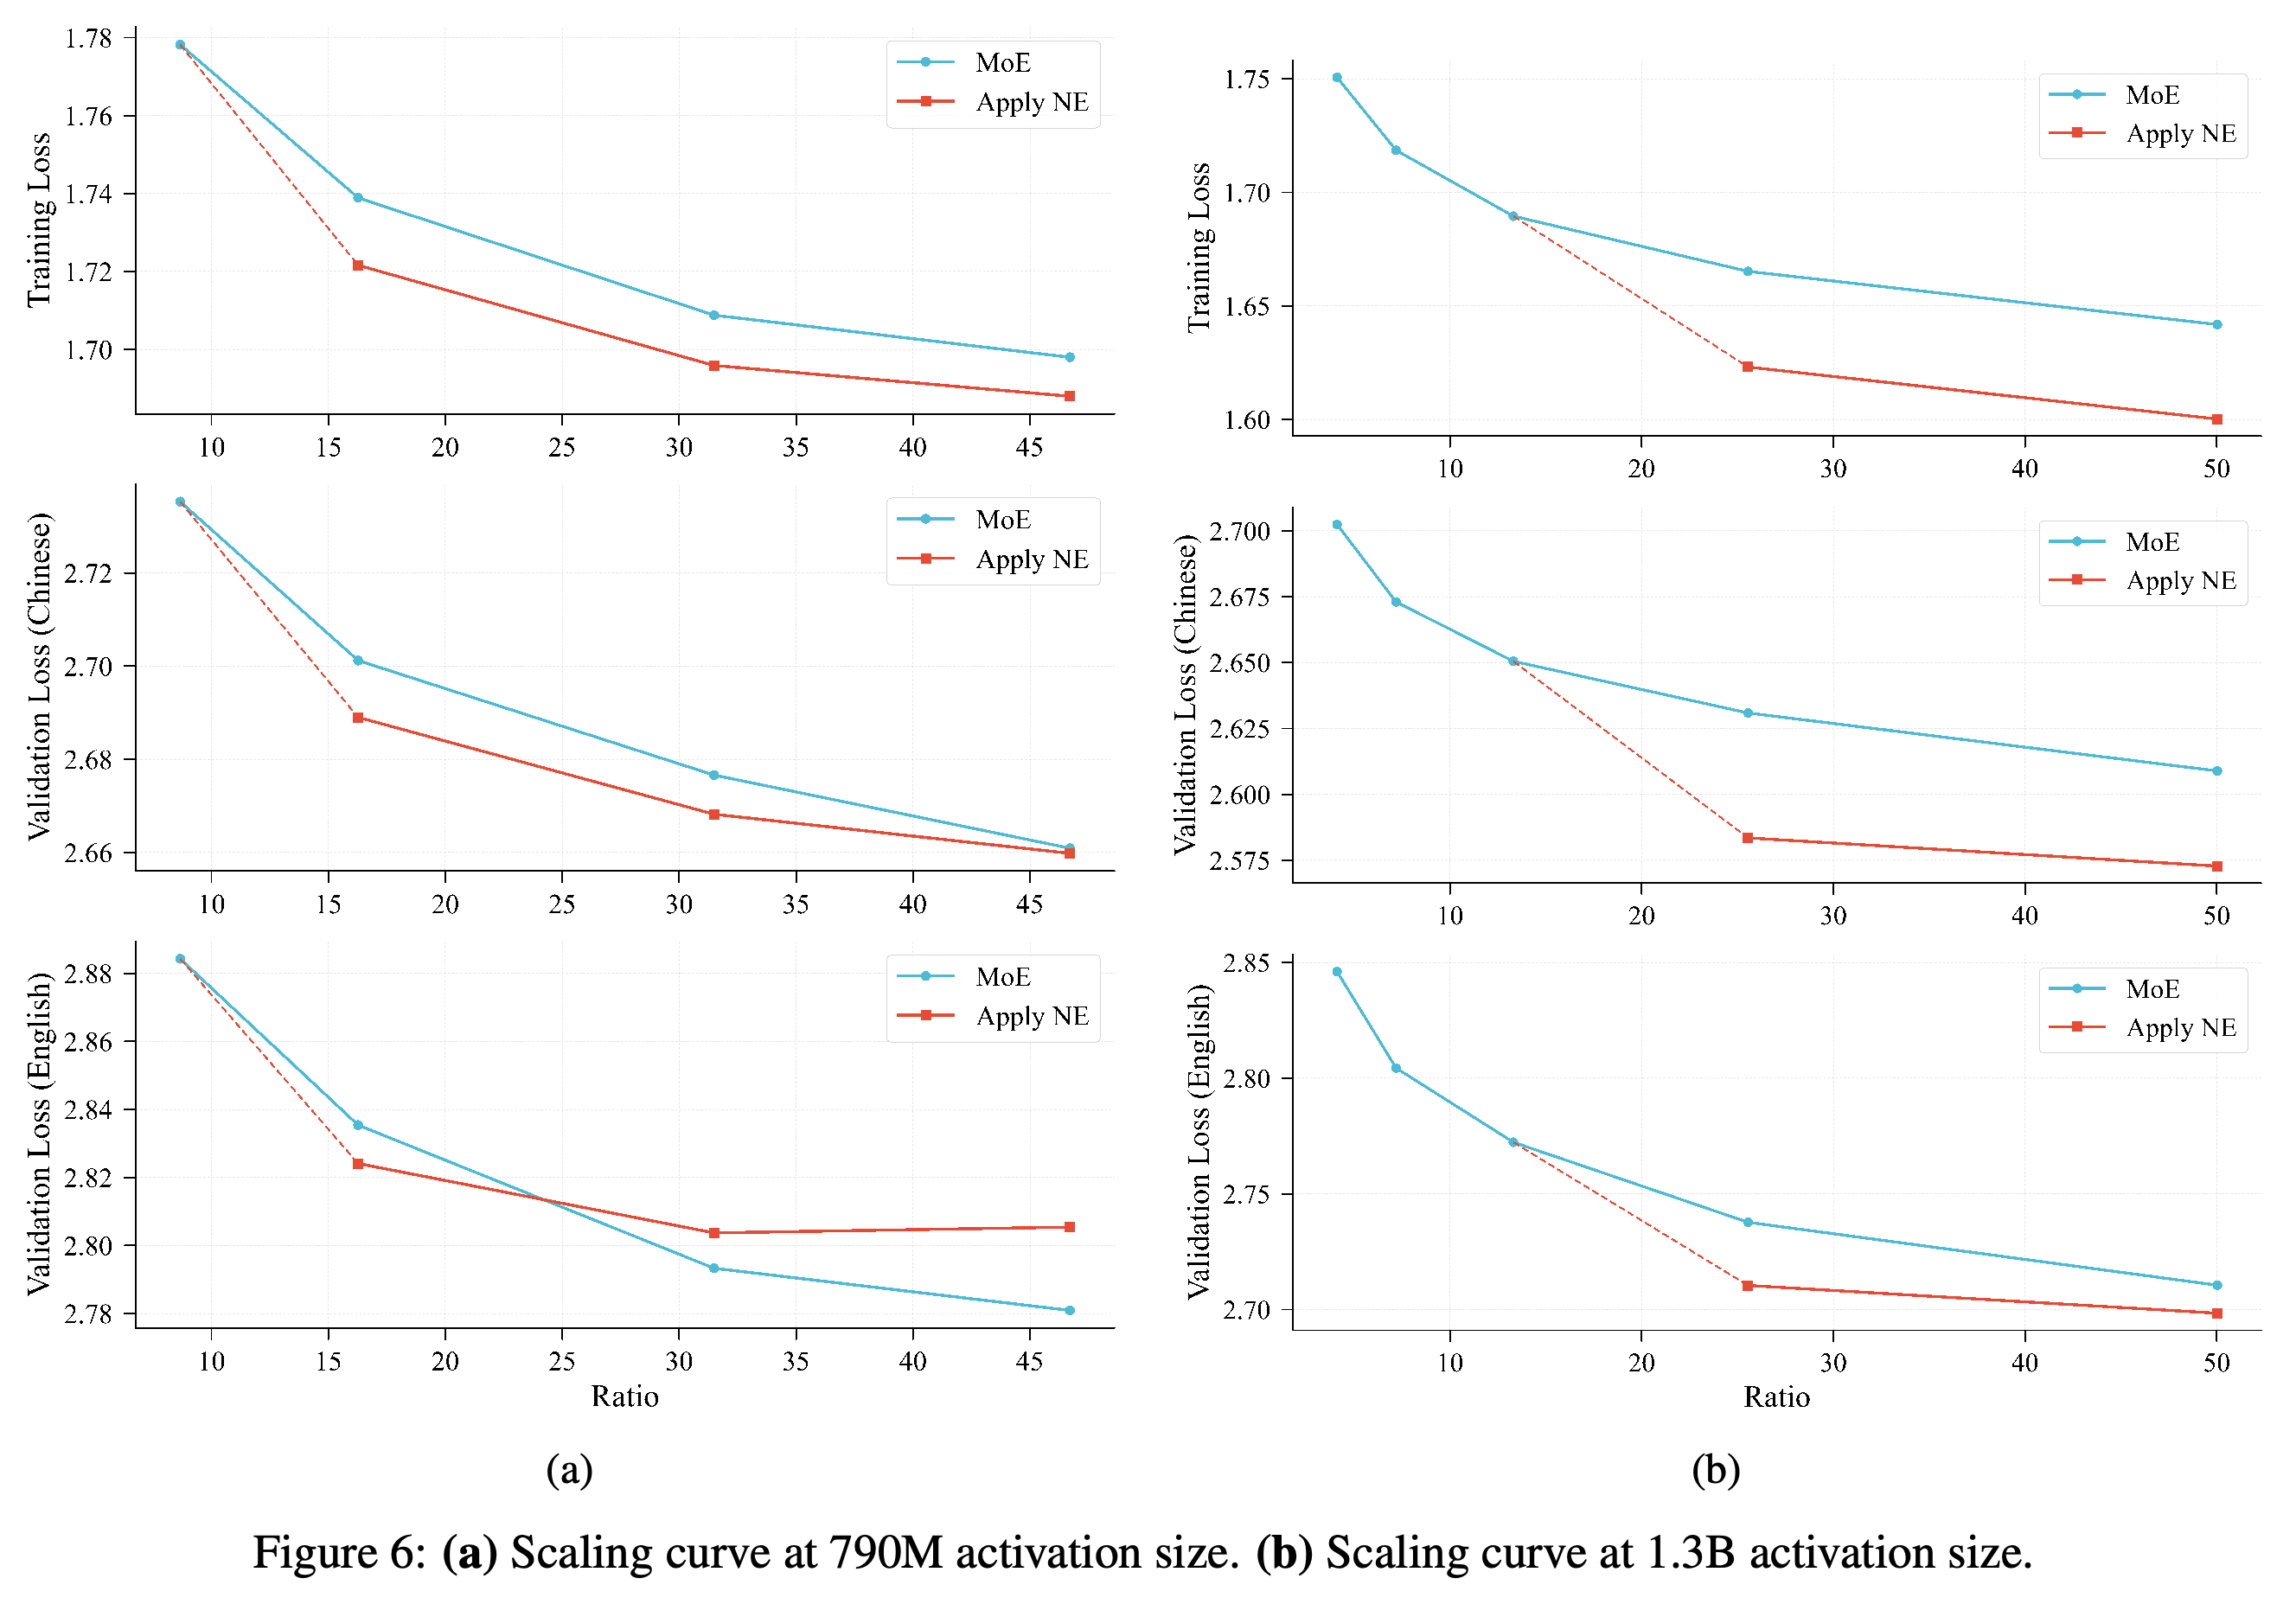
At 280M activated parameters, the low-sparsity embedding trajectory remains worse than expert expansion. Starting from a higher-sparsity base yields an initial loss advantage, but that advantage disappears at larger embedding allocations. The English validation crossing occurs earlier than the training and Chinese validation crossings, so the text's crossing near a ratio of 20 is not common to all three measures.
3.2 Integration Strategy
3.2.1 Parameter Budgeting for N-gram Embeddings: Increasing the embedding share eventually erodes its advantage over a parameter-equivalent MoE. The authors use Figure 2 to motivate allocating no more than 50% of total parameters to N-gram Embedding.
- The text associates the crossing with a ratio slightly above 20 and a base MoE ratio of 12, but Figure 2 shows different crossings for training, Chinese validation, and English validation loss; the stated ratio should not be read as a common measured threshold.
- The 50% limit is an empirical budgeting heuristic, not a universal optimum. Later width experiments show that the favorable regime depends on architecture and evaluation language.
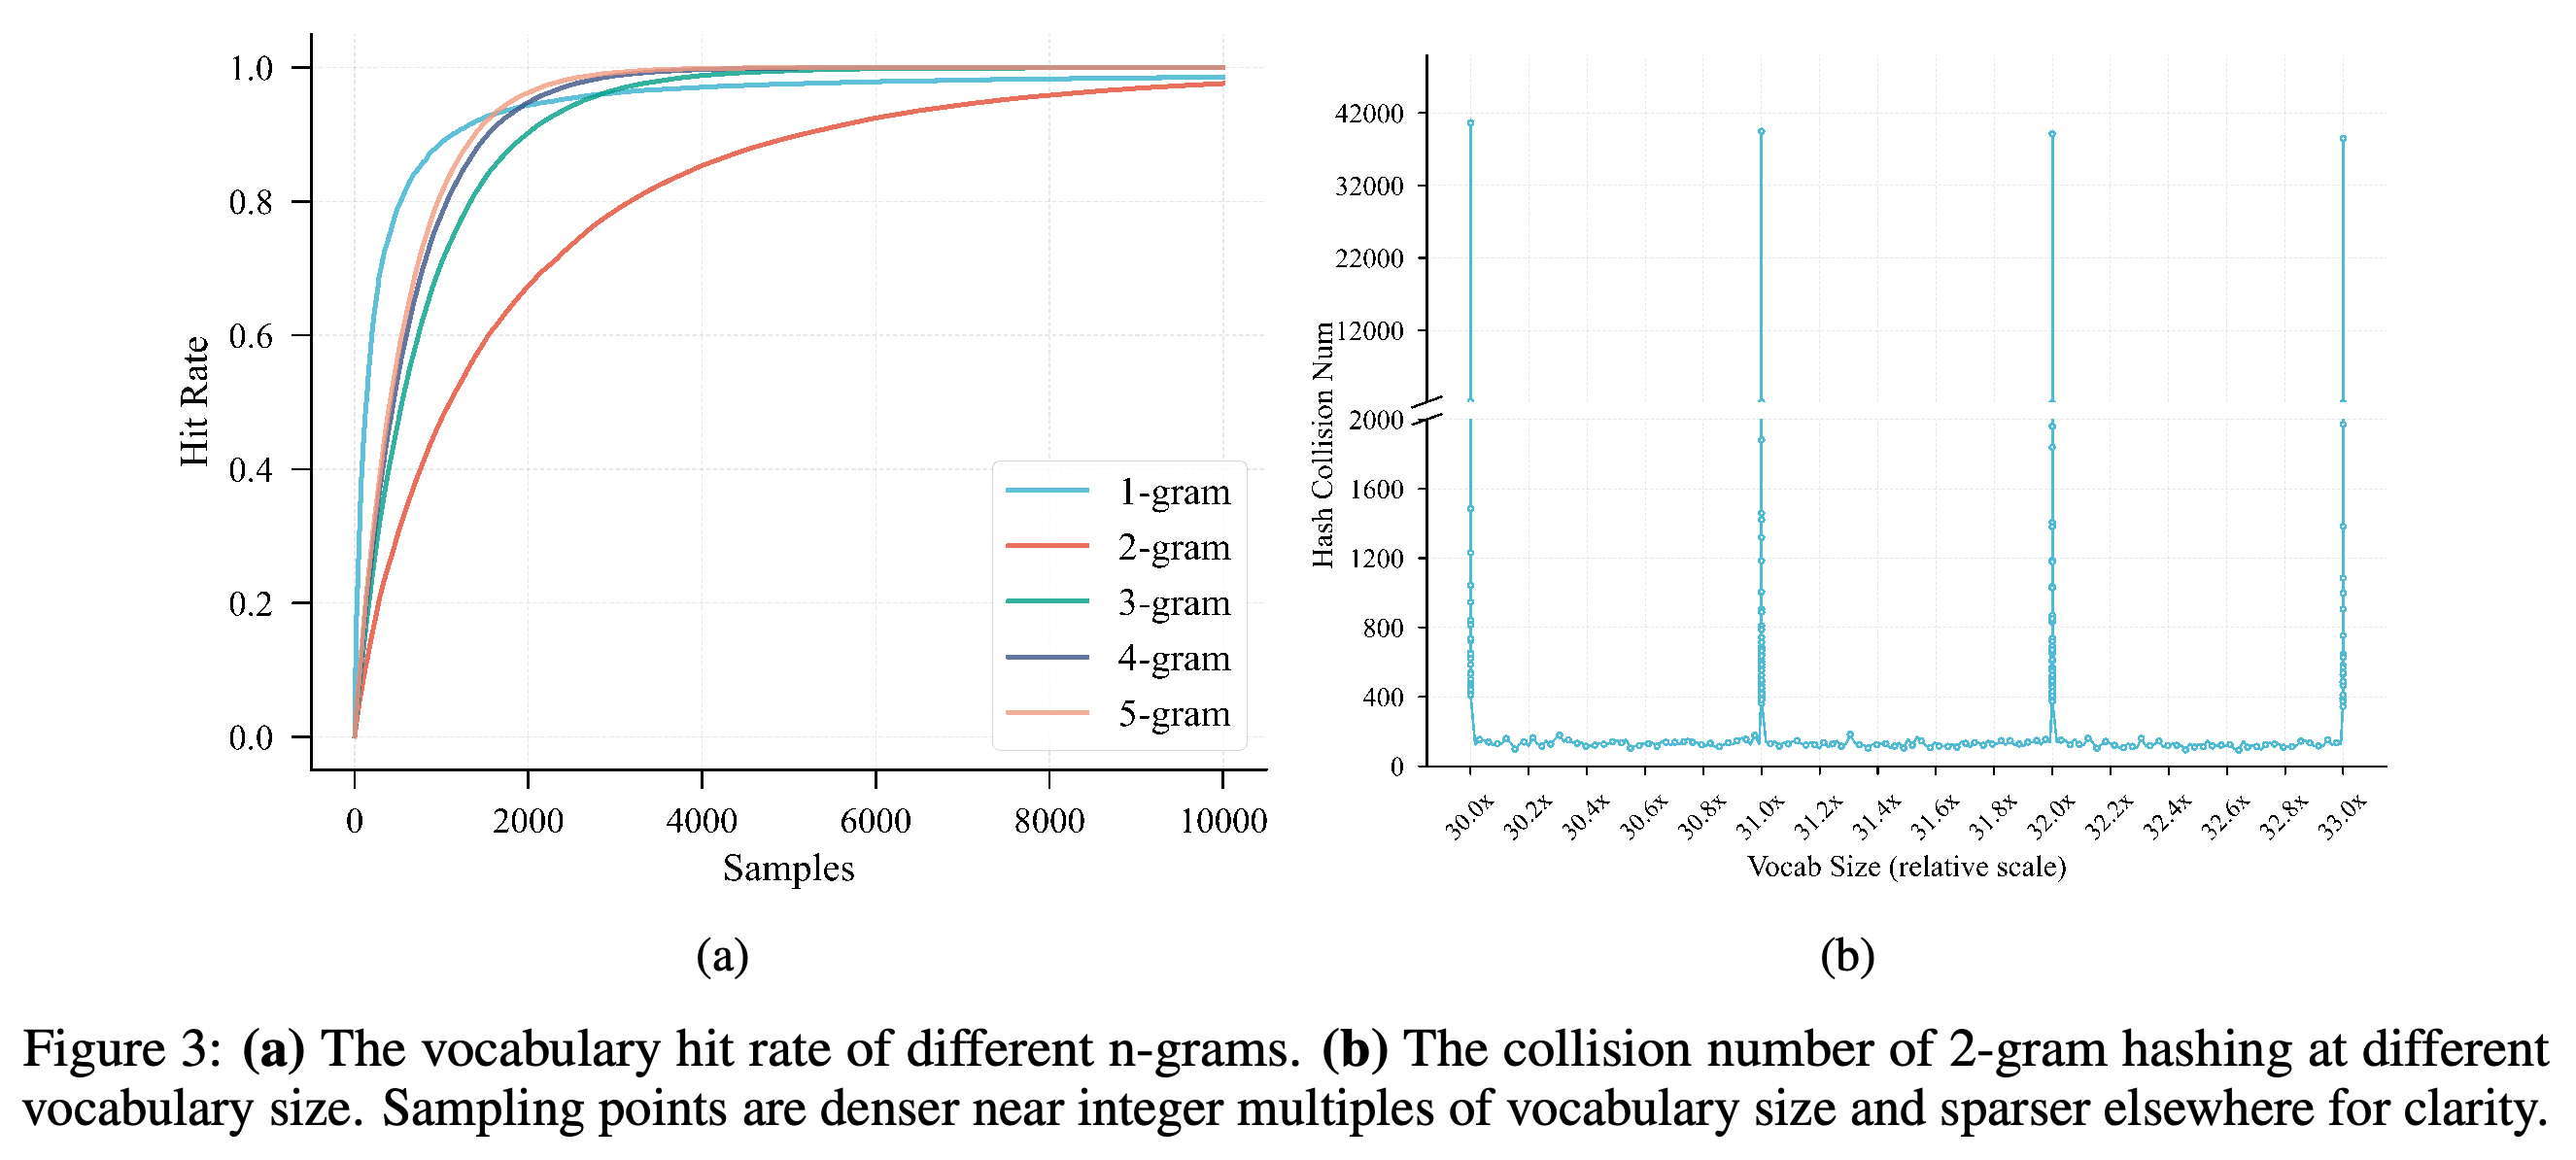
3.2.2 Mitigating Hash Collisions via Vocabulary Sizing: With a base vocabulary of 128k, the hit-rate analysis uses n-gram tables sized at 30× the base vocabulary. Collision counts are measured over 100 training sequences for table sizes between 30× and 33×; Figure 3 shows sharp 2-gram collision spikes near integer multiples of the base vocabulary.
- Higher-order tables approach complete entry coverage faster than the 2-gram table, but entry coverage does not establish collision-free representation of individual n-grams.
- The authors recommend table sizes that substantially deviate from integer multiples of the base vocabulary, noting that choosing a prime table size alone does not eliminate the observed spikes.
The hit-rate panel shows slower entry coverage for 2-grams than for higher-order hashes. The collision panel has narrow spikes near integer multiples of the 128k base vocabulary, supporting careful table-size selection rather than relying only on a large or prime vocabulary.
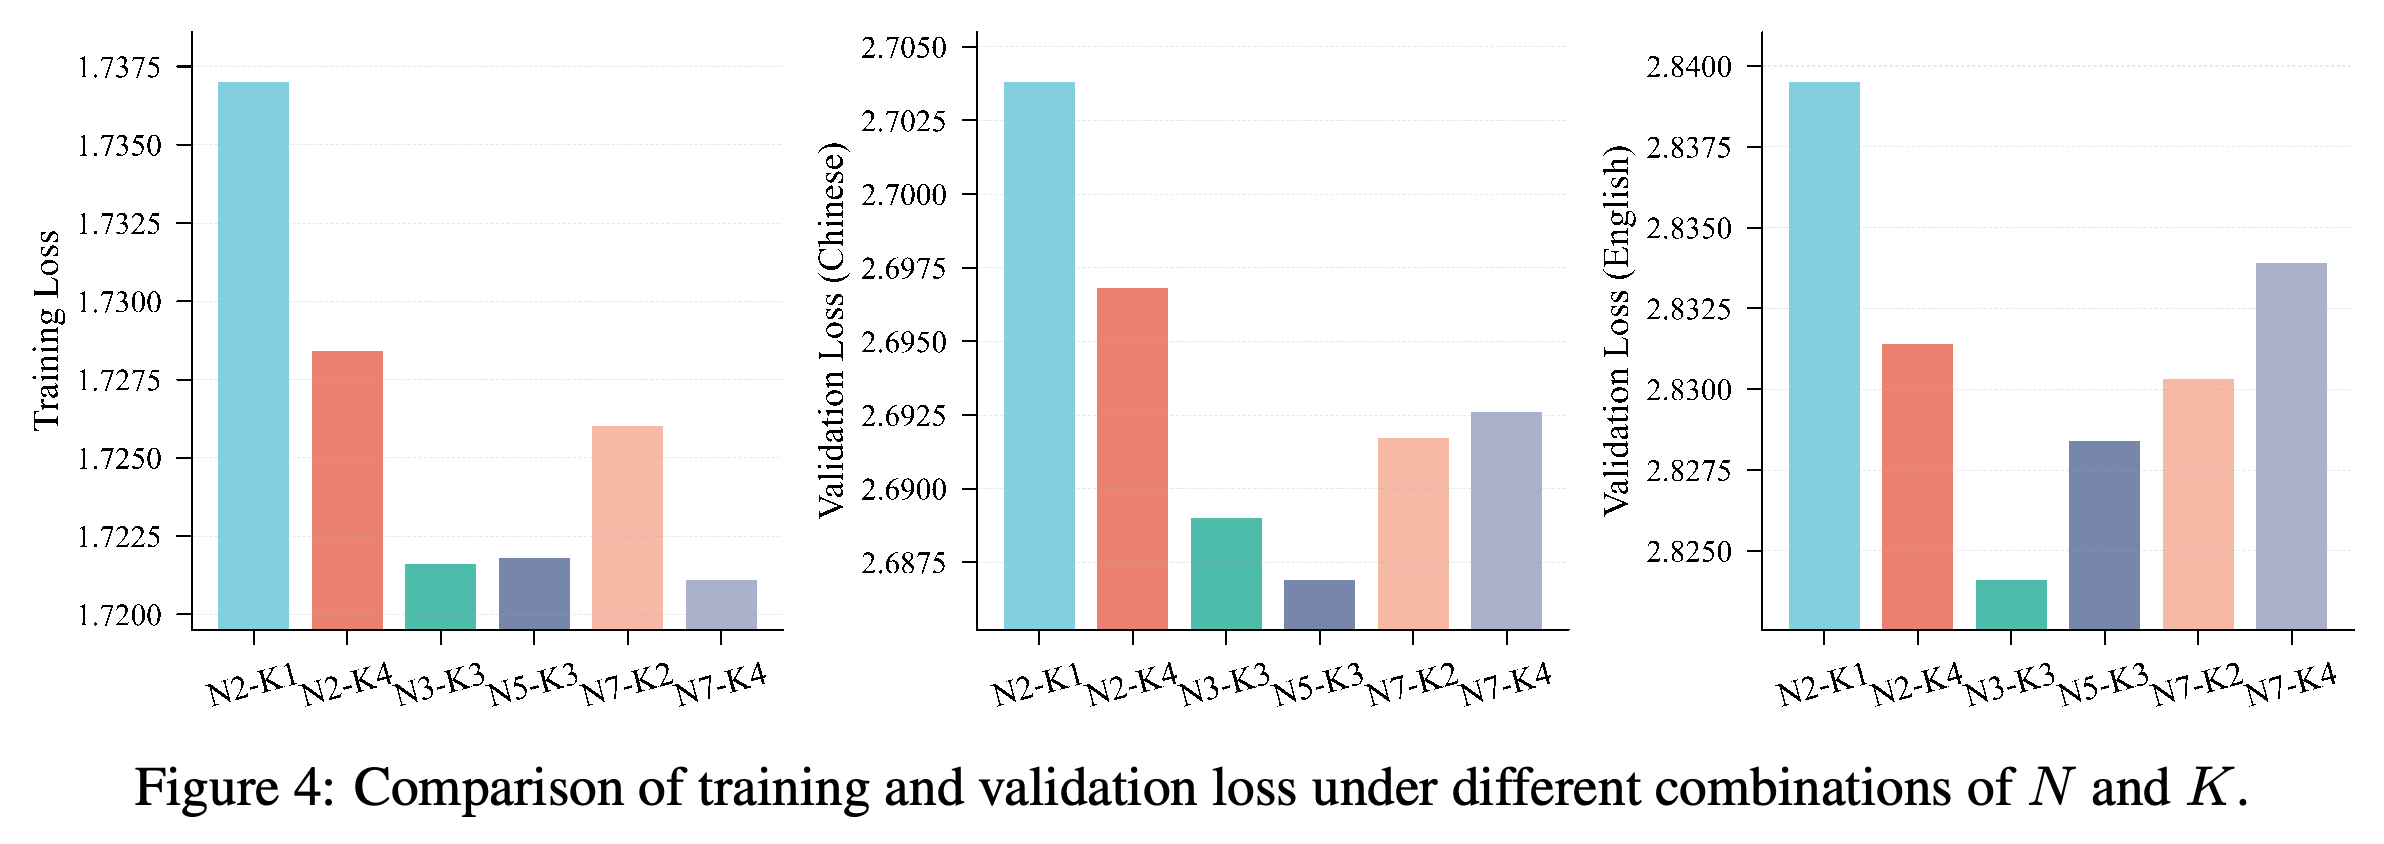
3.2.3 Sensitivity Analysis of Hyperparameters: The 790M activated-parameter ablation in Figure 4 varies maximum n-gram order N and sub-table count K. N = 2 and K = 1 performs worst; tested configurations with N ≥ 3 and K ≥ 2 vary relatively little, with N from 3 to 5 generally near-optimal.
- Higher orders provide more local context but make individual n-grams less frequent, while additional hash sub-tables reduce collision ambiguity with diminishing returns.
- For large N, the report recommends modular computation before exponentiation to avoid numerical overflow in hashing.
N2-K1 is the weakest tested configuration on all three losses. More expressive configurations largely cluster together, and the best configuration differs by metric, giving little support for simply maximizing n-gram order or sub-table count.
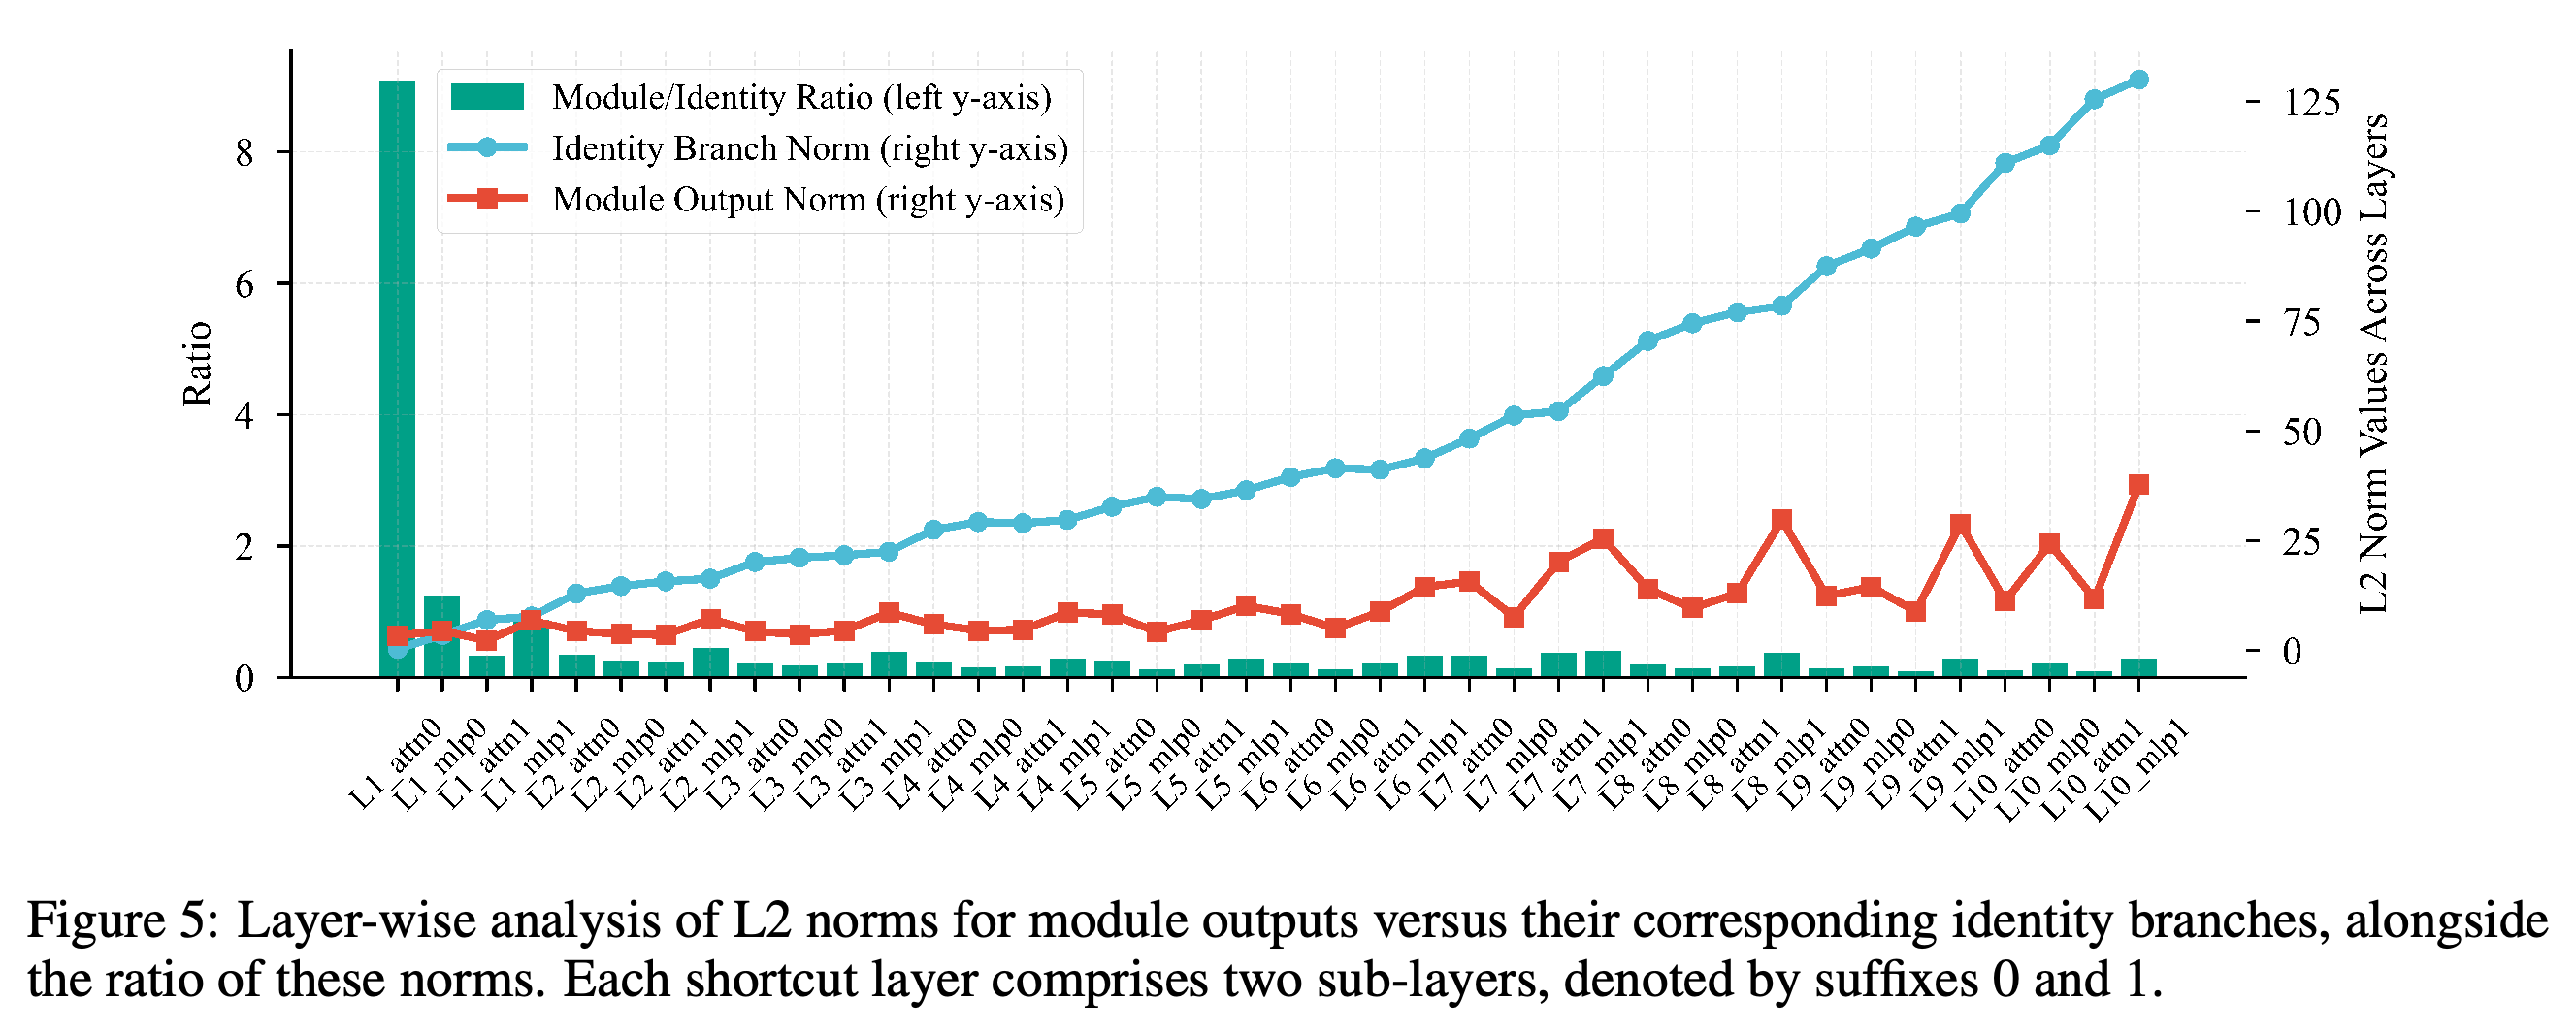
3.2.4 Embedding Amplification for Effective Training: After 300B tokens in an unadjusted configuration, Figure 5 shows the first attention output norm at approximately 10× its identity-branch norm, suggesting that attention overwhelms the embedding signal. Scaling embedding outputs, typically by (\sqrt{D}), or applying LayerNorm reduces training loss and both validation losses by a reported 0.02 relative to the unadjusted setup.
- The authors call these methods Embedding Amplification and interpret their benefit as preserving the embedding contribution to the residual stream.
- They report no significant effect on training stability in these experiments; the measured benefit is lower model loss.
The first attention module has a much larger output norm than its incoming identity branch, while identity-branch norms grow through later layers. This diagnostic motivates amplifying the input embedding signal, although norm imbalance alone does not prove the proposed mechanism.
3.3 Scaling Properties across Model Width and Depth
3.3.1 Enhanced Advantage in Wider Models: Holding depth fixed at 10 shortcut layers, the study increases hidden size and module dimensions to reach 790M and 1.3B activated parameters. Figure 6 shows that wider models retain an embedding advantage over a larger range of total-to-activated parameter ratios; no crossing is observed for the 1.3B configuration within the tested range.
- At 280M activated parameters, embeddings underperform beyond a ratio of 30; at 790M, the disadvantage at that ratio appears only on English validation.
- At 1.3B activated parameters, N-gram Embedding remains better on all three loss measures even at a total-to-activated parameter ratio of 50.
At 790M activated parameters, the English validation advantage reverses at larger ratios even when training loss remains lower. At 1.3B, the embedding configuration stays below the expert baseline on every plotted measure through a ratio of 50, showing a wider favorable regime without an observed crossing.
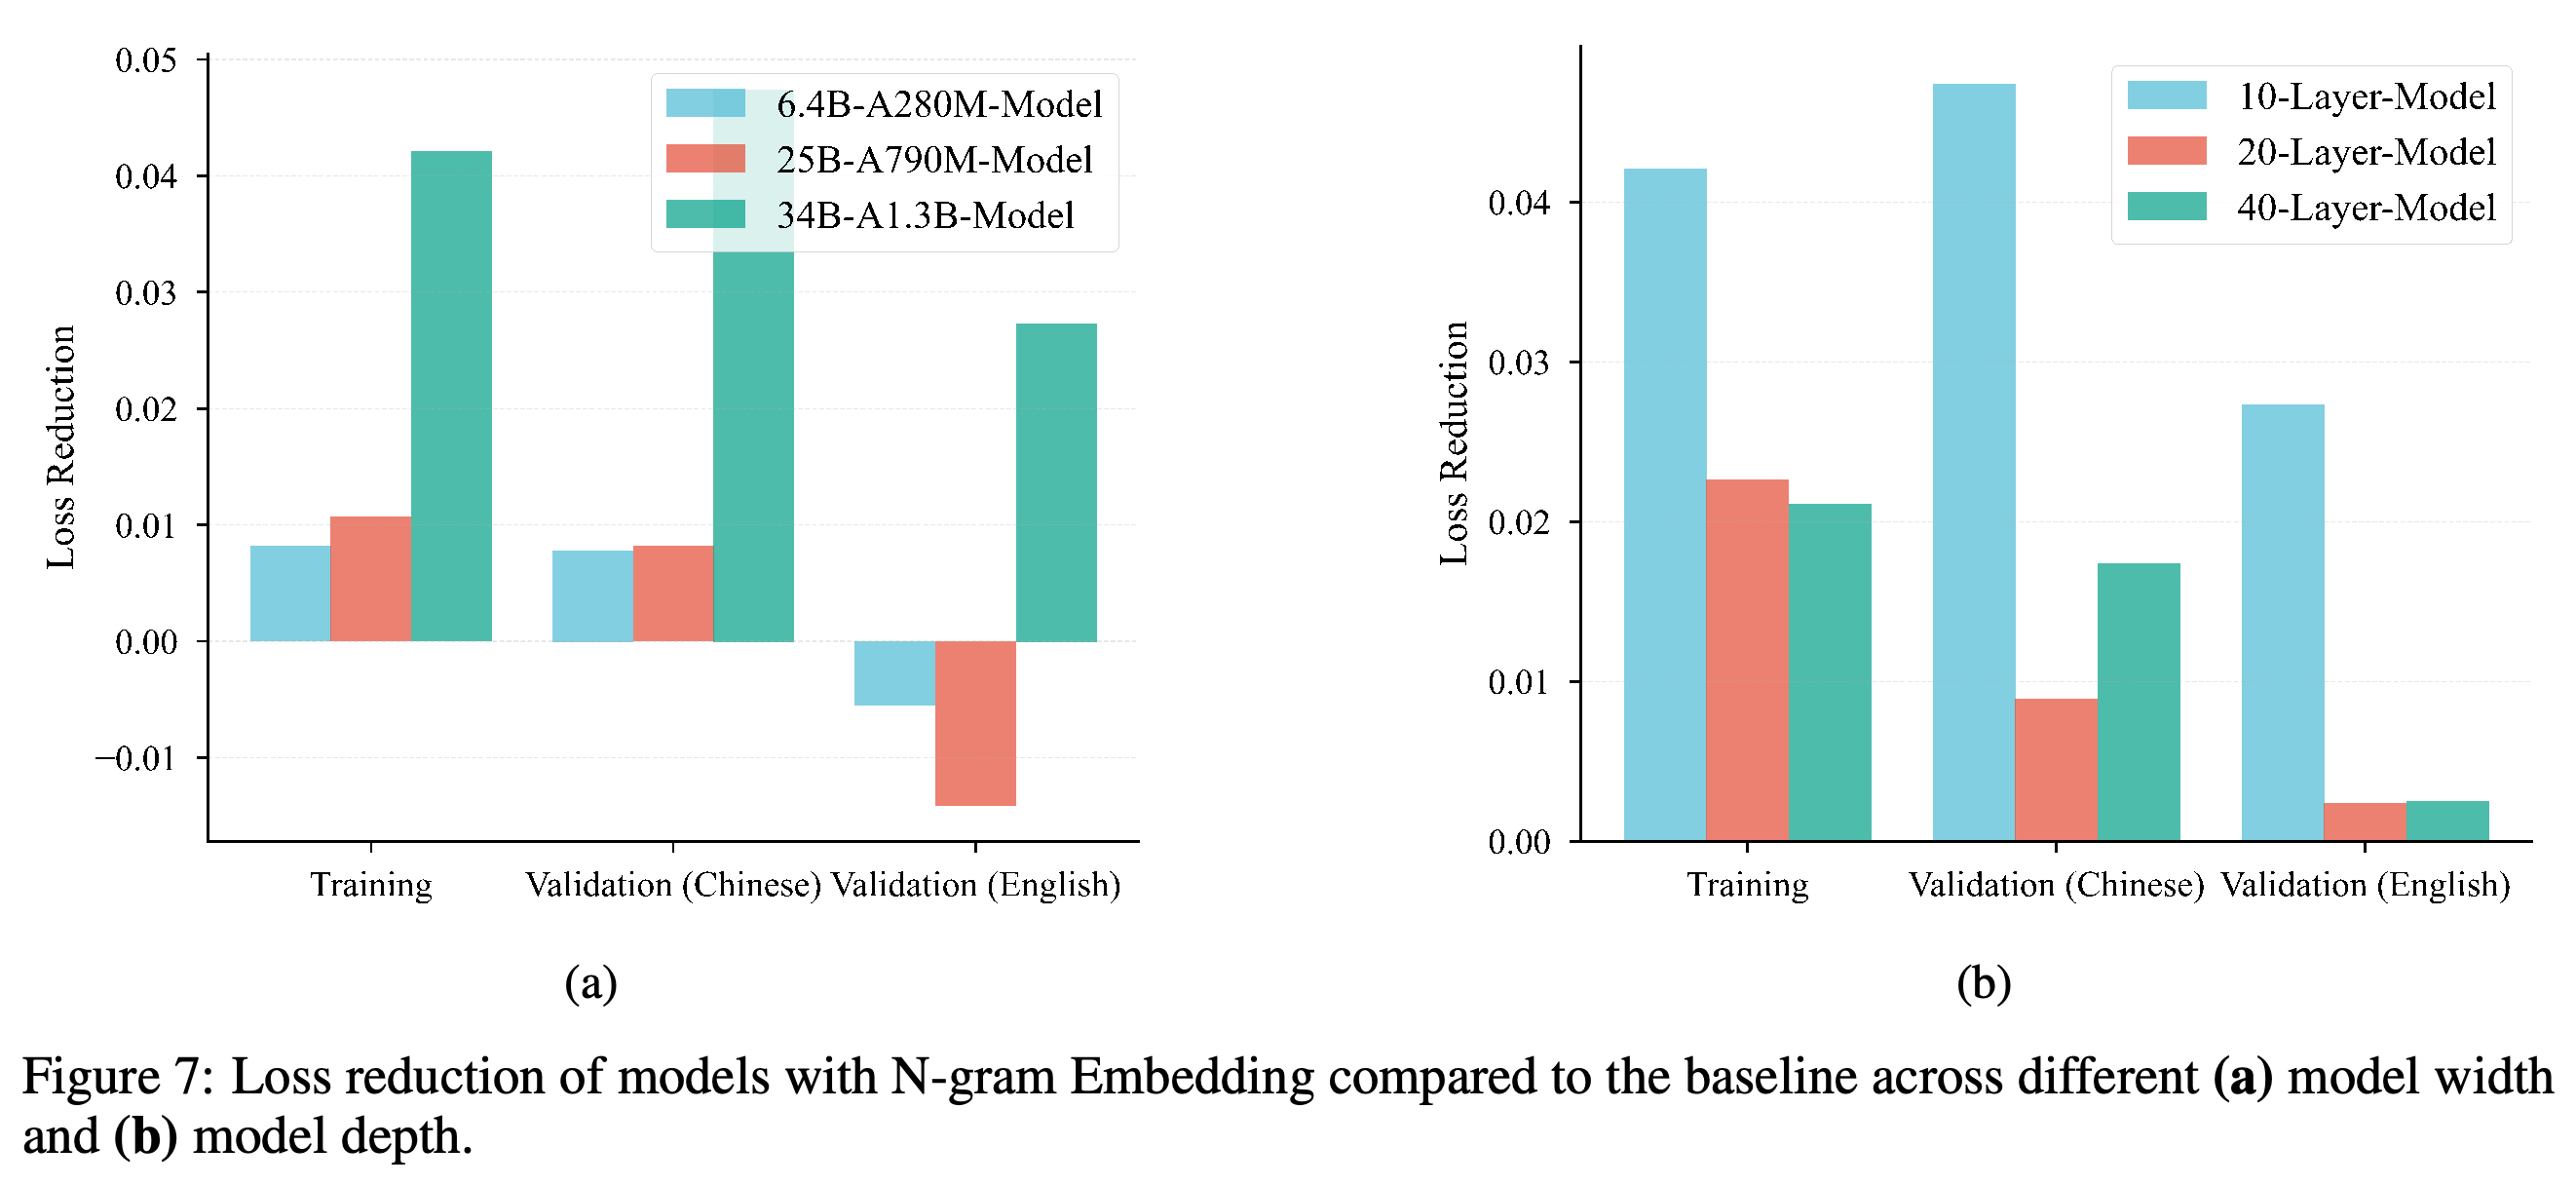
3.3.2 Diminishing Returns in Deeper Models: Experiments extend the architecture built on the 1.3B activated-parameter configuration to 20 and 40 layers while keeping N-gram Embedding near 50% of total parameters. Figure 7 shows substantially smaller loss improvements than in the 10-layer model, especially on English validation.
- The authors attribute this contraction to dilution of the input embedding signal through deeper pre-normalized residual networks. The norm analysis is consistent with this interpretation but does not independently establish causality.
- The advantage does not decline monotonically on every validation measure from 20 to 40 layers, although both deeper configurations have much smaller gains than the 10-layer configuration.
The width comparison shows stronger gains for the widest configuration, including positive English validation improvement where the smaller selected configurations regress. The depth comparison shows much smaller improvements at 20 and 40 layers than at 10, particularly on English validation; validation gains are not uniformly monotonic between 20 and 40 layers.
4 Efficient Inference
The inference analysis distinguishes architectural sparsity from realized serving efficiency. Moving capacity from experts to embeddings reduces expert-weight traffic, but realizing the benefit requires sufficient effective batch size and control of the additional embedding lookup overhead.
4.1 Reduction of MoE Activation Parameters
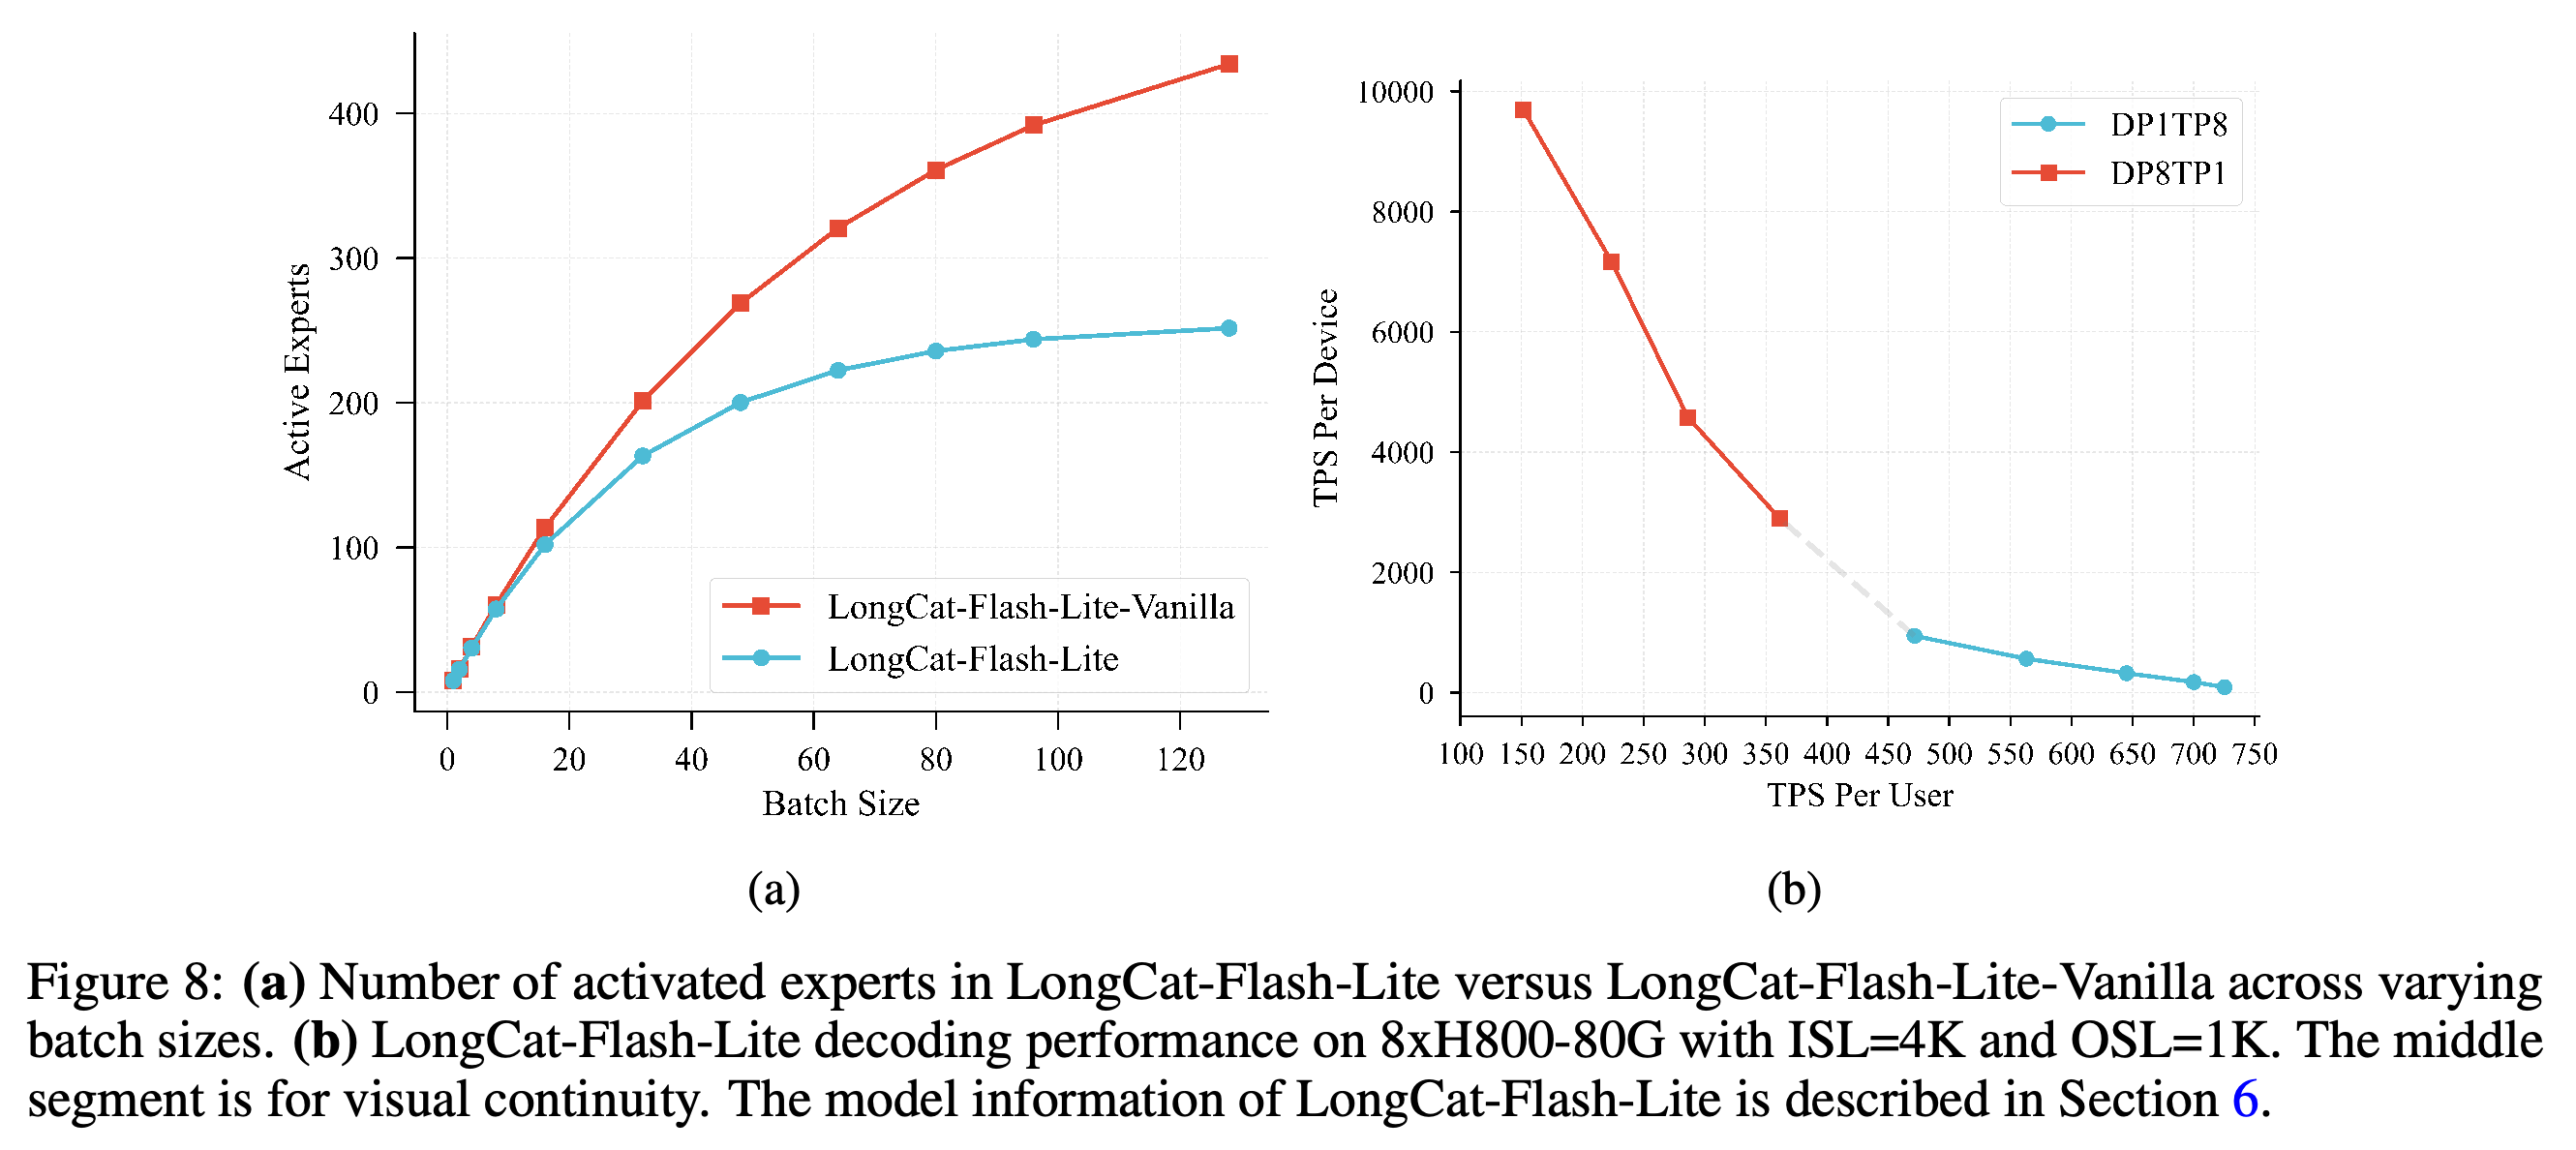
Figure 8a shows that LongCat-Flash-Lite activates fewer distinct experts than LongCat-Flash-Lite-Vanilla as batch size grows, reducing the expert parameters accessed across a decoding batch. Multi-step speculative decoding increases the effective batch size and is used to improve hardware utilization.
- The separation is small at low batch sizes and grows at larger batch sizes, so the serving benefit is workload-dependent.
- Embedding lookup work depends on tokens and selected entries rather than a scan of the full embedding table, but the branch still introduces overhead addressed in the next section.
4.2 Optimized Embedding Lookup
The N-gram Cache manages n-gram IDs on-device through custom CUDA kernels, synchronizing them with dynamic inference scheduling in a manner inspired by the KV cache. The report also proposes conventional embeddings for the draft model and caching n-gram embeddings during drafting to avoid redundant work during verification.
- These measures address the extra I/O, projections, communication, and scheduling complexity relative to a standard embedding layer.
- Figure 8b reports the combined system’s decoding trade-off on 8xH800-80G with ISL=4K and OSL=1K for DP1TP8 and DP8TP1. It provides neither an expert-only serving baseline nor separate gains for each optimization.
Distinct expert activation separates increasingly with batch size, indicating lower expert-weight traffic for the embedding-based model at larger batches. The serving panel displays the trade-off between per-user speed and per-device throughput for two parallelism layouts; its middle connecting segment is only for visual continuity, and no Vanilla serving curve is shown.
4.3 Rethinking N-gram Embedding Optimization: The Role of Speculative Decoding
The authors identify two exploratory uses of local n-gram information for speculative decoding: an inexpensive draft predictor built from embedding outputs, and early rejection of unlikely draft tokens before full target-model verification. Neither direction is accompanied by an implemented-system evaluation or measured acceleration in this report.
- N-gram Embedding based drafting considers a lightweight linear projection over embeddings that encode short-range context from the preceding N−1 tokens.
- Early rejection is proposed as a semantic consistency or confidence check; its acceptance behavior and effect on decoding correctness are not evaluated.
5 Integration with Per-Layer Embedding
The report compares input-level N-gram Embedding with Per-Layer Embedding (PLE), which places embedding capacity inside network layers. It also introduces Per-Layer N-gram Embedding (PLNE) to test whether distributing contextual lookup capacity across layers improves scaling.
5.1 Per-Layer Embedding
PLE replaces the SwiGLU up-projection output with a layer-specific token embedding. Equation (4) is FFN^(l)(x_i) = W_d^(l)(SiLU(W_g^(l)x_i^(l)) ⊙ E_0^(l)(t_i)), where the down-projection and gate-projection remain learned transformations.
- The authors describe this substitution as the most efficient embedding-injection method among those they tested.
- The layer-specific embedding table has the same shape as the base table defined in Equation (1).
5.2 Per-Layer N-gram Embedding
PLNE replaces PLE’s token embedding with a layer-specific N-gram Embedding output computed using Equation (3). Equation (5) is FFN^(l)(x_i) = W_d^(l)(SiLU(W_g^(l)x_i^(l)) ⊙ e_i^(l)), with independent embedding tables and projection matrices for each injected layer.
5.3 Empirical Comparison
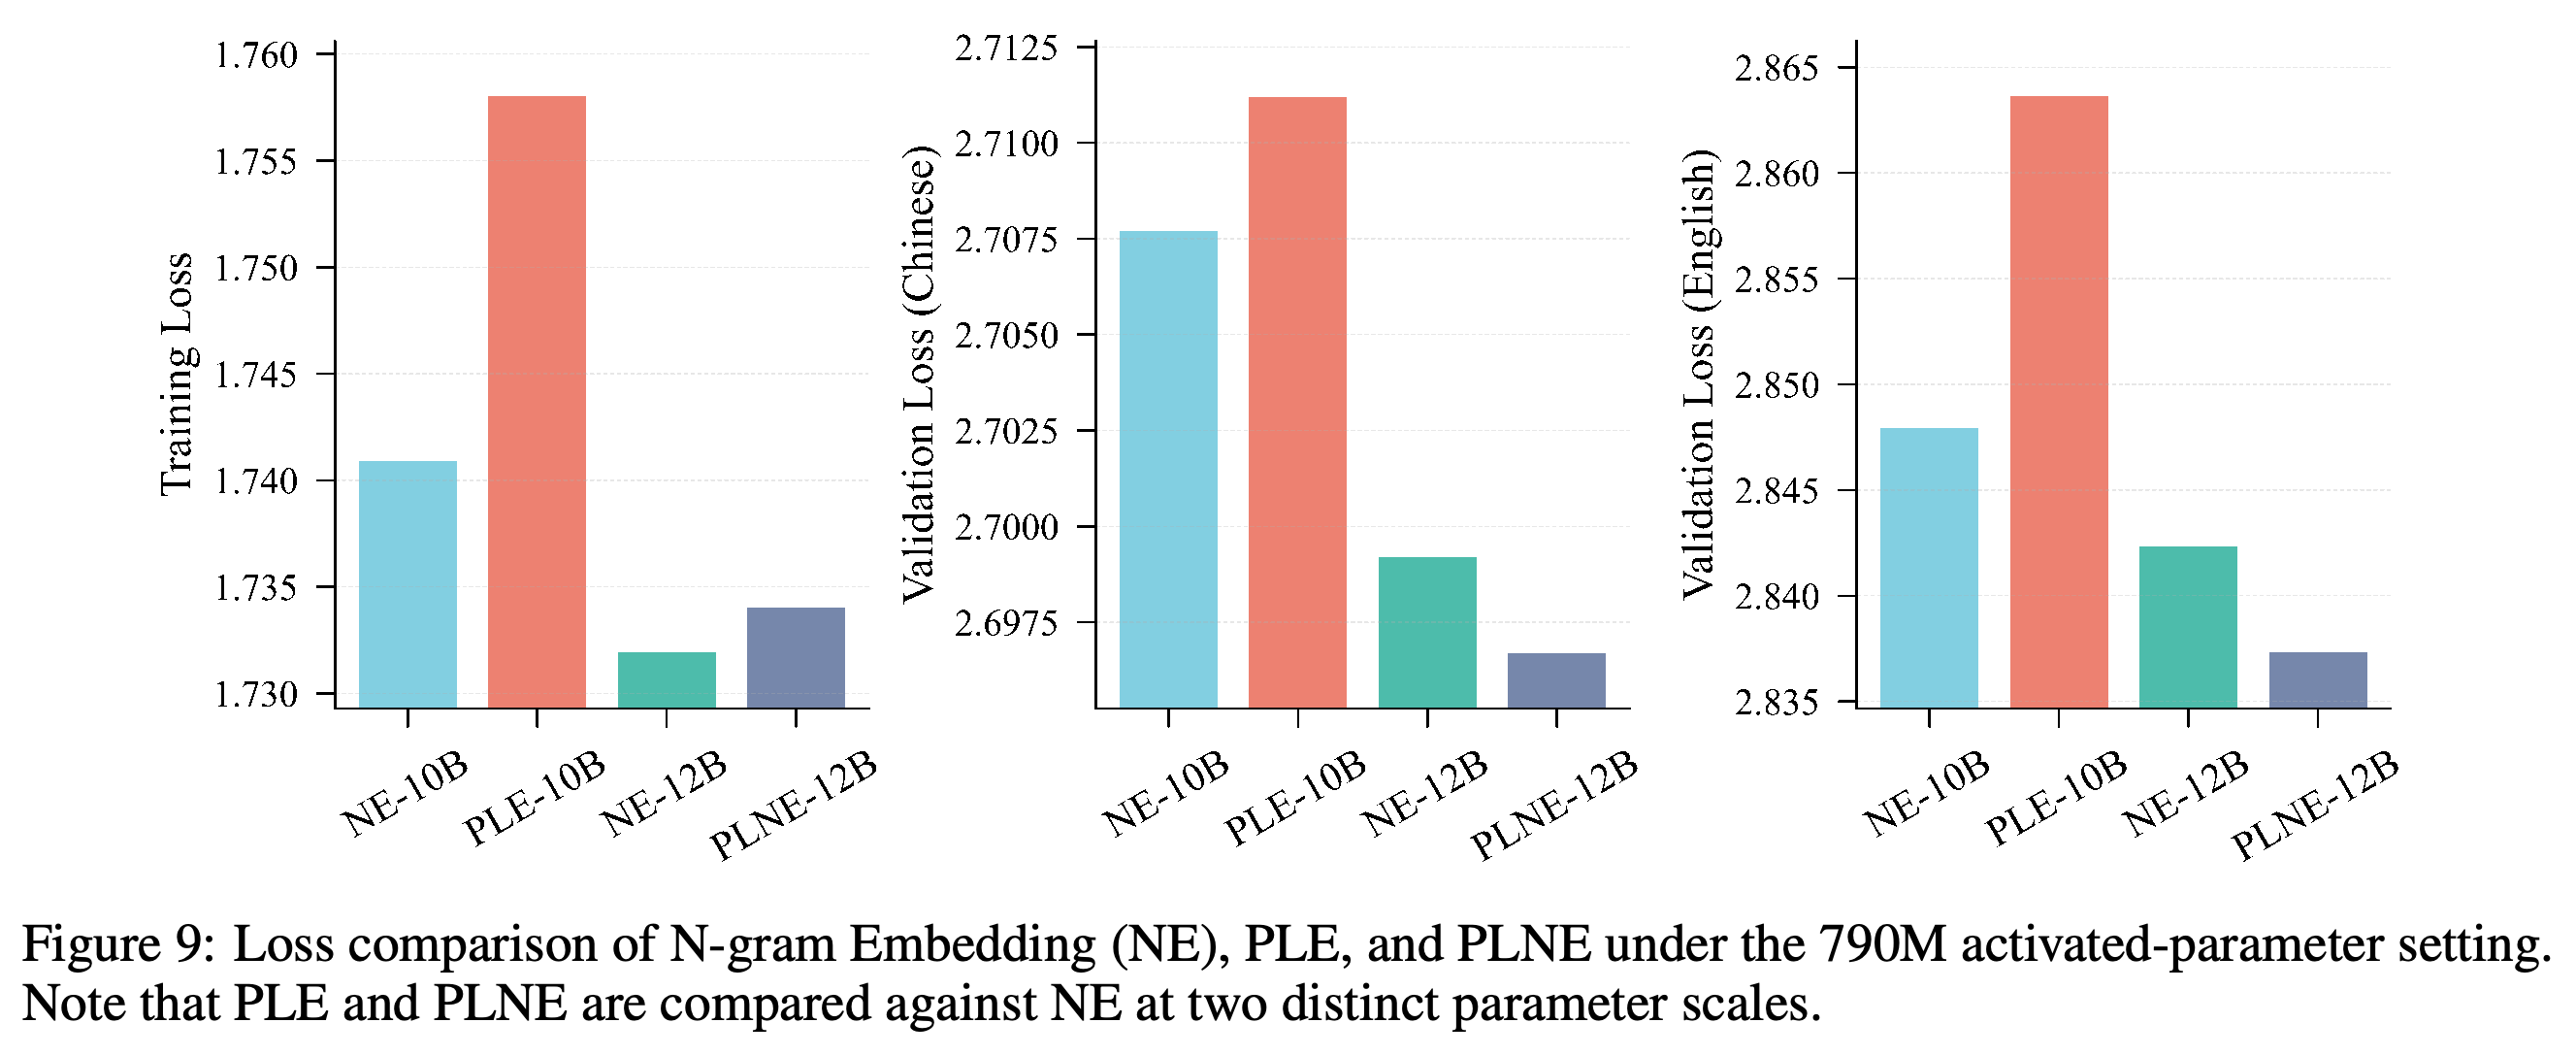
Figure 9 compares PLE with NE at 10B total parameters and PLNE with NE at 12B, all in the 790M activated-parameter setting. PLE is worse on all three loss measures; PLNE improves validation losses slightly but has slightly higher training loss than its NE counterpart.
- Both per-layer methods inject embeddings only into the dense-sub-layer MLP of each shortcut layer. PLE and PLNE are not directly parameter-matched to one another because the authors seek to avoid confounding layer placement.
- Larger-width and larger-depth follow-up experiments show no consistent PLNE advantage. Its additional per-layer projection matrices increase activated parameters, so the authors do not use it for LongCat-Flash-Lite.
- The optimal distribution of embedding parameters across layers remains unresolved.
PLE-10B has higher loss than NE-10B on all three measures. PLNE-12B slightly improves both validation losses relative to NE-12B but slightly worsens training loss, making its advantage narrower than an across-the-board improvement.
6 LongCat-Flash-Lite
LongCat-Flash-Lite is the large-scale application of the study’s architectural recommendations. It is trained from scratch through pre-training, mid-training, and supervised finetuning, and is released at https://huggingface.co/meituan-longcat/LongCat-Flash-Lite.
6.1 Model Information
Architecture: LongCat-Flash-Lite has 14 shortcut layers, 68.5B total parameters, and 31.4B N-gram Embedding parameters, corresponding to 46% of the total. Each shortcut-layer MoE contains 256 FFN experts and 128 zero-experts; each token selects 12 experts, yielding context-dependent activation of 2.9B–4.5B parameters.
Training Data: The model receives 11T pre-training tokens at sequence length 8k, followed by 1.5T mid-training tokens with sequence length extended to 128k, and then SFT. YARN is introduced during the 32k sequence-length stage to support up to 256k tokens.
- Baseline without N-gram Embedding: LongCat-Flash-Lite-Vanilla converts the N-gram Embedding parameter budget into additional experts while preserving total parameter count.
- Both models use the same training strategy and data recipe, making their base-model comparison more informative about parameter allocation than comparisons with independently trained external chat models.
6.2 Base Model Evaluation
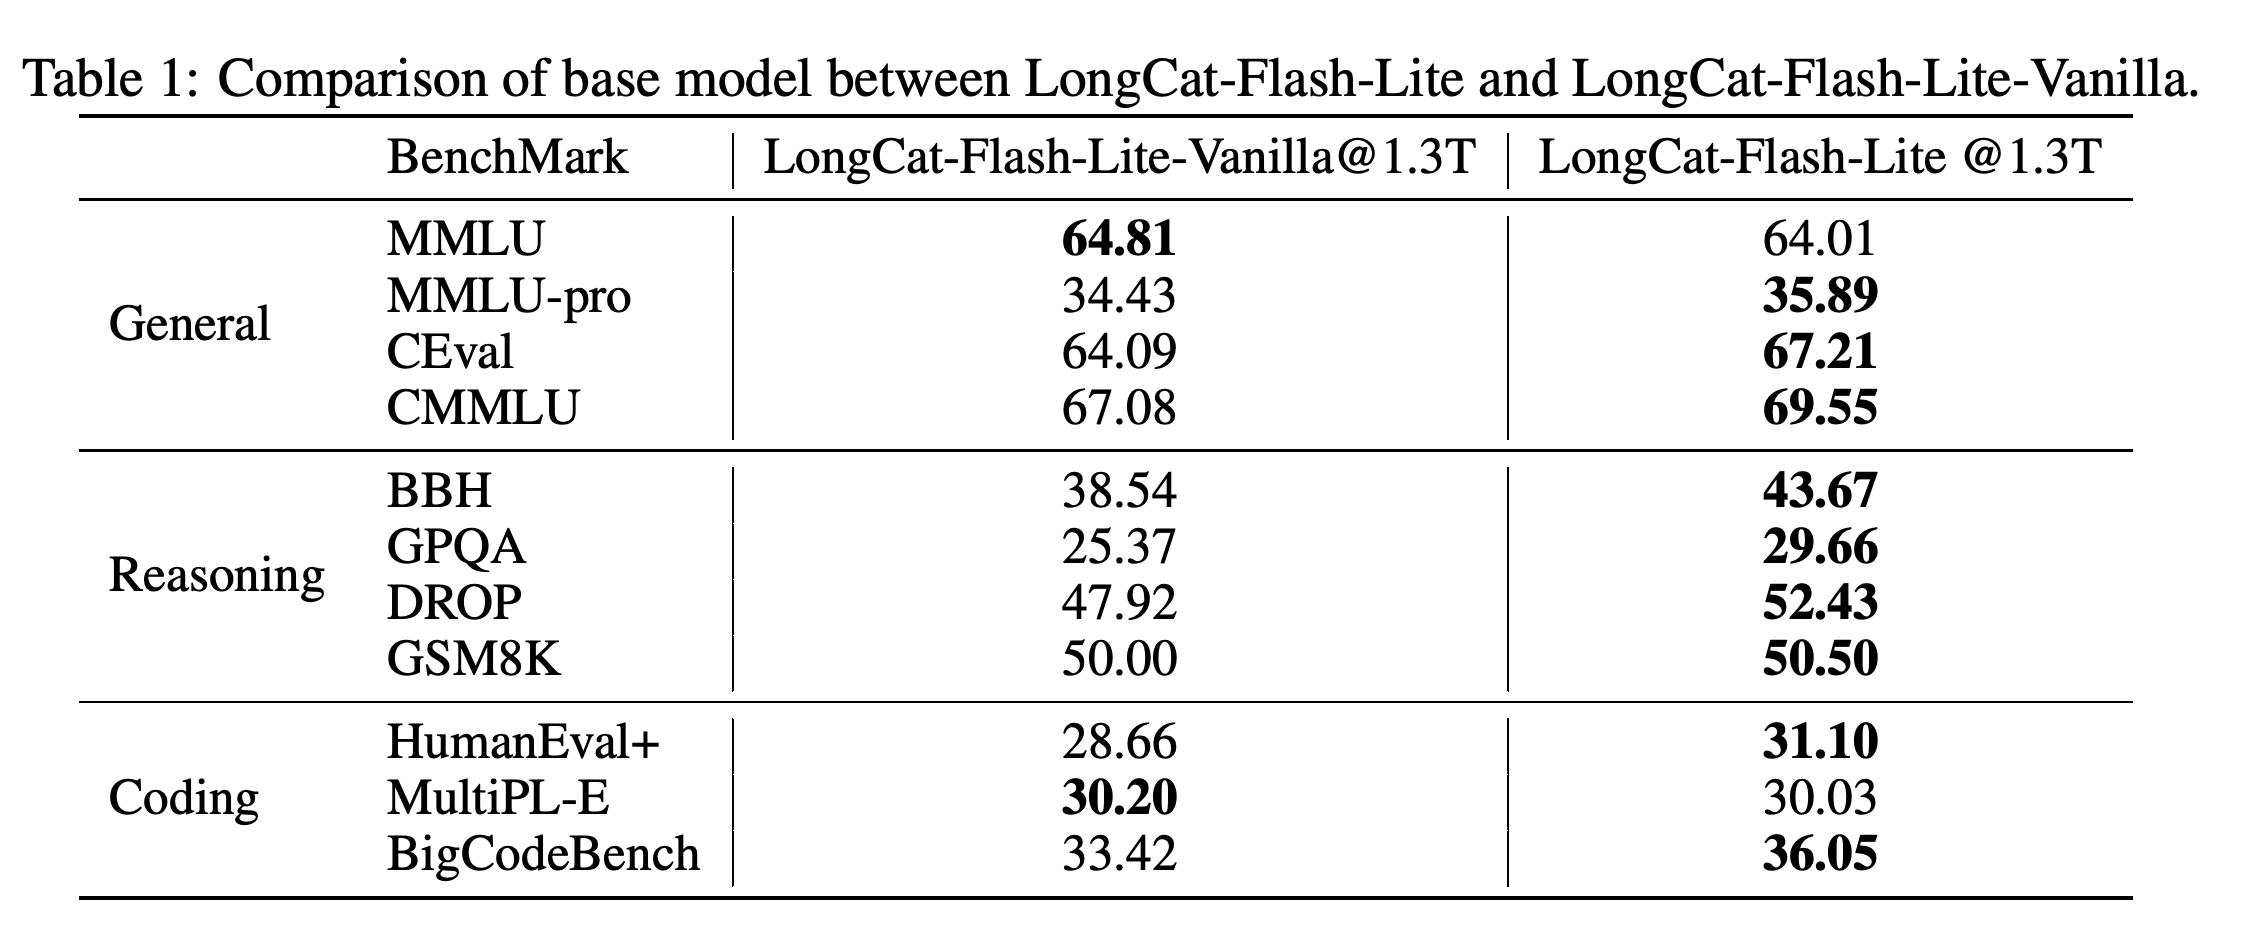
At the 1.3T-token checkpoints in Table 1, LongCat-Flash-Lite exceeds Vanilla on 9 of 11 benchmarks. Improvements include BBH from 38.54 to 43.67, GPQA from 25.37 to 29.66, DROP from 47.92 to 52.43, and BigCodeBench from 33.42 to 36.05; MMLU decreases from 64.81 to 64.01 and MultiPL-E from 30.20 to 30.03.
- The remaining gains are MMLU-pro 34.43→35.89, CEval 64.09→67.21, CMMLU 67.08→69.55, GSM8K 50.00→50.50, and HumanEval+ 28.66→31.10.
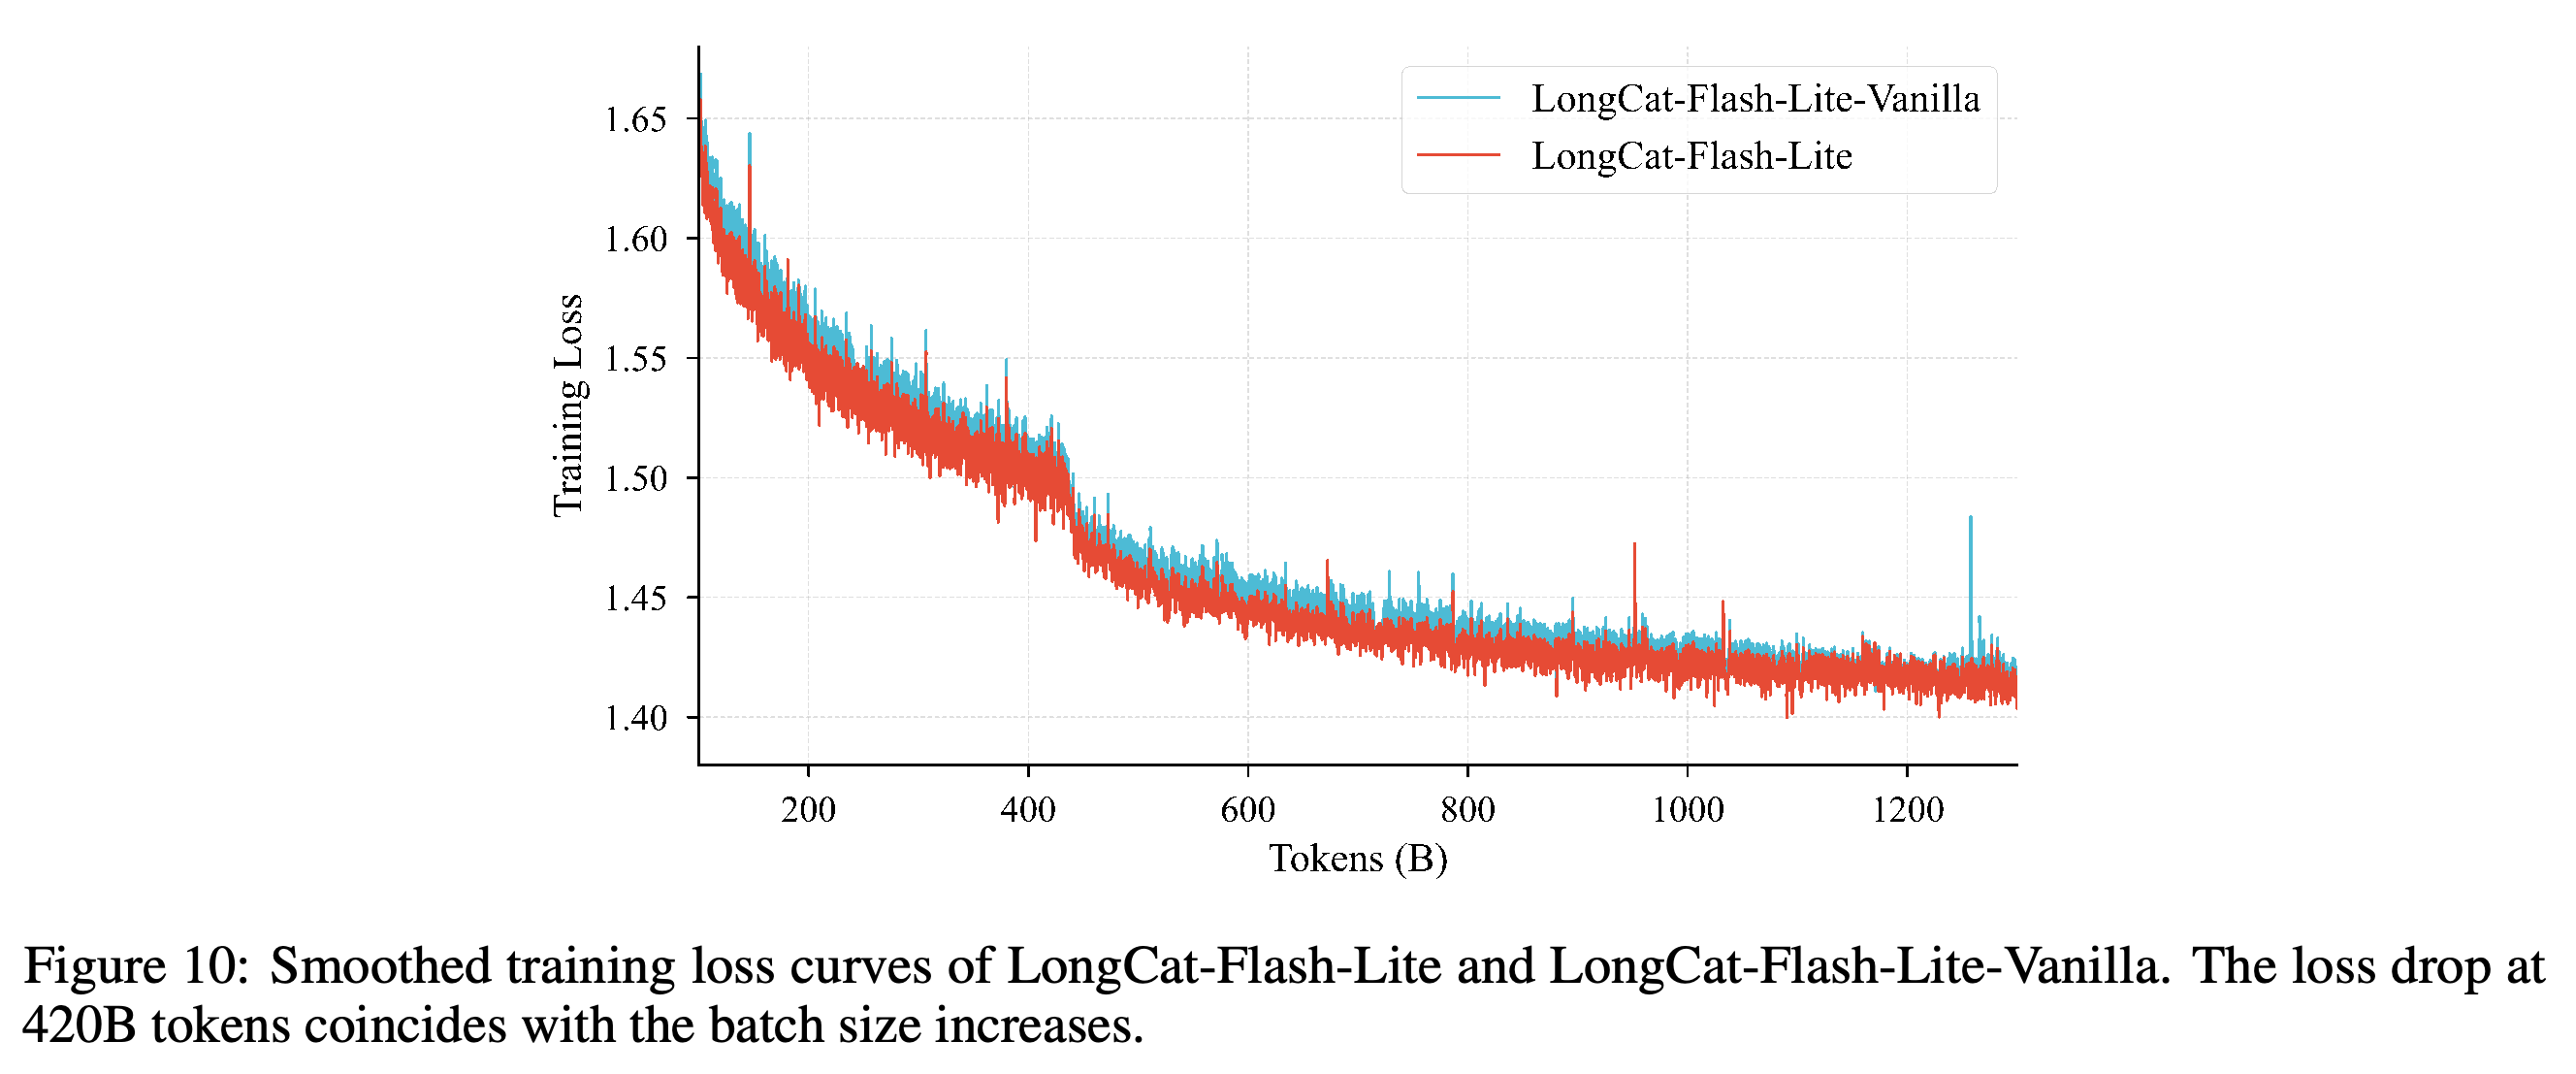
- Figure 10 shows a lower training-loss trajectory over the plotted interval through approximately 1.3T tokens. The shared drop at 420B tokens coincides with an increase in batch size.
- These benchmark results are from intermediate base-model checkpoints, not the final 11T-token pre-training endpoint.
The matched 1.3T-token comparison favors LongCat-Flash-Lite on nine benchmarks, with larger absolute gains in BBH, GPQA, and DROP than in GSM8K. MMLU and MultiPL-E favor Vanilla, so the table supports broad but not universal downstream improvement.
The embedding-based model maintains a lower training-loss trajectory over the plotted interval. Both curves drop near 420B tokens when batch size increases, so that discontinuity should not be attributed to an embedding-specific intervention.
6.3 Chat Model Evaluation
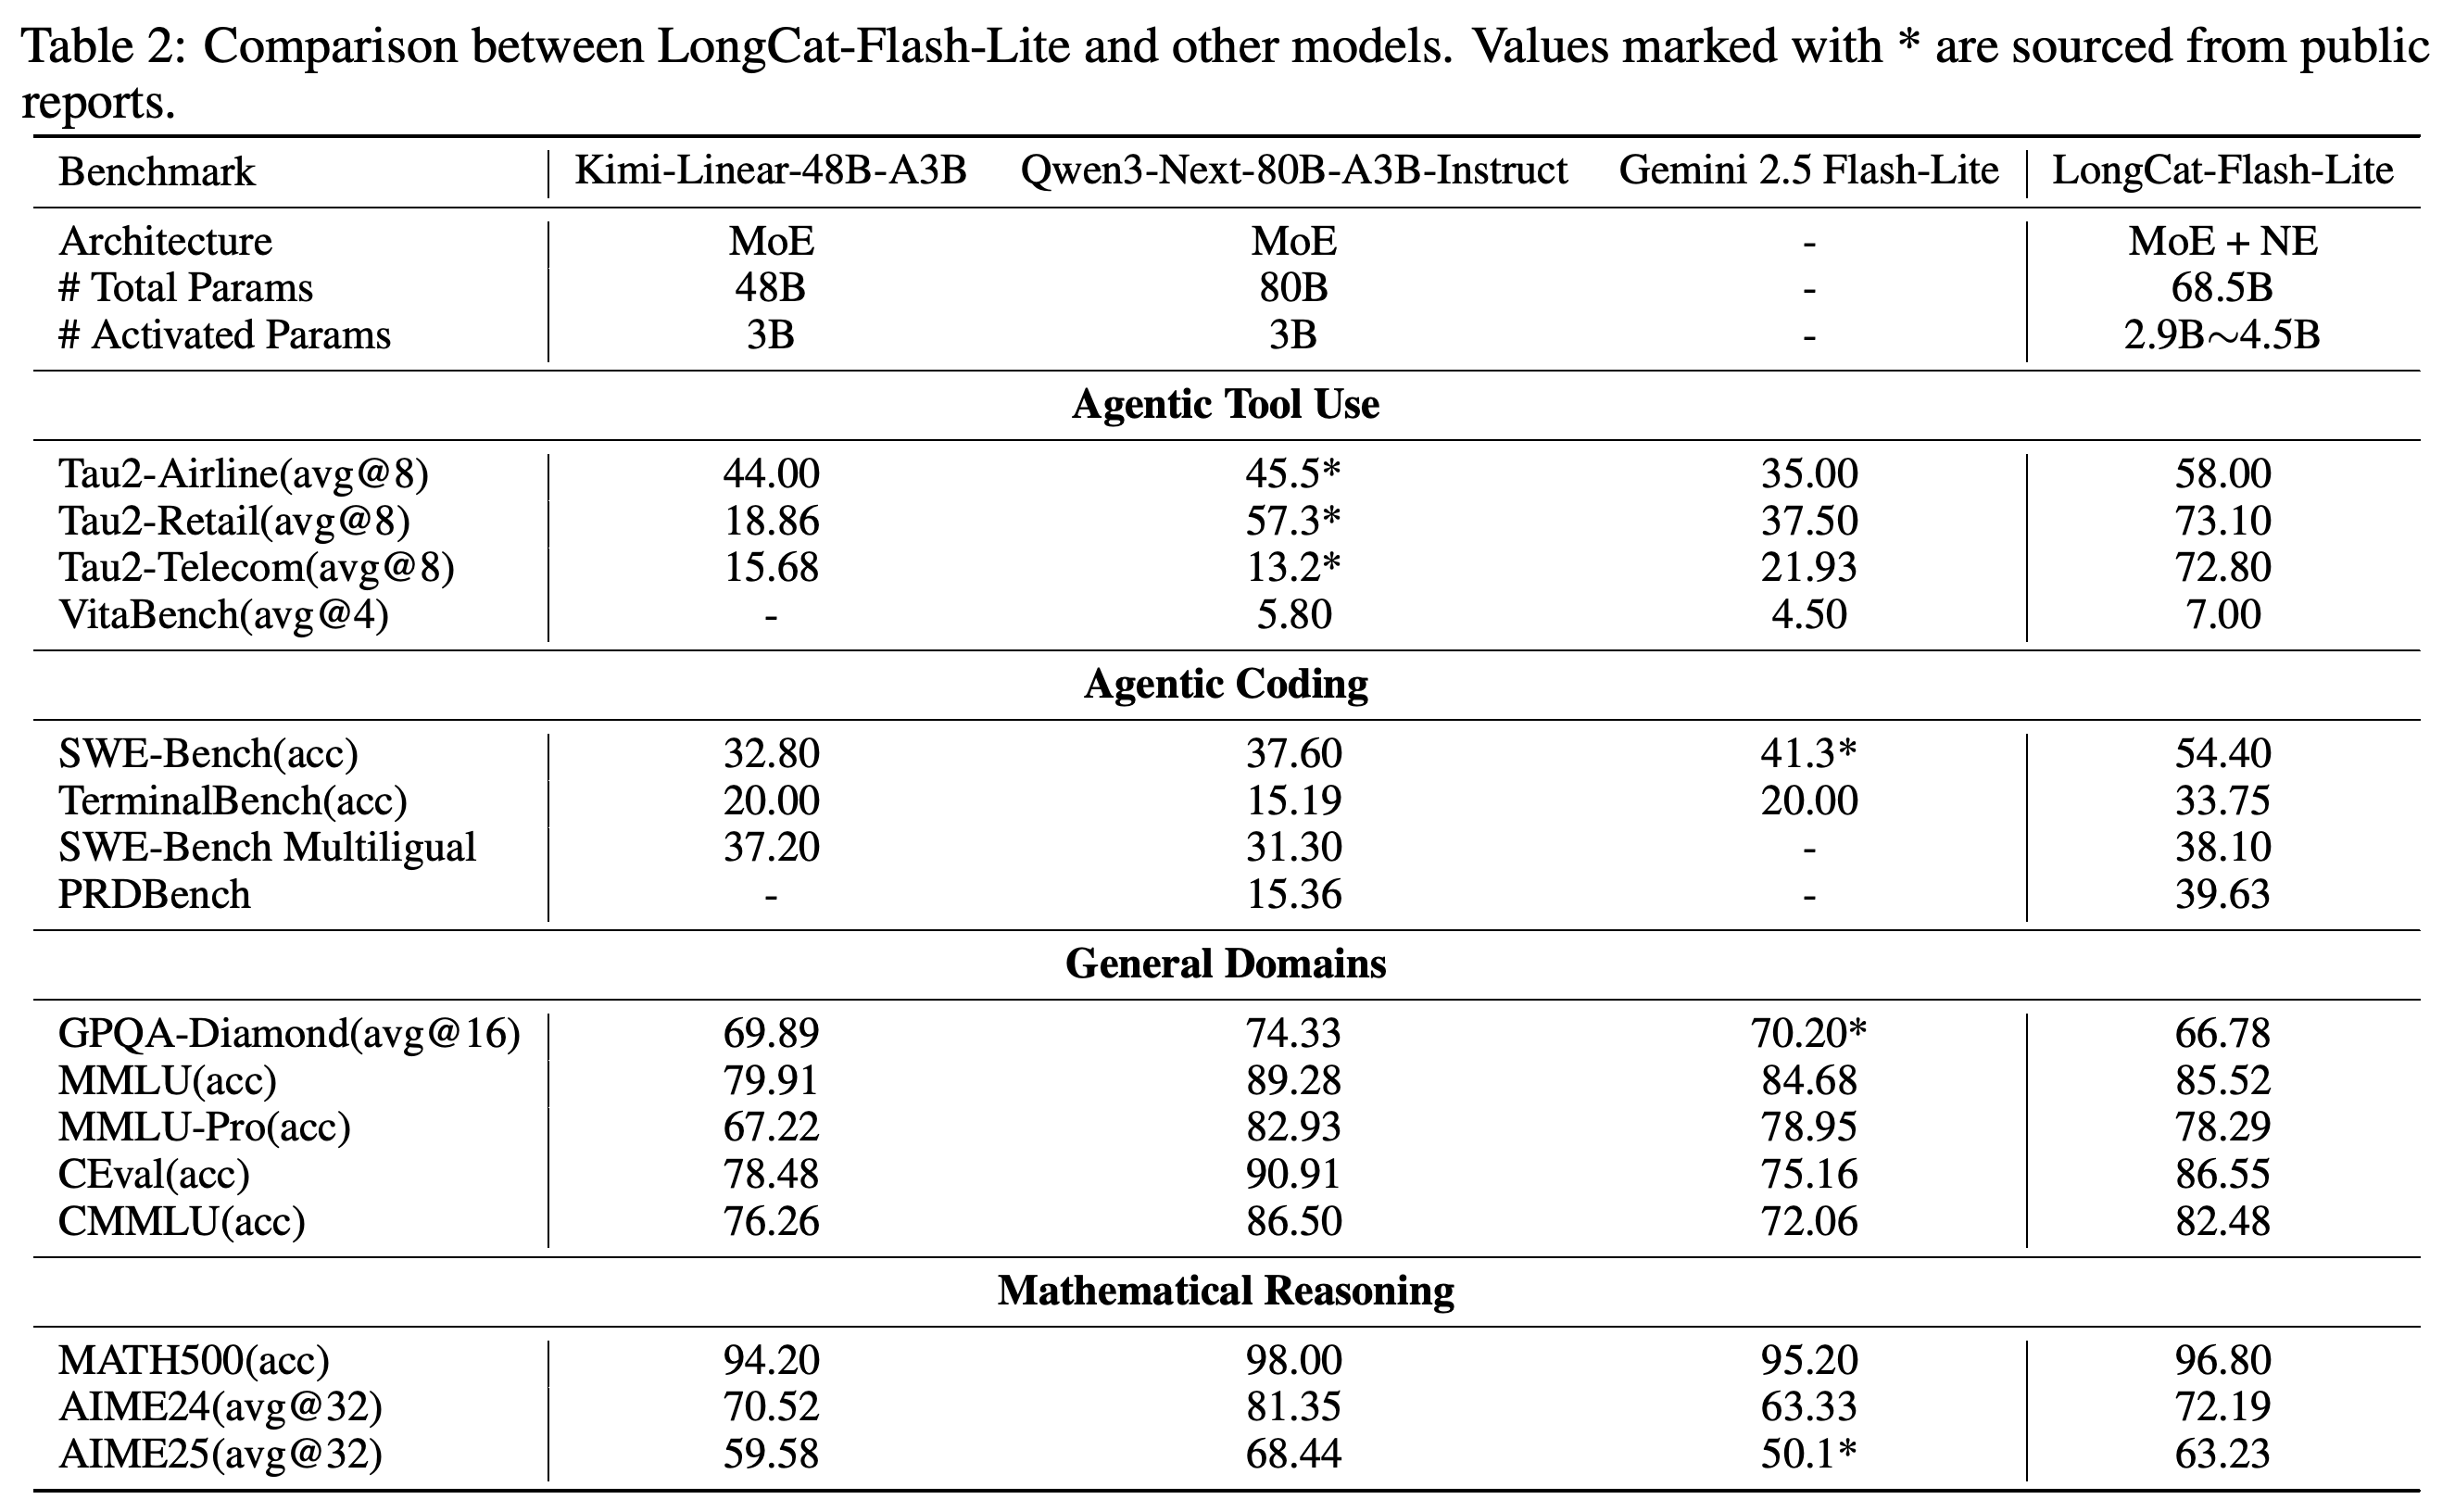
Table 2 compares the chat model with Kimi-Linear-48B-A3B, Qwen3-Next-80B-A3B-Instruct, and Gemini 2.5 Flash-Lite Preview 09-2025. LongCat-Flash-Lite leads the reported agentic tool-use results: Tau2-Airline(avg@8) 58.00, Tau2-Retail(avg@8) 73.10, Tau2-Telecom(avg@8) 72.80, and VitaBench(avg@4) 7.00.
- The τ²-Bench evaluation uses the revised dataset at https://github.com/AGI-Eval-Official/tau2-bench-revised because the authors identify noise in the original version.
- Agentic coding scores are SWE-Bench(acc) 54.40, TerminalBench(acc) 33.75, SWE-Bench Multiligual 38.10, and PRDBench 39.63, exceeding all available comparison scores in those rows.
- Some comparison values are taken from public reports, marked with * in Table 2; these are not uniformly controlled reruns.
The chat results do not show uniform superiority outside agentic tasks. LongCat-Flash-Lite scores 66.78 on GPQA-Diamond(avg@16), below all three comparison models, and trails Qwen3-Next-80B-A3B-Instruct on every reported general-domain and mathematical benchmark.
- Its other general-domain scores are MMLU(acc) 85.52, MMLU-Pro(acc) 78.29, CEval(acc) 86.55, and CMMLU(acc) 82.48.
- Mathematical scores are MATH500(acc) 96.80, AIME24(avg@32) 72.19, and AIME25(avg@32) 63.23; these exceed Kimi-Linear-48B-A3B and Gemini 2.5 Flash-Lite but not Qwen3-Next-80B-A3B-Instruct.
- No Vanilla chat-model comparison is reported, so the external agentic results do not isolate the contribution of embedding scaling from training data and post-training.
LongCat-Flash-Lite leads every agentic row with available comparison scores, but Qwen3-Next-80B-A3B-Instruct leads all reported general-domain and mathematics rows. LongCat-Flash-Lite has the lowest GPQA-Diamond score among the four models; public-report values marked with * and missing entries limit the uniformity of the comparison.
6.4 Fast Inference with Optimized Kernels
Deployment combines Eagle3 with a 3-step speculative decoding strategy, wide EP (Expert Parallel), and SBO (Single Batch Overlap). Kernel Optimization addresses launch overhead through communication/operator fusion, activation quantization integrated into existing operators for the quantized model, unified routing and zero-expert selection, and an optimized attention-combine kernel.
- Fusion examples are AllReduce + Residual Add + RMSNorm, AllGather + Q-Norm + KV-Norm, and ReduceScatter + RMSNorm + Hidden State Combine.
- The optimized splitkv-and-combine implementation reduces combine-kernel latency by 50%; this is a component-level result, not a 50% end-to-end acceleration.
- PDL (Programmatic Dependent Launch) enables early launches of dependent kernels to overlap execution. Figure 8b presents the combined serving results, without an ablation separating Eagle3, caching, fusion, and PDL.
7 Conclusions
The report concludes that embedding scaling can improve the loss–capacity trade-off relative to expert expansion in specific sparsity and architectural regimes. LongCat-Flash-Lite demonstrates this allocation strategy at larger scale, while the N-gram Cache and optimized kernels address serving overhead introduced by the embedding branch.
Appendix
- The supplied 18-page PDF contains no appendix. Following the conclusions and acknowledgements, pages 16–18 contain references; no supplementary experiments or implementation appendix are provided.
Brief Thoughts
The strongest evidence is the controlled parameter-allocation comparison: matched total parameters and training tokens across the small-scale study, followed by the same-data Vanilla comparison at 1.3T tokens. Together with the width, depth, hashing, and amplification experiments, these results support a conditional design rule rather than an unrestricted claim that embedding scaling always outperforms expert scaling. The approximately 50% embedding-budget recommendation should be interpreted alongside the architecture-dependent crossings and different Chinese and English validation behavior. Figure 9 narrows the per-layer claim: PLNE’s small validation gains do not extend to training loss or consistently survive further scaling.
The evidence is less complete for attribution of chat-model strengths and end-to-end inference gains. The report lacks a Vanilla chat comparison, an expert-only serving frontier, and component-level system ablations; it also reports no uncertainty intervals or repeated-seed variability for the scaling and benchmark results. The serving frontier is specific to 8xH800-80G, ISL=4K, and OSL=1K, so it does not establish the same benefit across hardware, context lengths, or batch distributions. Embedding-based drafting and early rejection remain research proposals and should not be counted among demonstrated speedups.