


Remote Labor Index: Measuring AI Automation of Remote Work | Summary
30 Oct 2025 | Paper Review LLM Evaluation LLM Agents BenchmarkContents
This article explains the key points of Remote Labor Index: Measuring AI Automation of Remote Work.
- 2025-10-30 (arXiv)
- Mazeika, Mantas, Gatti, Alice, Menghini, Cristina, Sehwag, Udari Madhushani, Singhal, Shivam, Orlovskiy, Yury, Basart, Steven, Sharma, Manasi, Peskoff, Denis, Lau, Elaine, et al.
- Center for AI Safety, Scale AI
- Paper
Summary
- Strong benchmark results do not establish whether AI agents, systems that use tools to complete projects, can produce acceptable professional work. Among the six evaluated agents, Manus achieved the highest automation rate at 2.5%, measured by human reviewers judging whether submitted deliverables, the requested work products, completed projects at least as well as professional human references.
- The Remote Labor Index (RLI), a benchmark of complete remote freelance projects, contains 240 projects spanning 23 work categories in Upwork, an online freelance marketplace. Each project includes a brief, input files, and a professional human deliverable; available self-reported human completion times average 28.9 hours, and project costs average $632.6.
- Evaluators assess acceptance from a reasonable client’s perspective, with 94.4% inter-annotator agreement, the reported consistency among reviewers, for automation rate. Elo, a relative score fitted from pairwise deliverable preferences, distinguishes partial progress despite low completion rates; all evaluated systems score below the human baseline of 1,000.
- Analysis of roughly 400 evaluations identifies poor quality, incomplete deliverables, corrupted files, and inconsistencies as recurring failures. Accepted examples include audio work, image-based advertising, report writing, and interactive data visualization; the authors identify difficulty verifying and repairing complex audiovisual outputs as a recurring limitation.
- RLI measures autonomous project completion under the tested tools and execution conditions, rather than economy-wide job displacement. Coverage excludes client interaction, teamwork, and several other work types; deliberate category-level exclusion of work already readily solved by AI also limits representativeness.
1 Introduction
The paper motivates RLI through a measurement gap: progress on knowledge, reasoning, software engineering, and basic computer-use benchmarks does not directly establish the ability to complete economically valuable remote projects. Its evaluation unit is an entire project, with a professional deliverable providing a concrete standard for successful completion; most projects originate from actual freelance transactions.
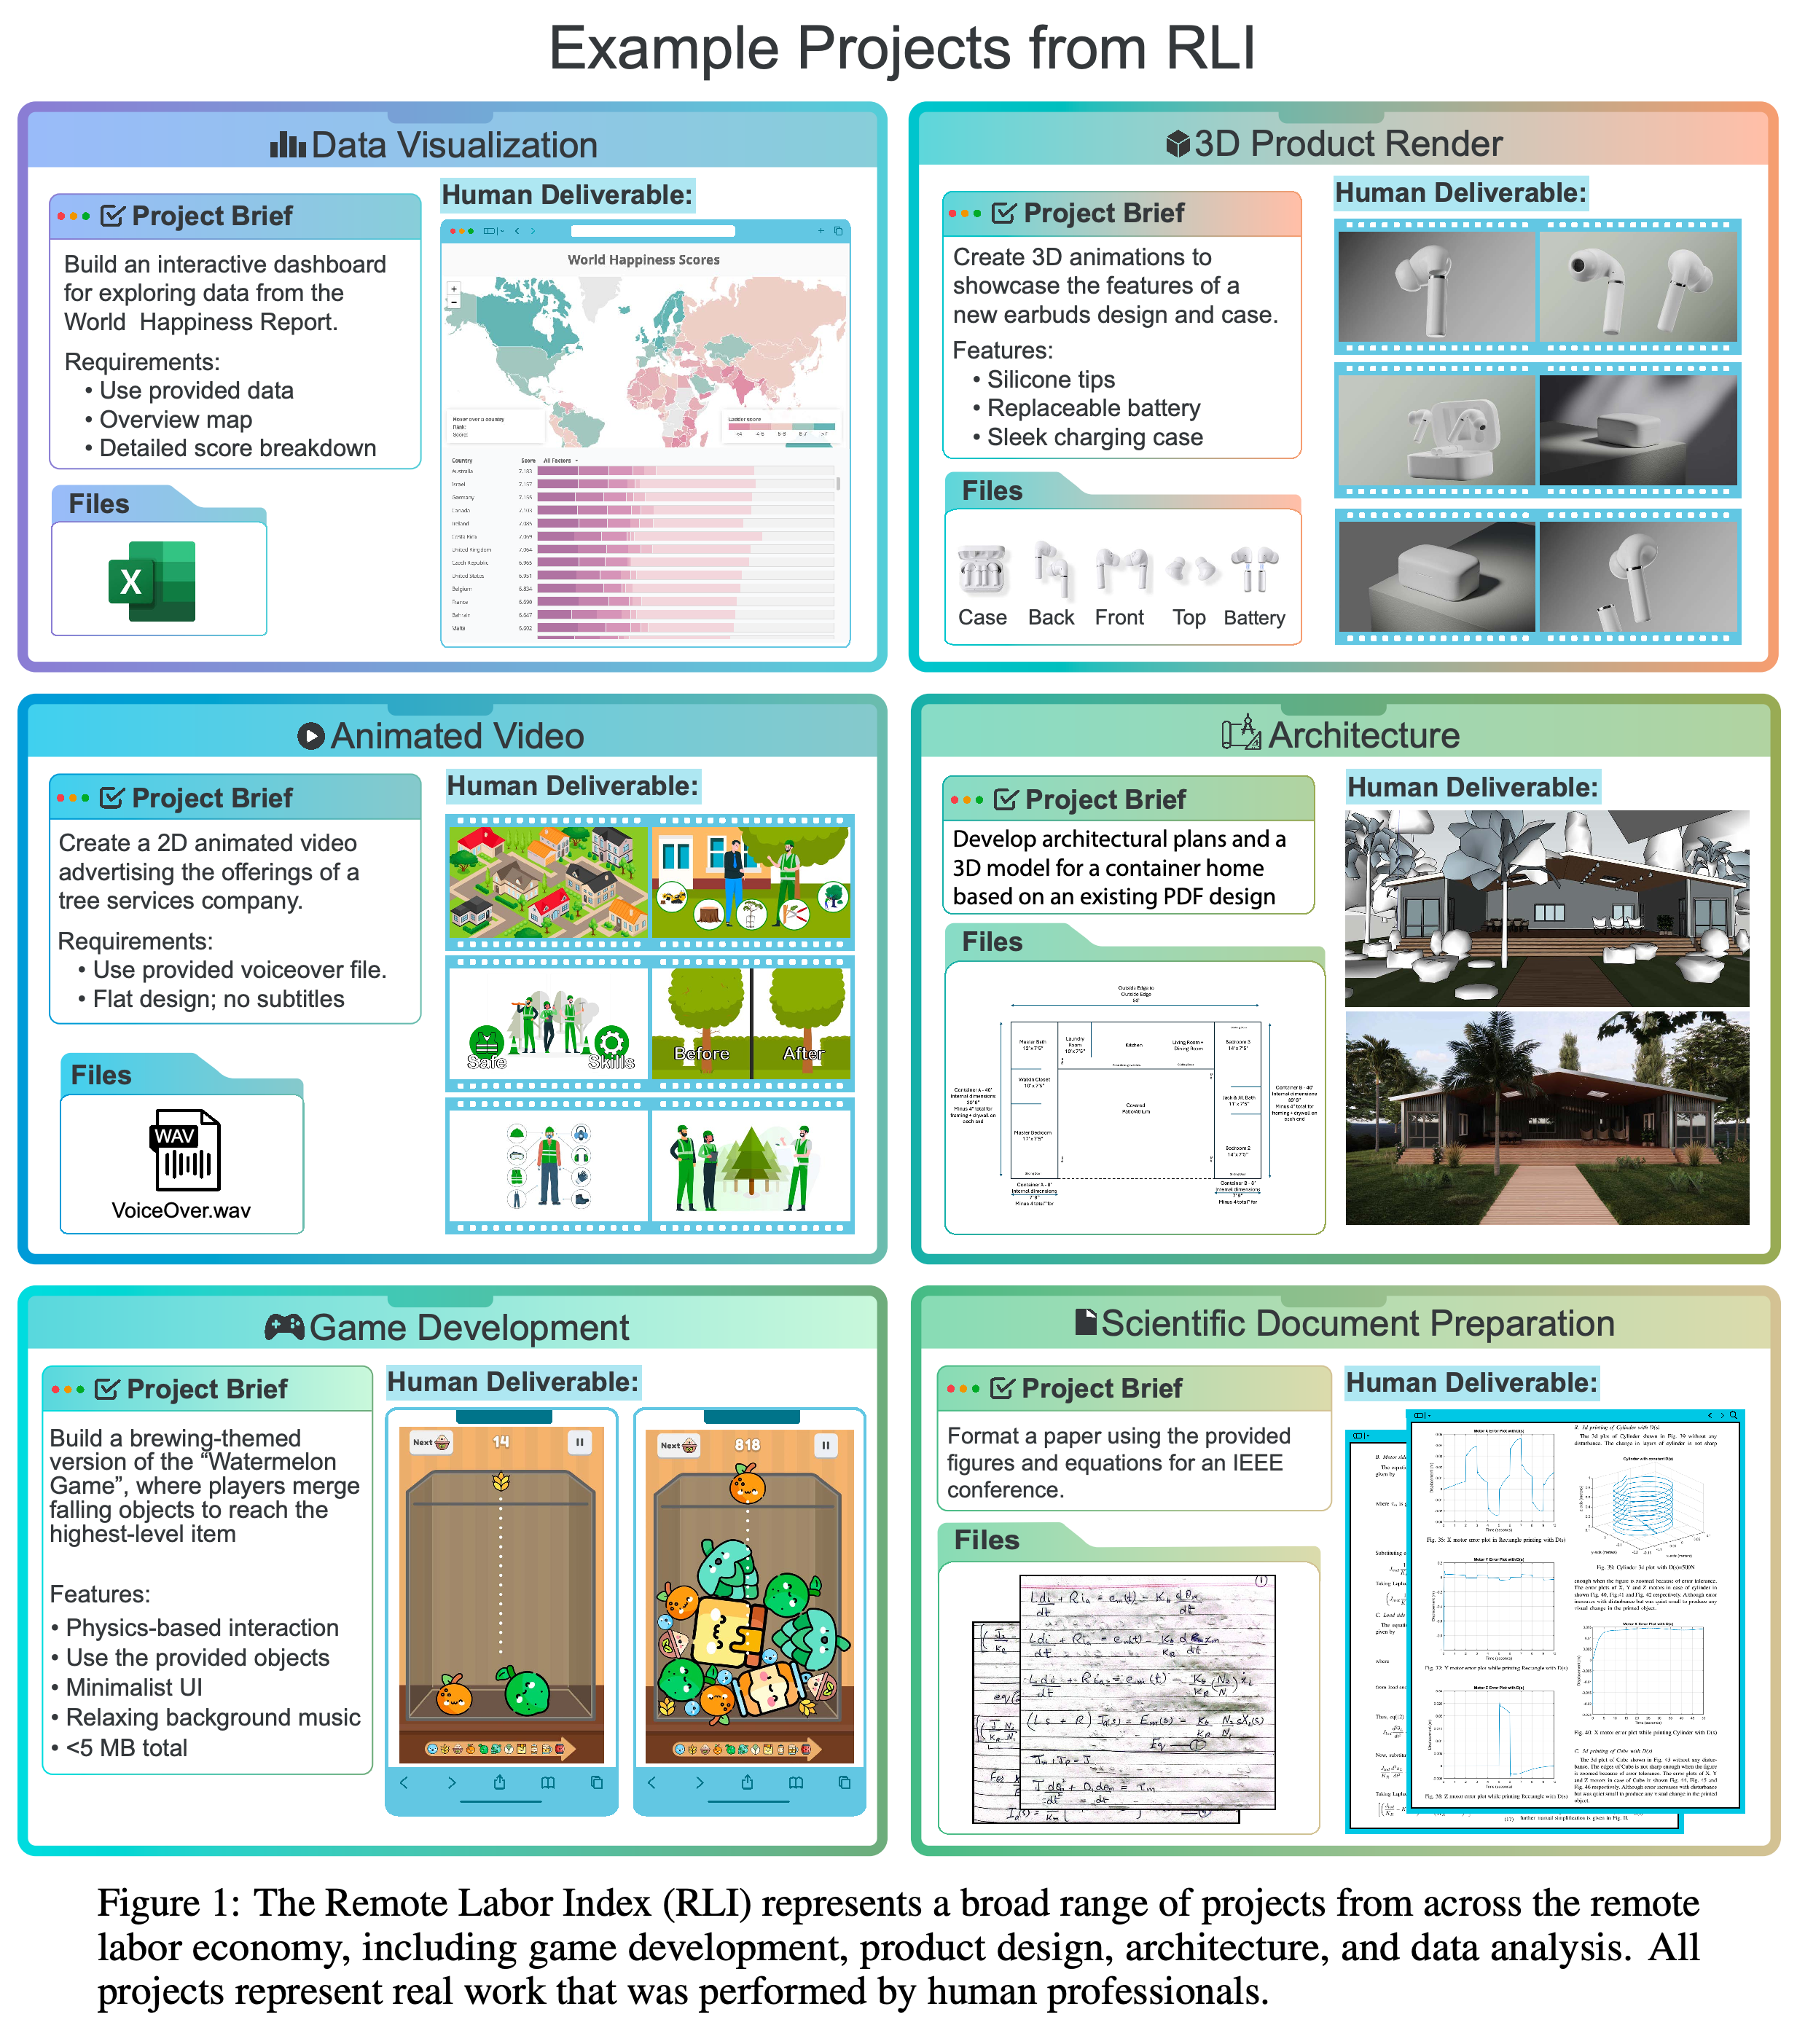
- Figure 1 illustrates dashboards, product animations, architectural models, games, and scientific document preparation, each with different inputs and deliverable requirements.
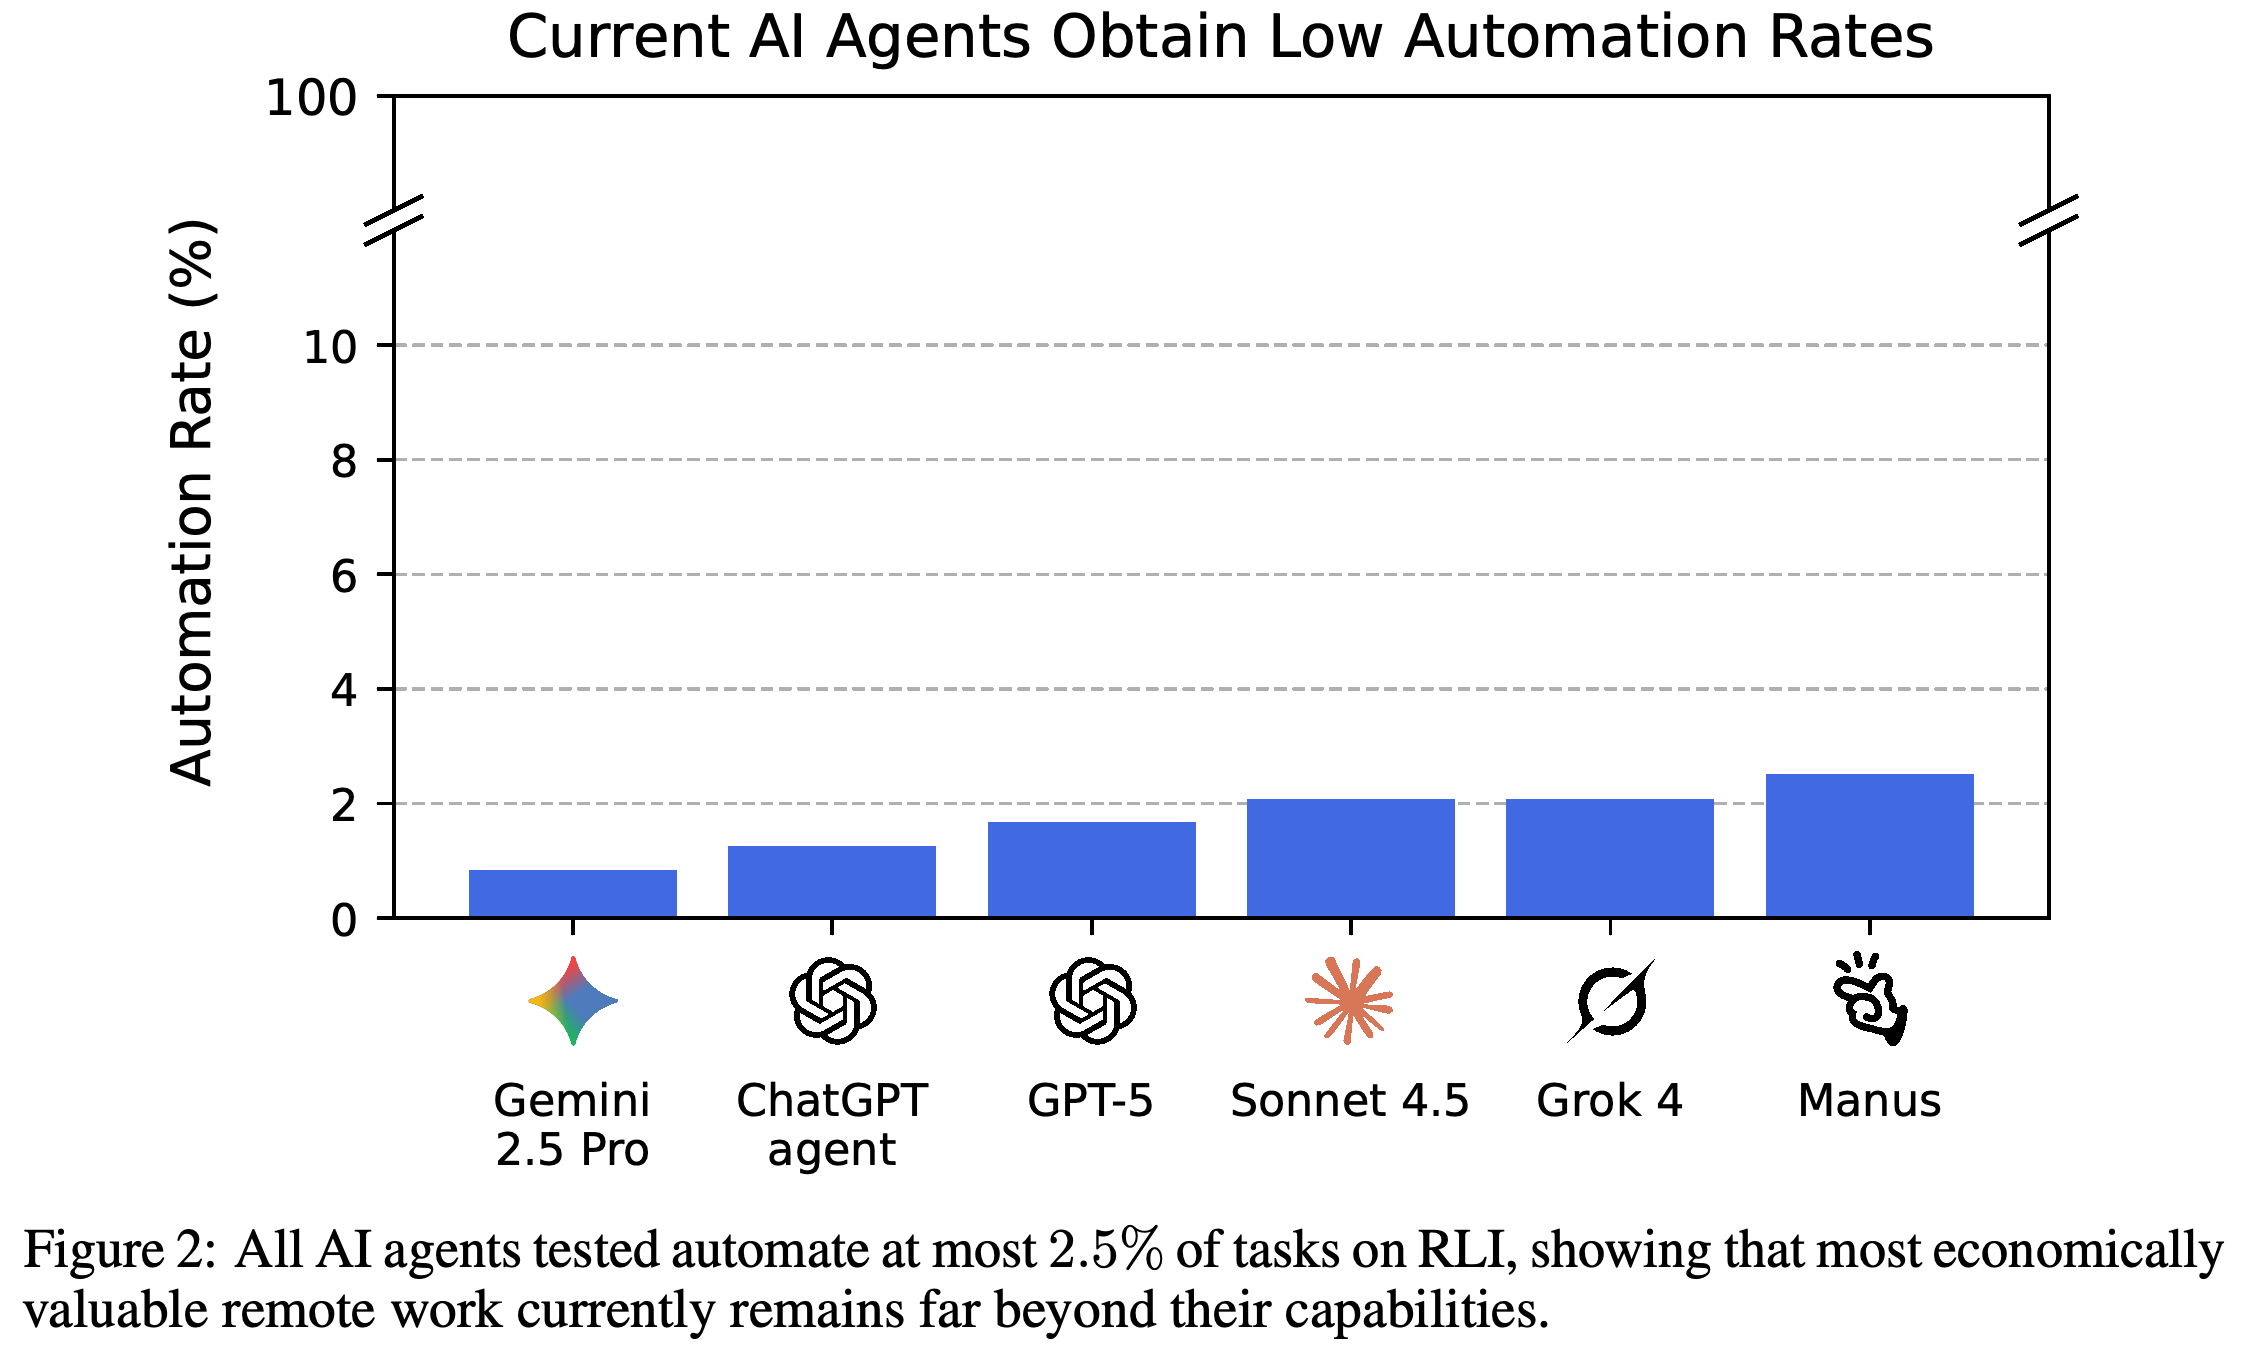
- Figure 2 summarizes the finding that none of the six evaluated agents exceeds a 2.5% automation rate.
Inputs range from spreadsheets and voice recordings to design files, while outputs include interactive applications, animations, architectural artifacts, and formatted documents. These examples show the variety of artifacts that reviewers must inspect to assess complete-project acceptance.
All six bars remain below 3%, with Manus highest at 2.5%. The broken vertical axis places these small acceptance rates against a 100% endpoint, showing the distance from complete automation under the benchmark criterion.
2 Related Work
The related work traces evaluation from academic knowledge tests to interaction with computers, websites, and tools, then to domain-specific professional benchmarks. GDPval, a benchmark of economically valuable tasks across professions, is the closest comparison discussed: the authors distinguish shared activities such as writing and web search from autonomous completion of whole freelance projects.
- RLI targets the combined specializations represented in remote freelance work, whereas the cognitive-ability comparison discussed in the paper concerns a broadly educated individual.
- The authors use transaction-based sourcing and complete professional deliverables to connect evaluation with practical project acceptance.
3 Remote Labor Index
RLI contains 240 complete remote freelance projects sourced from professionals and additional authorized examples of digital work. The benchmark evaluates agents against existing work products and reported project values.
3.1 Dataset Description
Each project consists of a brief describing the requested work, input files needed to perform it, and a professional human deliverable that completes the project. For freelancer-sourced projects, the professional supplies the brief and inputs; human cost and completion-time data are recorded where available.
- The final dataset covers 23 of Upwork’s 64 work categories, including design, architecture, audio-video production, games, and other work requiring coordinated artifacts.
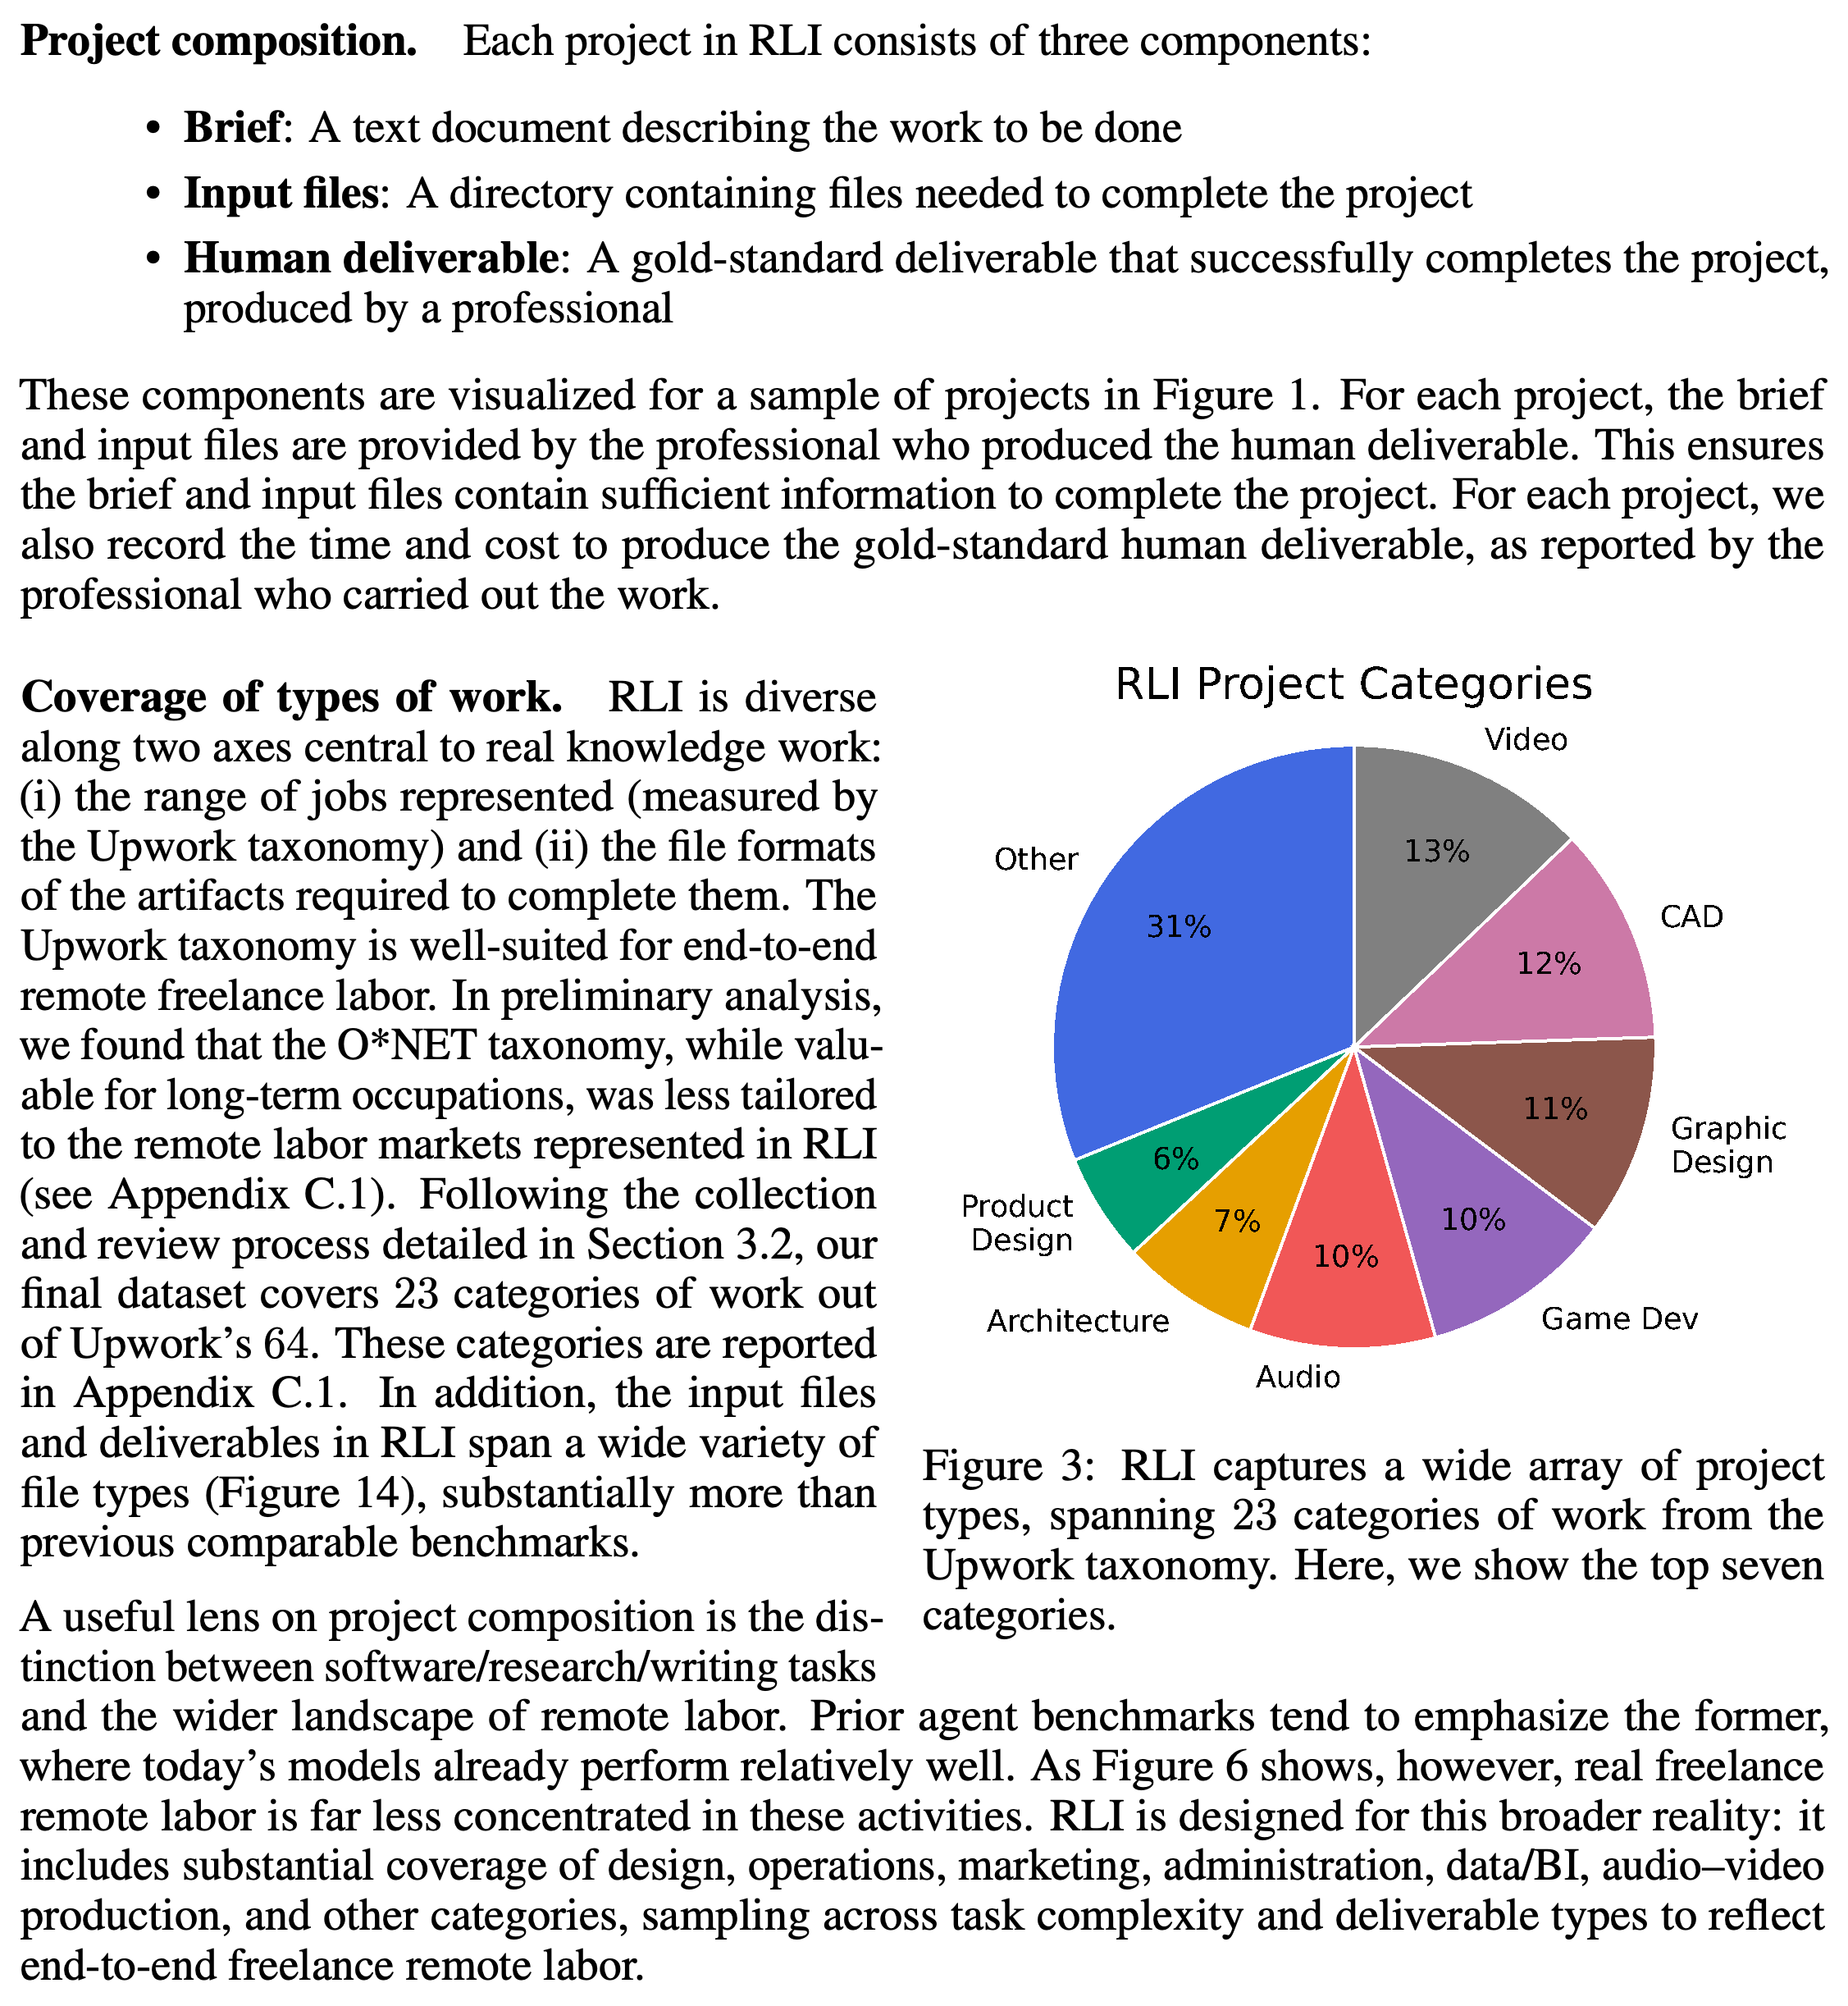
- Figure 3 reports Video at 13%, CAD, computer-aided design grouped under 3D Modeling & CAD, at 12%, Graphic Design at 11%, Game Dev, game development, and Audio at 10% each, Architecture at 7%, Product Design at 6%, and Other at 31%.
The largest named slices are Video at 13% and CAD at 12%, while Other accounts for 31%. The chart describes the curated benchmark’s work categories, not observed market job frequencies.
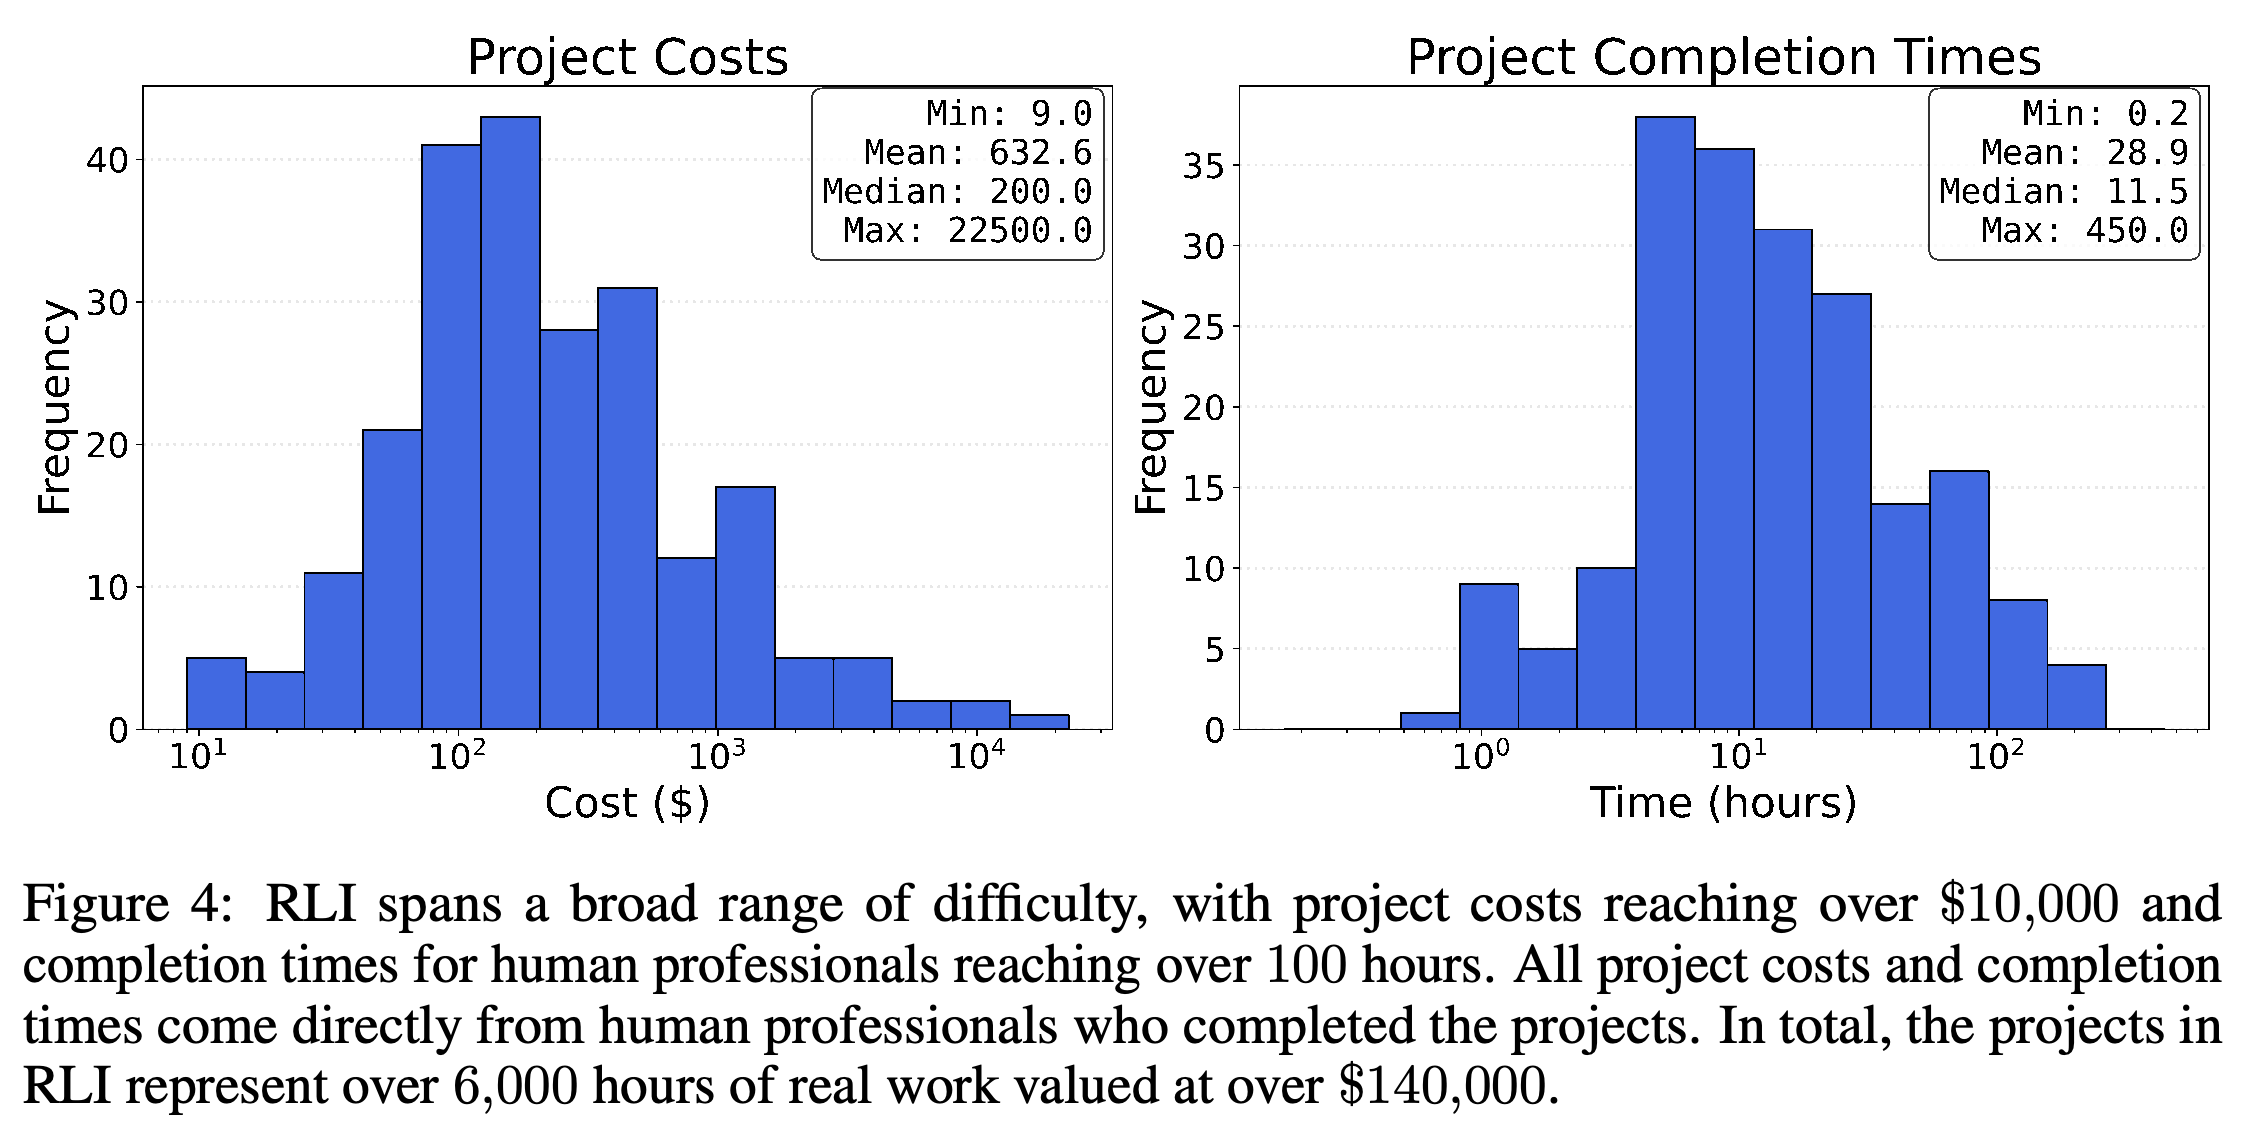
Available self-reported human completion times have a mean of 28.9 hours and median of 11.5 hours; reported costs have a mean of $632.6 and median of $200. Figure 4 shows costs from $9 to $22,500 and completion times from 0.2 to 450 hours, with the dataset representing over 6,000 hours of work valued at over $140,000.
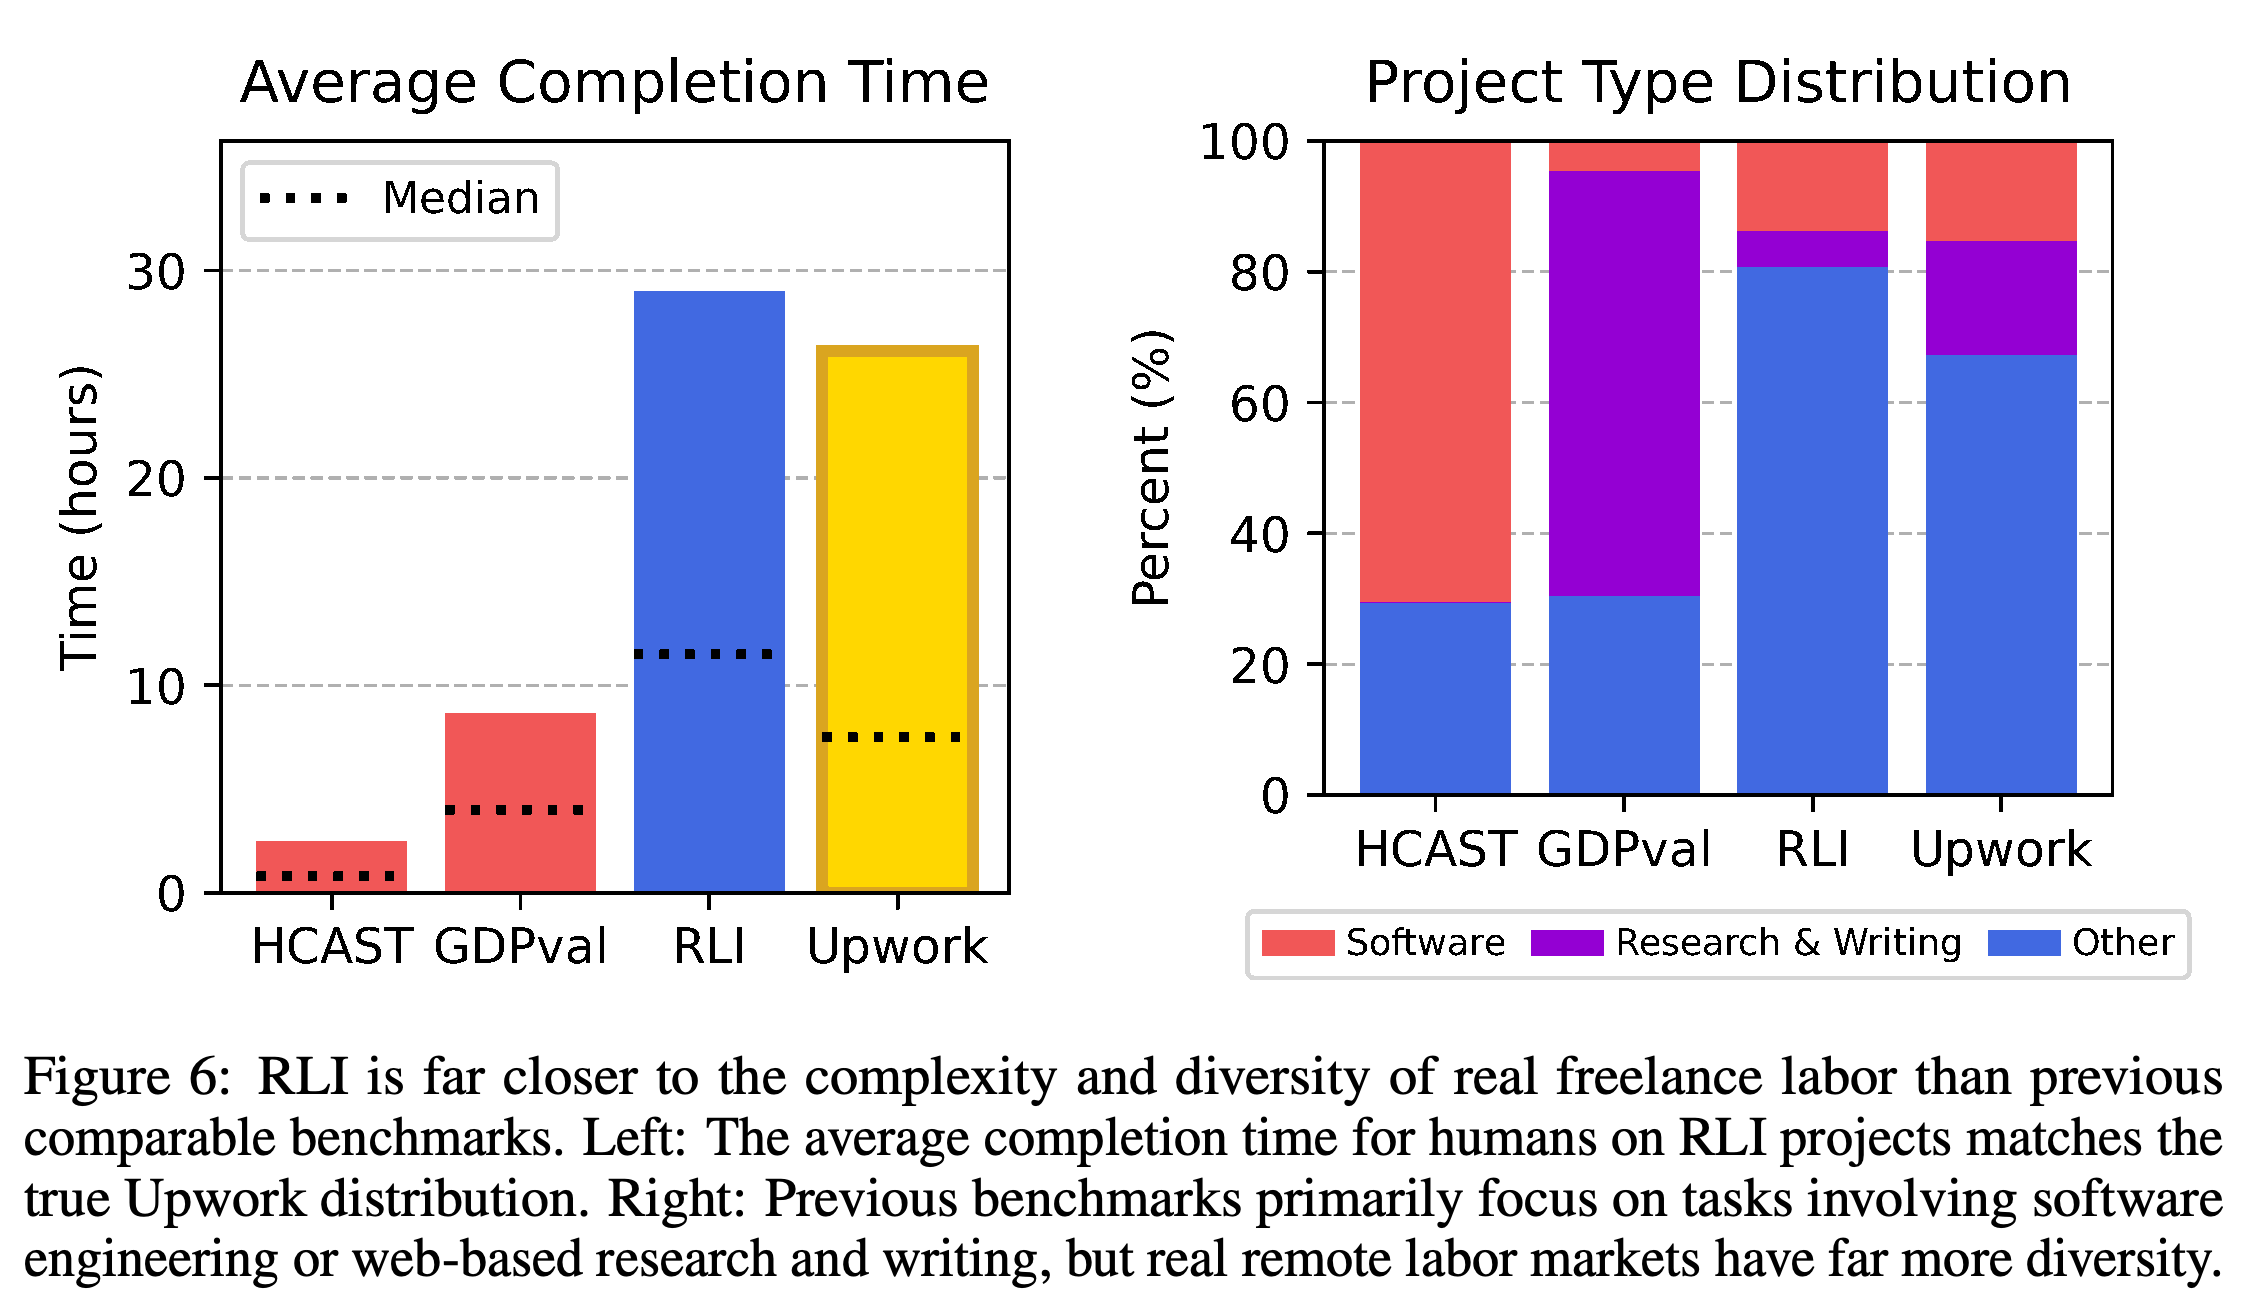
- Figure 6 compares RLI with HCAST, a human-calibrated software-task benchmark, GDPval, and an Upwork sample. RLI has longer average completion times and more work outside software, research, and writing than the comparison benchmarks.
- The Upwork project-type estimate classifies taxonomy categories rather than measuring job frequencies, limiting claims that RLI matches the market’s project mix.
The logarithmic horizontal axes show broad ranges and long upper tails. Means exceed medians for both variables, indicating that expensive and lengthy projects raise the averages above the typical reported project.
RLI has longer average human completion times and more work outside software, research, and writing than HCAST and GDPval. The Upwork time comparison uses sampled jobs, whereas the project-type estimate uses taxonomy categories; these panels provide different forms of market comparison.
3.2 Dataset Collection
The authors recruited 358 freelancers with verified Upwork accounts and collected 550 initial projects. Contributors averaged 2,341 hours worked, 89 prior jobs, and $23,364 in Upwork earnings; payment for existing work samples ranged from $15 to $200 per project, averaging $41.
- Section 3.2 reports 43 eligible categories and sourcing counts of 207 freelance-platform projects, 7 additional commissioned or uncommon projects, and 33 authorized online examples. These counts total 247, and the paper does not explicitly reconcile them with the 240 final projects.
- Review rounds checked suitability, completeness, renderability, the ability to display files for inspection, and reference quality, requested missing materials, and standardized accepted projects before final filtering.
The release separates 230 private quantitative-test projects from 10 public projects for qualitative evaluation and includes open-source evaluation-platform code. The authors anonymize personally identifiable information, information that identifies a person, and block domains associated with some online reference deliverables to reduce benchmark contamination, access to test material that could compromise evaluation.
- The paper reports that project descriptions are not searchable, although some human deliverables from uncommon or additional work sources exist online.
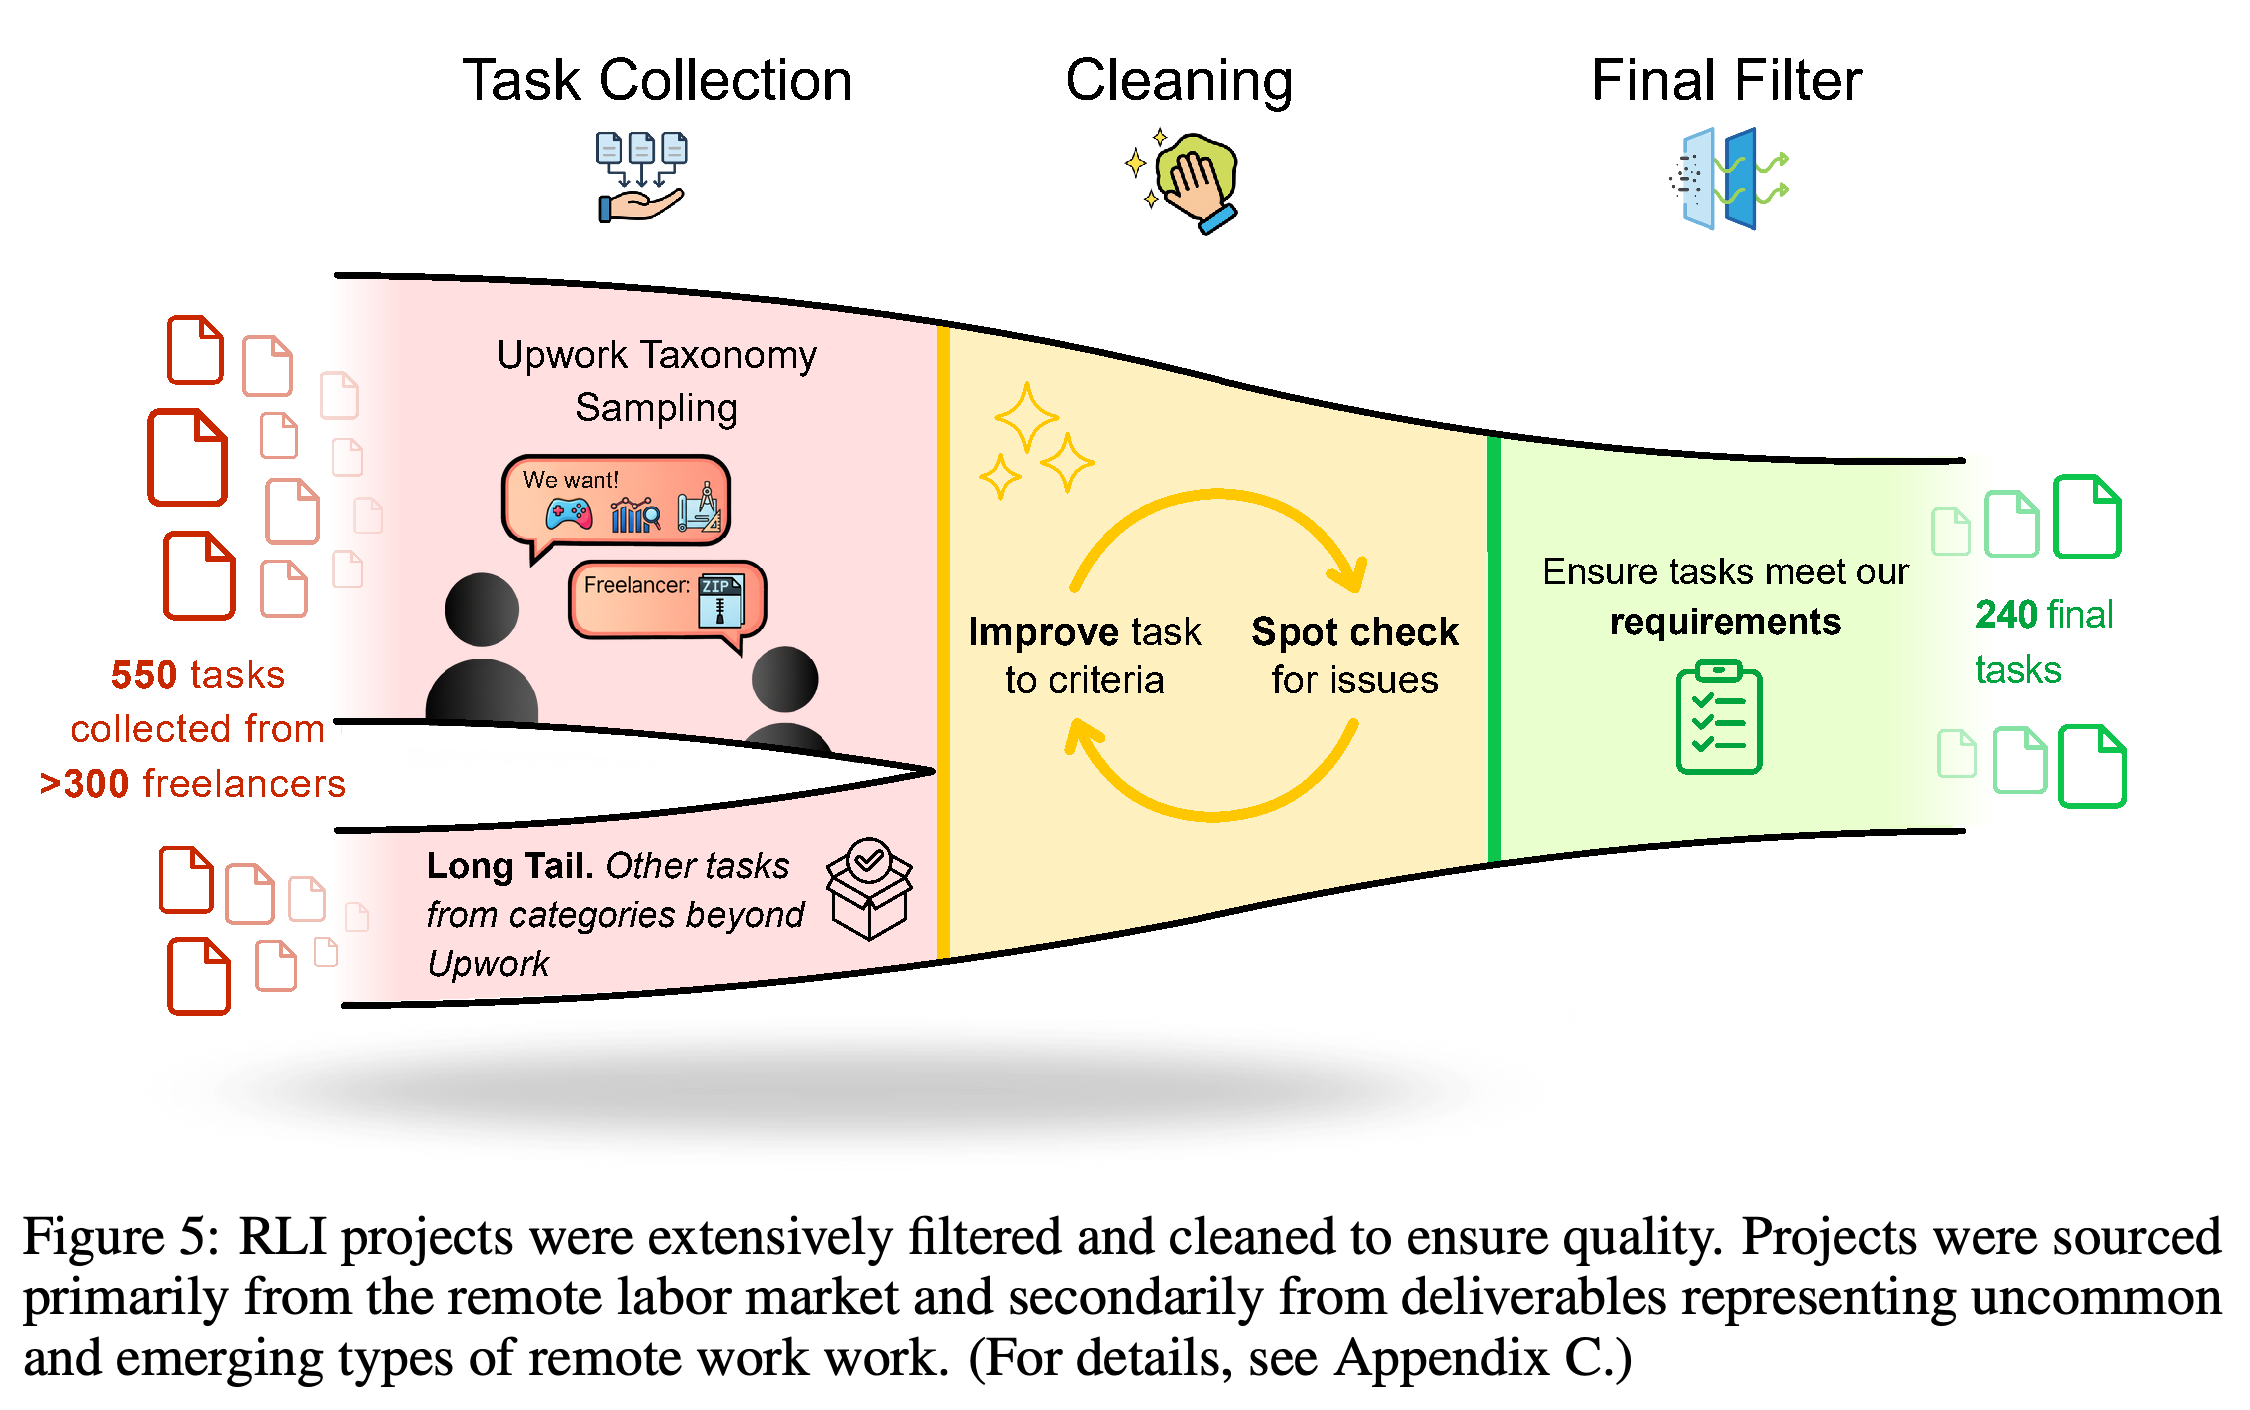
- Figure 5 depicts cleaning and suitability checks that reduce 550 initial projects to 240 final projects.
Repeated cleaning and suitability checks reduce 550 initial projects to 240 final projects. The diagram shows both the quality-control process and the substantial filtering behind the final dataset.
3.3 Metrics
Automation rate measures the percentage of projects for which an AI deliverable is judged to complete the work at least as well as its human reference. Elo measures relative preferences over project completion and quality, normalized so that the human baseline is 1,000 and a 400-point difference corresponds to 10:1 winning odds.
- Dollars earned sums reported human project values for projects successfully completed by an agent; the maximum reported bundle value is $143,991. This is a benchmark valuation, not evidence of actual payments to agents.
- Pairwise preference judgments prioritize closeness to completion when either AI deliverable fails and overall quality when both succeed.
Autoflation, the percentage cost reduction for completing the fixed RLI project bundle using the cheapest acceptable human or AI method, is computed as \(1-\frac{\sum \min\left(\operatorname{cost}(H),\min_j\operatorname{cost}(AI_j)\right)}{\sum\operatorname{cost}(H)}\). Here cost(H) is the human deliverable’s cost and cost(AI_j) is an evaluated agent’s cost for that project; an unsuccessful AI deliverable receives infinite cost.
3.4 Evaluation
Agents receive project briefs, input files, and instructions describing formats supported by the evaluation platform. Trained human evaluators inspect artifacts against the brief and human reference, using an overall reasonable-client judgment because preliminary granular rubrics, checklists of project-specific criteria, sometimes missed professional-quality failures.
- The three automation-rate ratings are unacceptable, acceptable at the reference standard, and acceptable with superior overall quality; ratings 2 and 3 count as successful completion.
- The open-source web platform displays dozens of formats and lets evaluators inspect deliverable directories, including interactive applications and three-dimensional artifacts.
Final judgments use majority voting. The main text describes three independent evaluations, while Appendix B.2 specifies two pairwise evaluations with a third when needed to break a tie. Automation-rate agreement is 94.4%; three-way Elo agreement is 56.9%, compared with 33.0% random chance, and opposing directional preferences occur with probability 5.9%.
- Requested review limits are 20 minutes for automation rate and 30 minutes for Elo, with average durations of 11.4 and 17.4 minutes respectively.
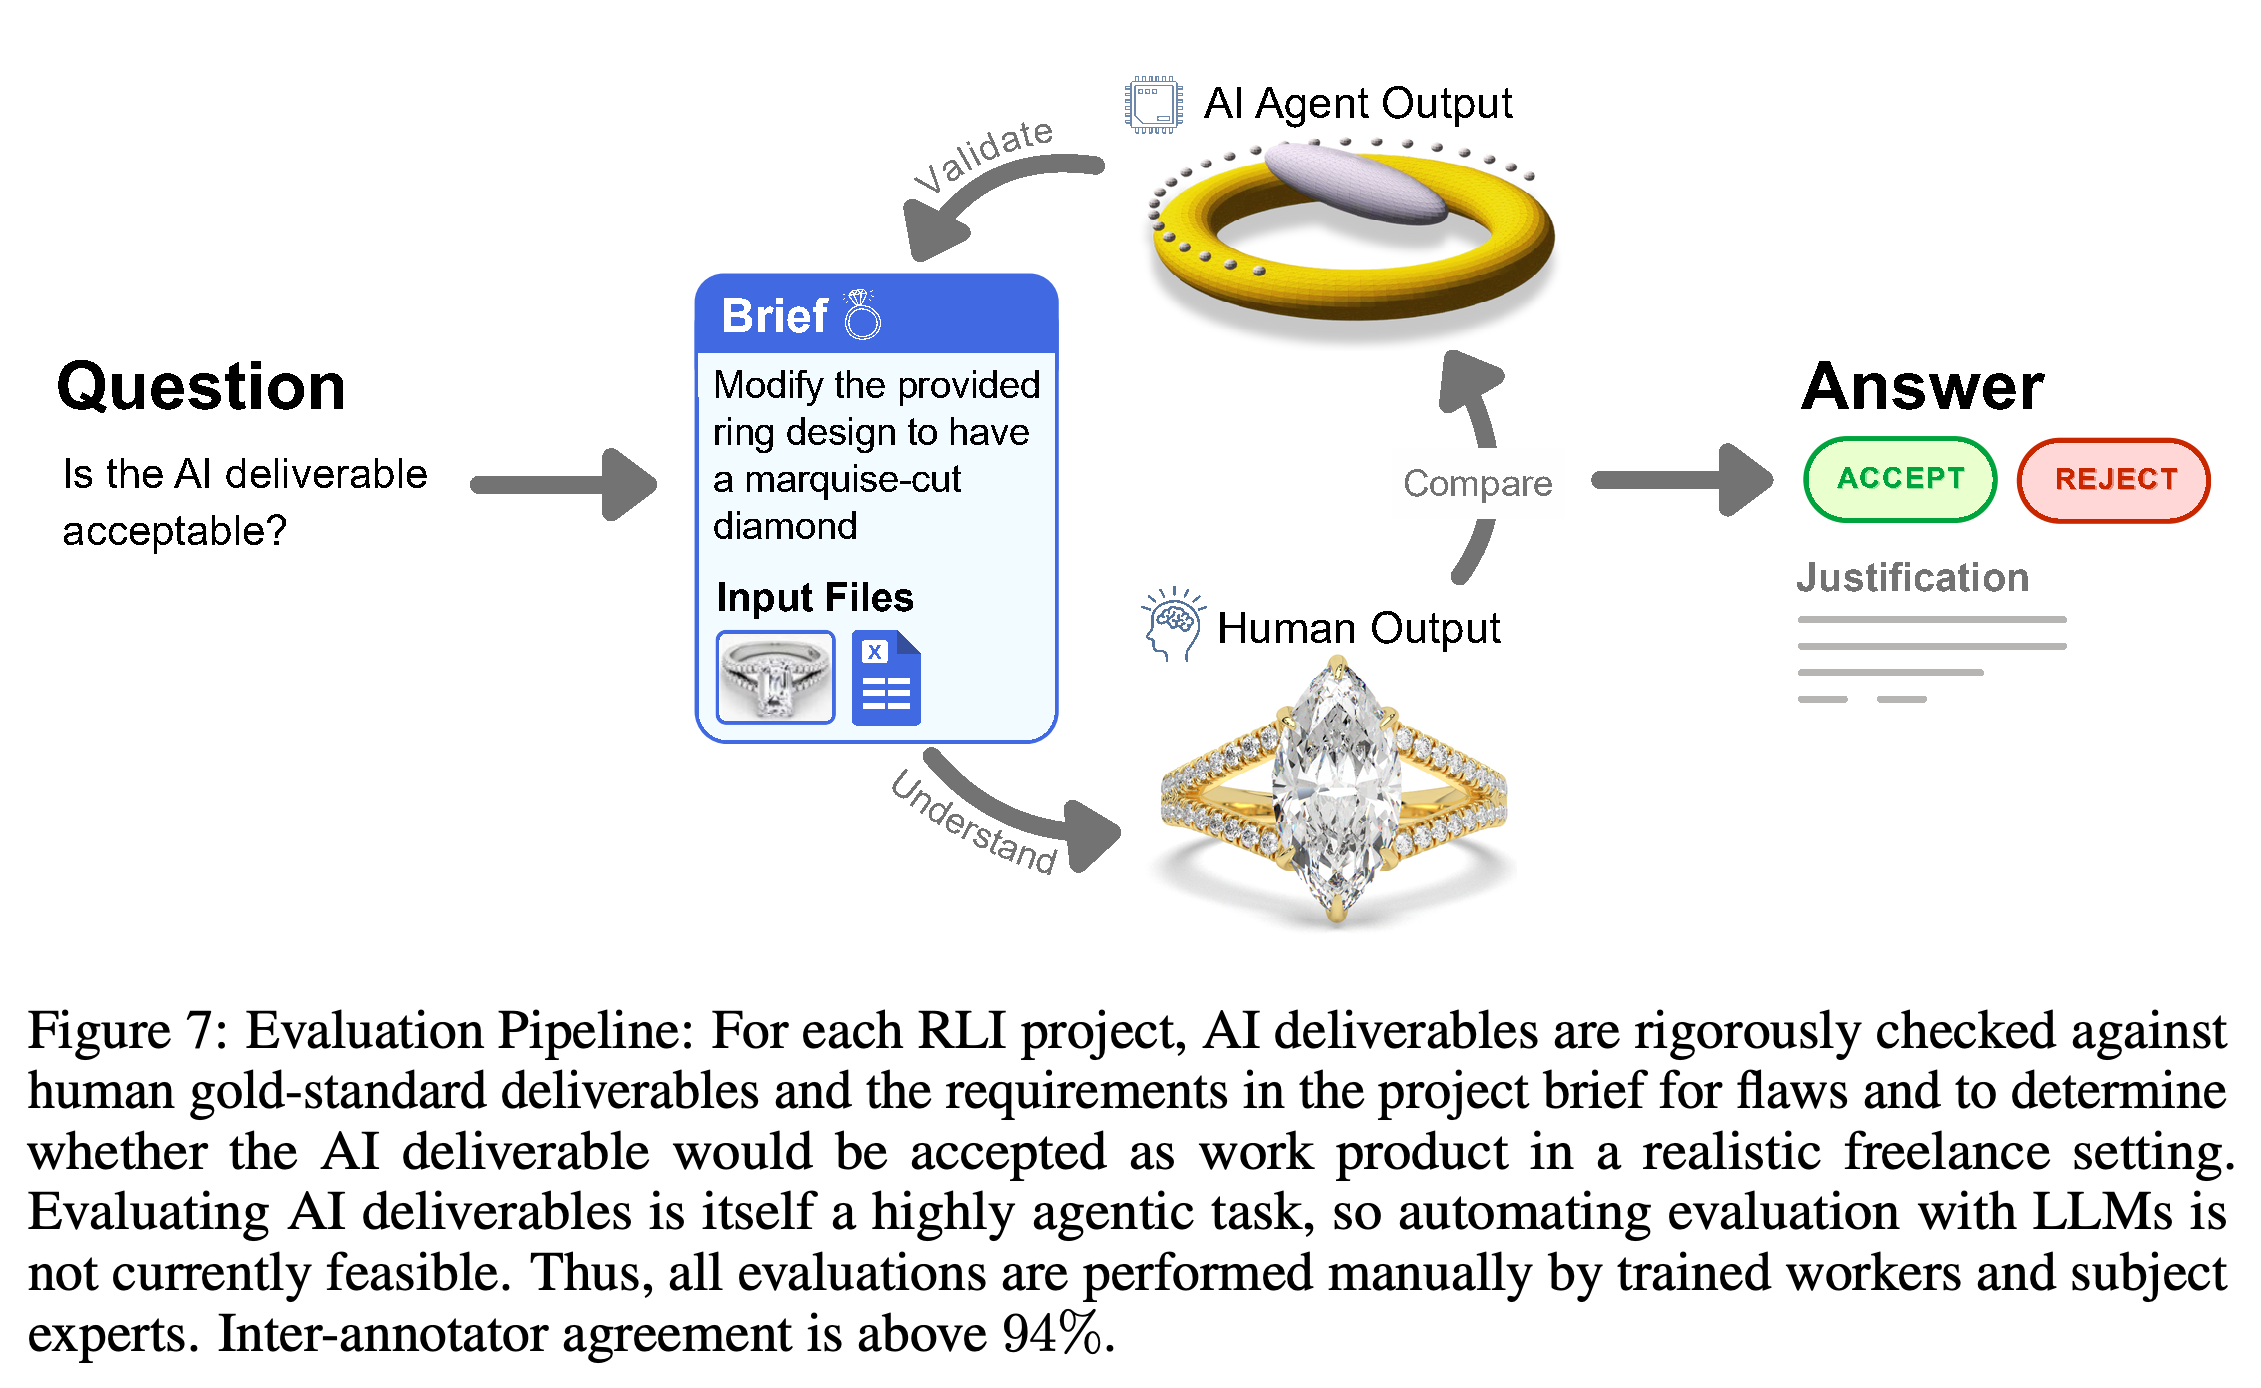
- Figure 7 illustrates acceptance assessment against project requirements and the human reference. Agreement measures reviewer consistency; the separate audit in Appendix B.5 examines evaluation errors.
The ring example separates understanding the brief, comparing against the human reference, and validating the AI artifact. Acceptance depends on satisfying the commissioned design requirements, not merely submitting a viewable model.
4 Experiments
The experiments assess absolute project completion, relative deliverable preferences, economic-value metrics, and qualitative failures. Pairwise preferences distinguish unsuccessful outputs that receive the same failure label under automation rate.
4.1 Experimental Setup
The evaluated systems are ChatGPT agent, GPT-5, Claude Sonnet 4.5, Grok 4, Gemini 2.5 Pro, and Manus. A scaffold, the execution environment and tools surrounding a model, supplies integrated agent capabilities, a computer-use agent (CUA) environment for graphical interaction, or OpenHands with a command-line interface (CLI) for shell-based work.
- The main GPT-5 result uses OpenHands because its CLI condition outperformed its CUA condition. Sonnet 4.5 uses the computer-use scaffold; Grok 4 and Gemini 2.5 Pro use OpenHands.
- The authors tune prompts and provide supported-format instructions. OpenHands also receives gpt-image-1, openai/tts-1, and veo-3.0-generate-preview for image, speech, and video generation.
- Appendix B.6 specifies a default 1-hour computer-use session timeout. Figure 12 reports an average generation cost of $2.34, with all observed runs below $30 in application programming interface (API) costs, charges for model-service calls.
4.2 Quantitative Results
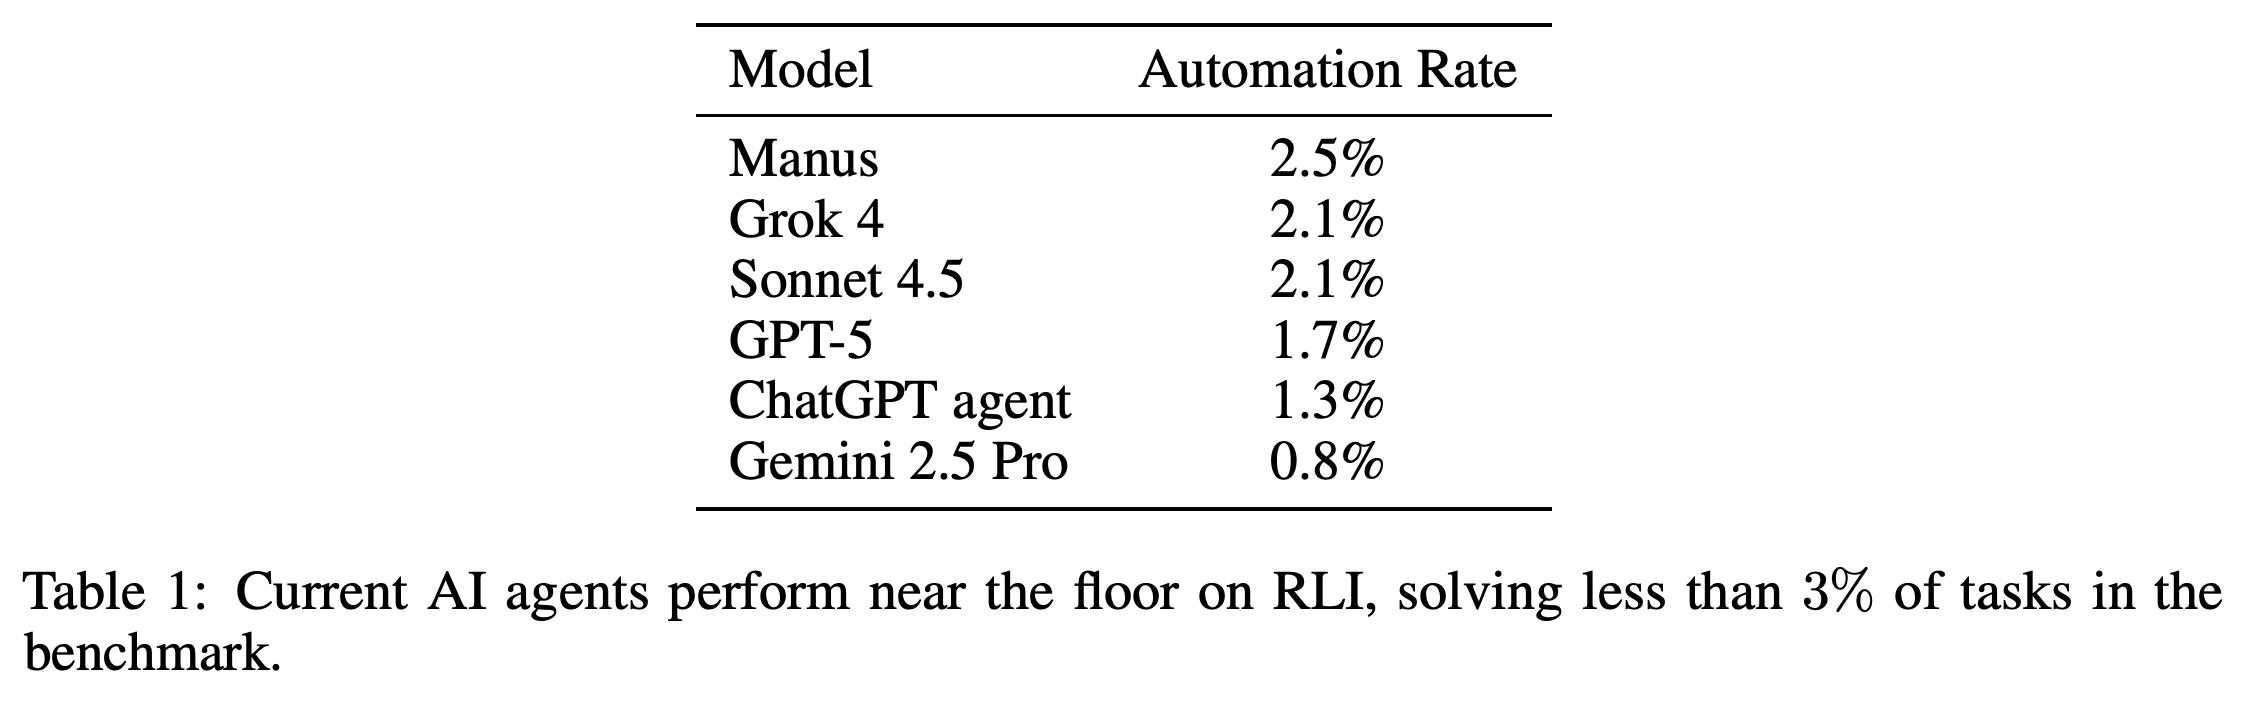
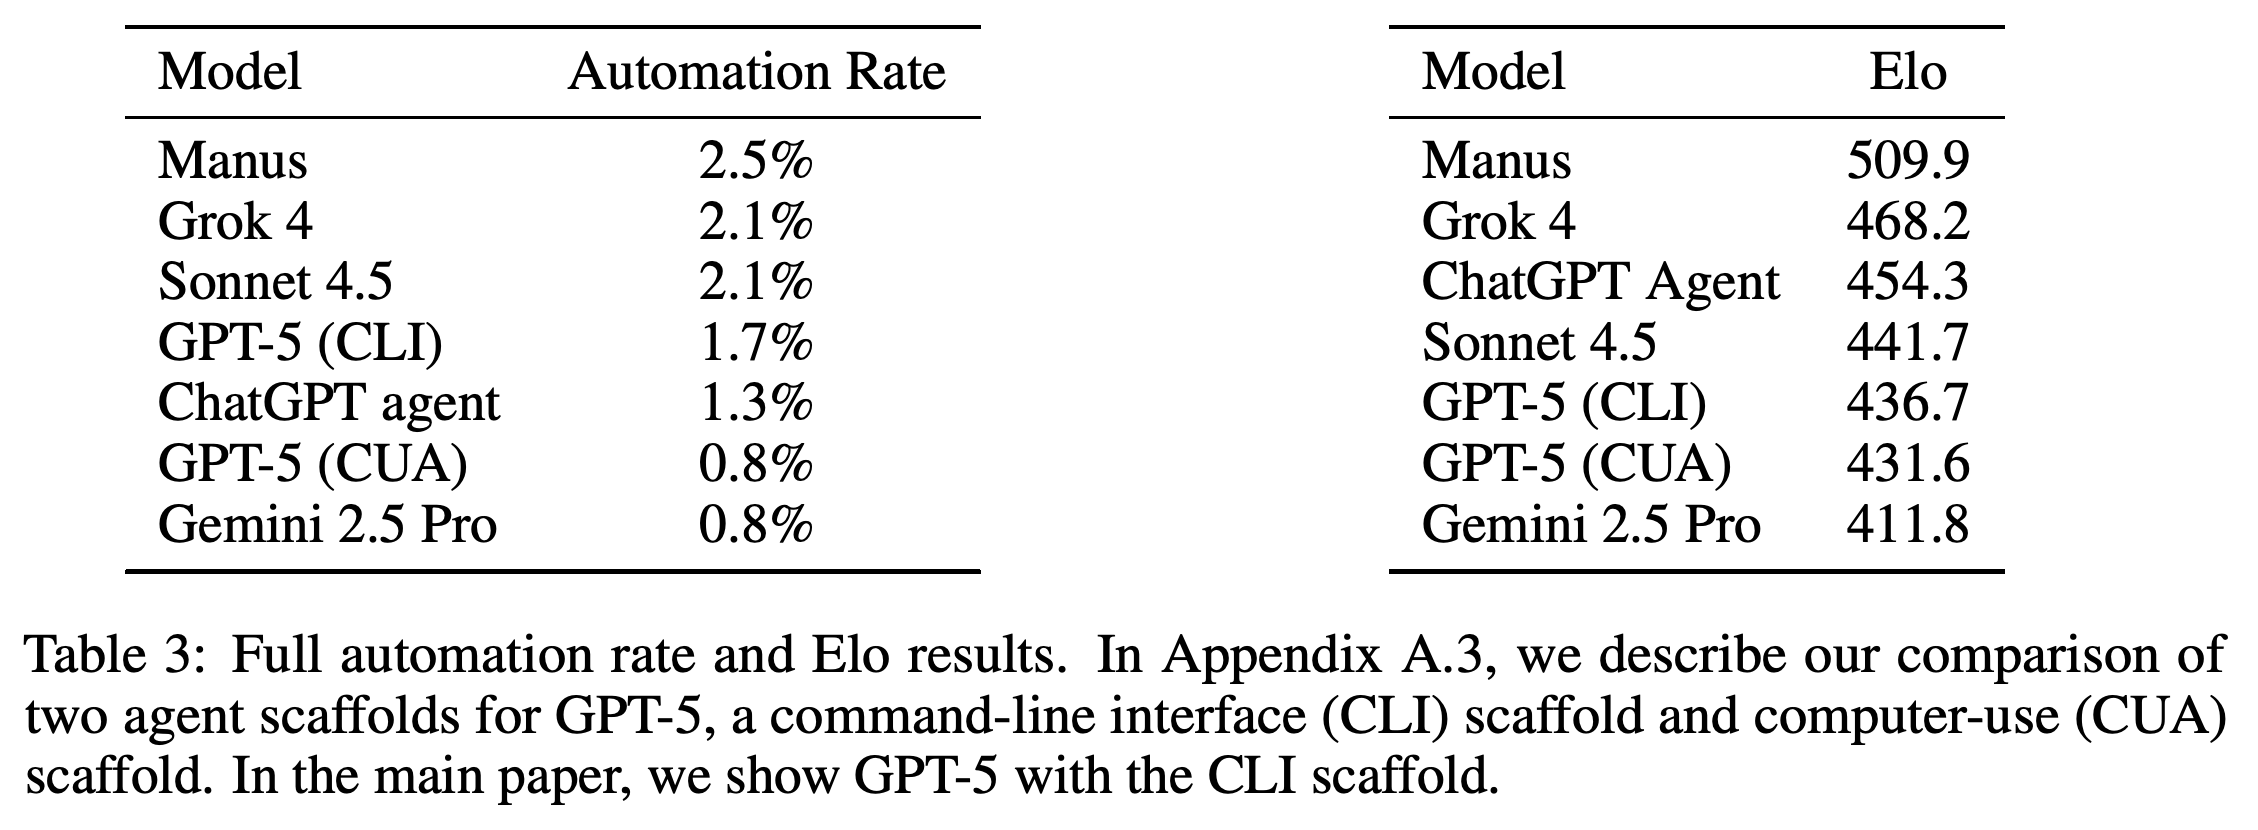
Table 1 reports automation rates of 2.5% for Manus, 2.1% for Grok 4, 2.1% for Sonnet 4.5, 1.7% for GPT-5, 1.3% for ChatGPT agent, and 0.8% for Gemini 2.5 Pro. These are whole-project acceptance rates under the evaluated configurations and human-reference standard.
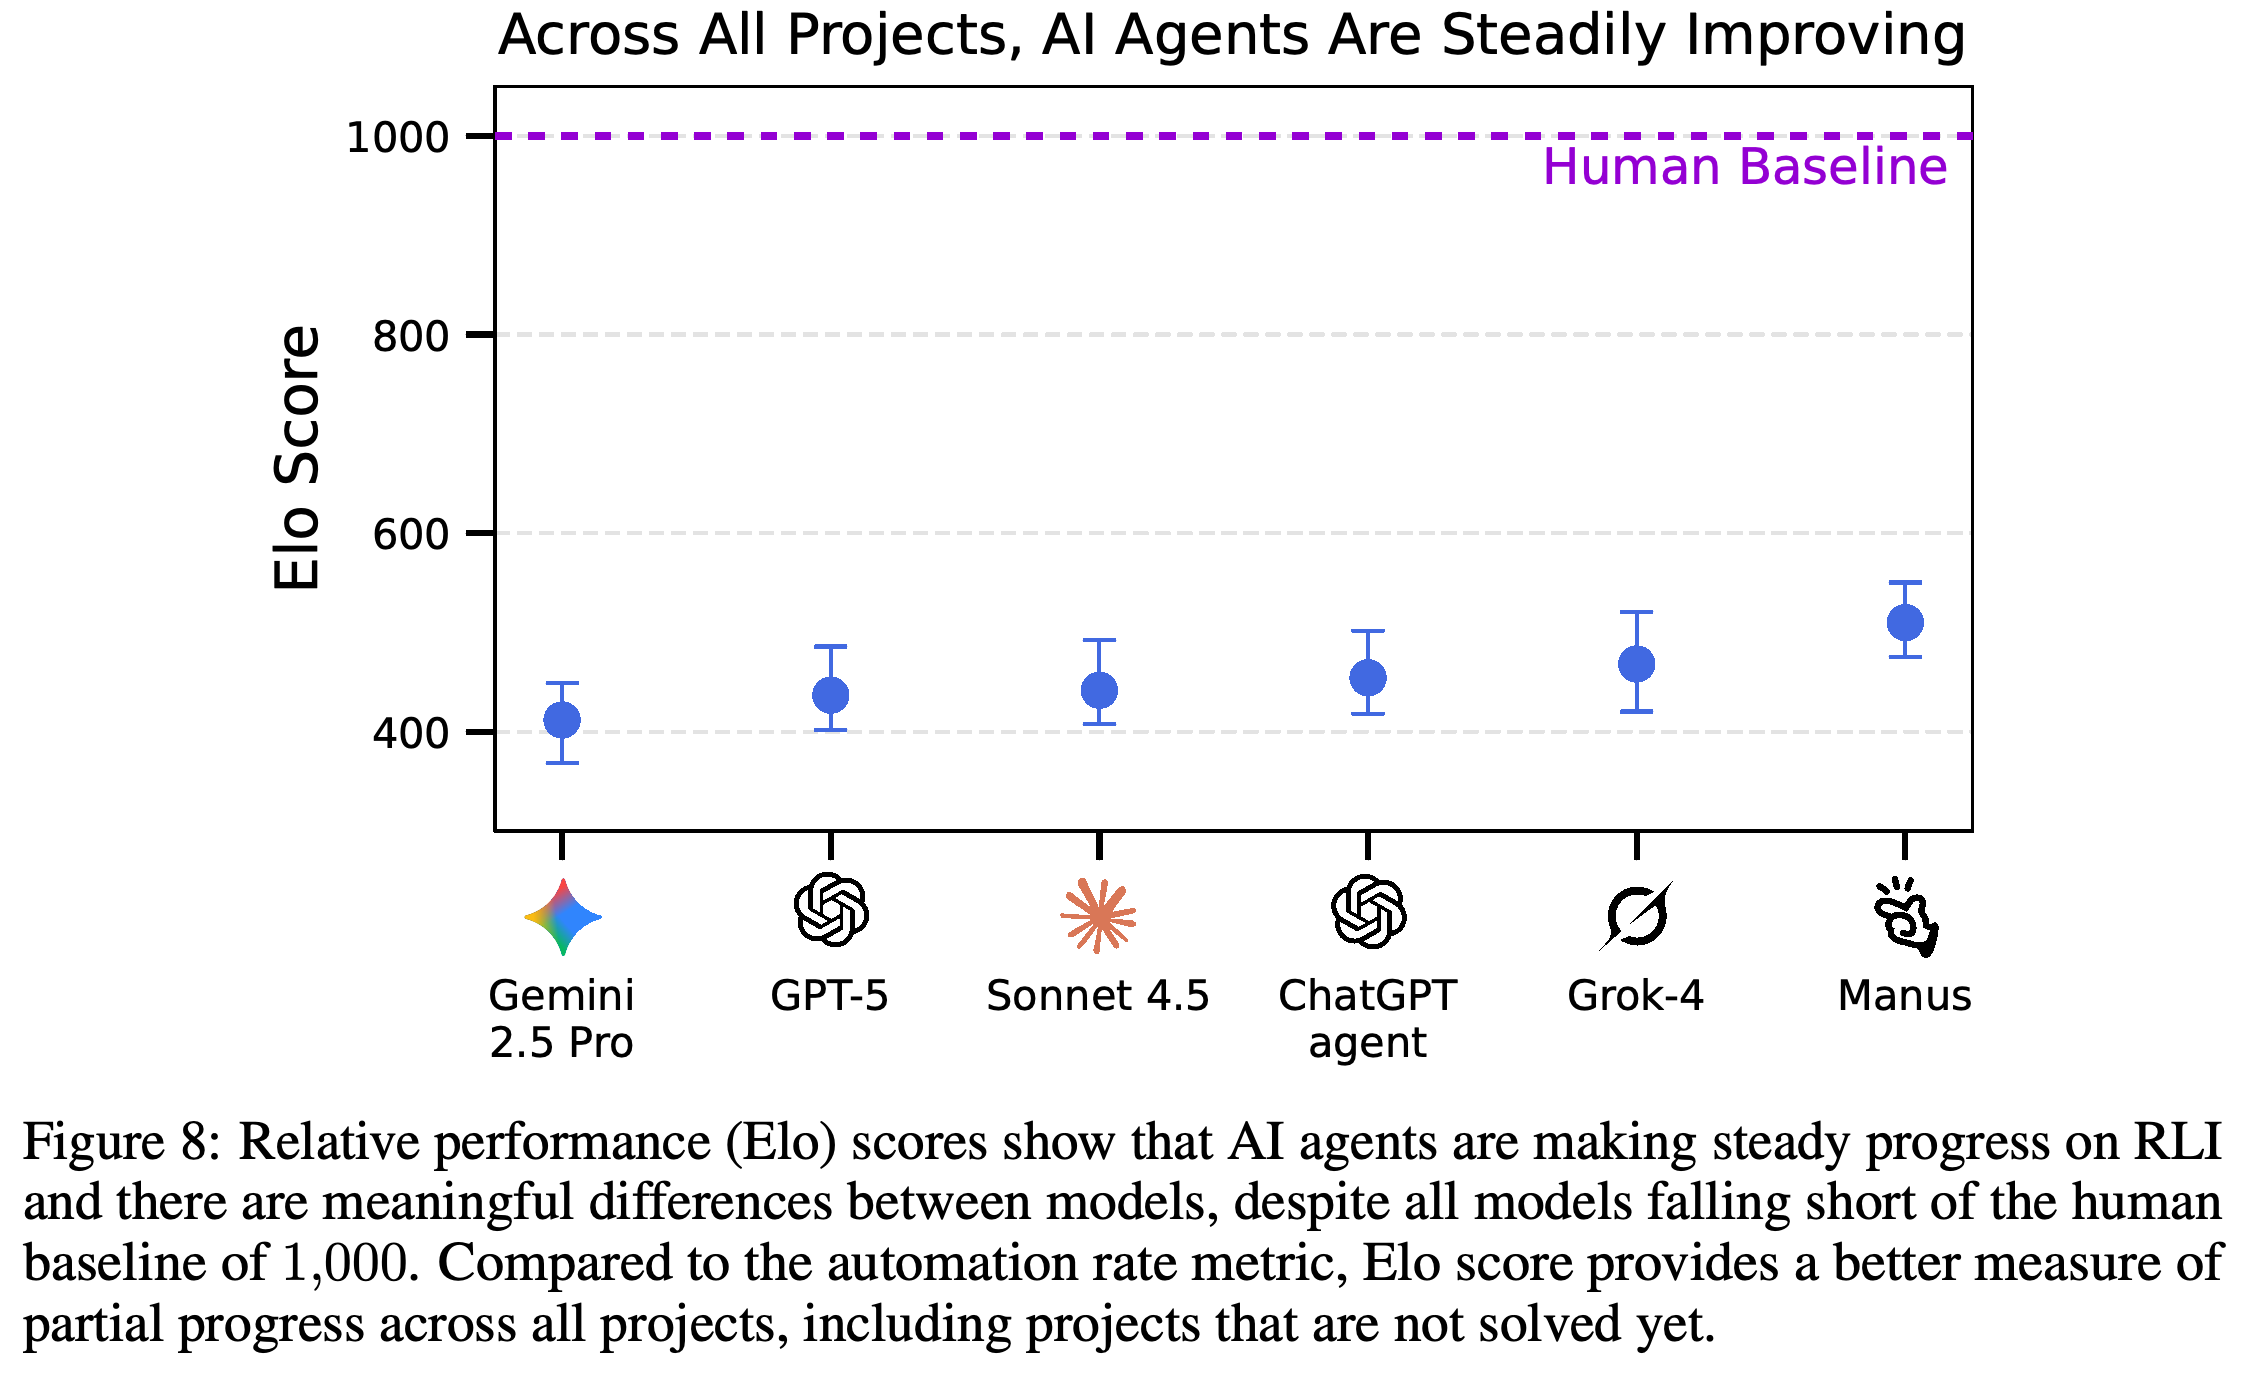
- Figure 8 distinguishes relative performance: Manus scores 509.9, Grok 4 468.2, ChatGPT Agent 454.3, Sonnet 4.5 441.7, GPT-5 (CLI) 436.7, and Gemini 2.5 Pro 411.8, all below the human baseline of 1,000.
- The paper interprets the ranking as evidence of improving capabilities. The reported scores directly compare evaluated systems; they do not constitute repeated measurements of one system under controlled conditions.
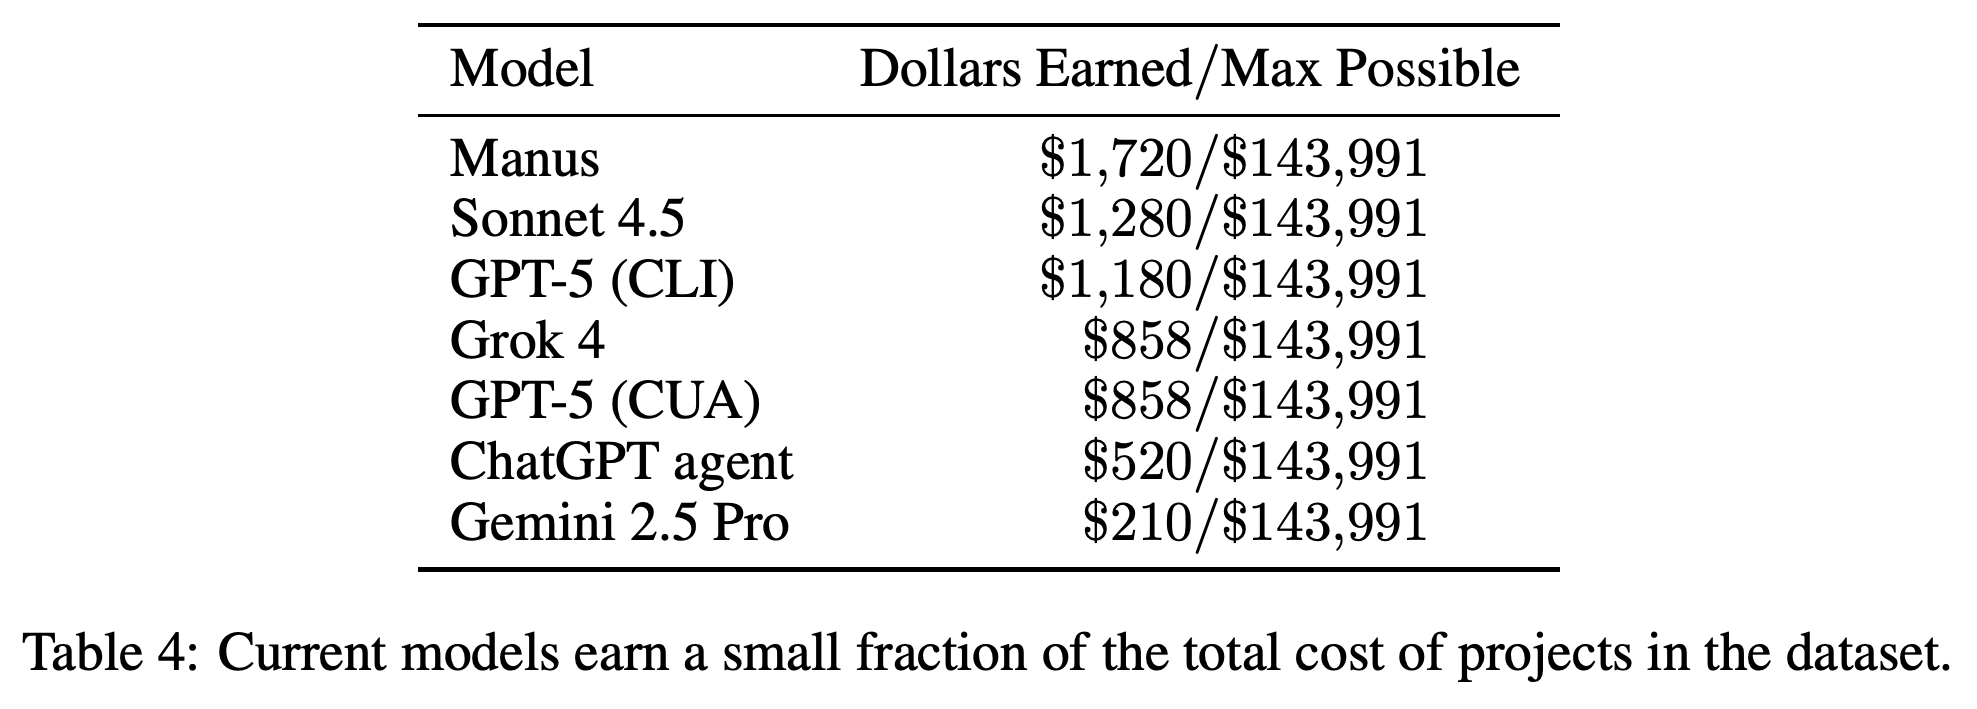
- Economic-value totals are also small: Table 4 assigns Manus $1,720 in accepted-project value against a maximum of $143,991.
Rates range from 0.8% to 2.5%, with Grok 4 and Sonnet 4.5 tied at 2.1%. These values count accepted whole projects and do not quantify useful partial work.
Pairwise preference scores distinguish agents even when few outputs meet the acceptance threshold. Manus leads the plotted ranking, but all scores and displayed 95% confidence intervals remain below the normalized human baseline of 1,000; the horizontal axis compares systems rather than dates.
GPT-5 achieves 1.7% automation and 436.7 Elo with CLI, versus 0.8% and 431.6 with CUA. ChatGPT agent ranks above Sonnet 4.5 and GPT-5 in Elo despite a lower automation rate, showing that accepted-project counts and relative preferences can rank systems differently.
Manus has the highest accepted-project value at $1,720, far below the $143,991 maximum. Grok 4 and Sonnet 4.5 share an automation rate but have different dollar totals because accepted projects differ in reported value.
4.3 Qualitative Findings
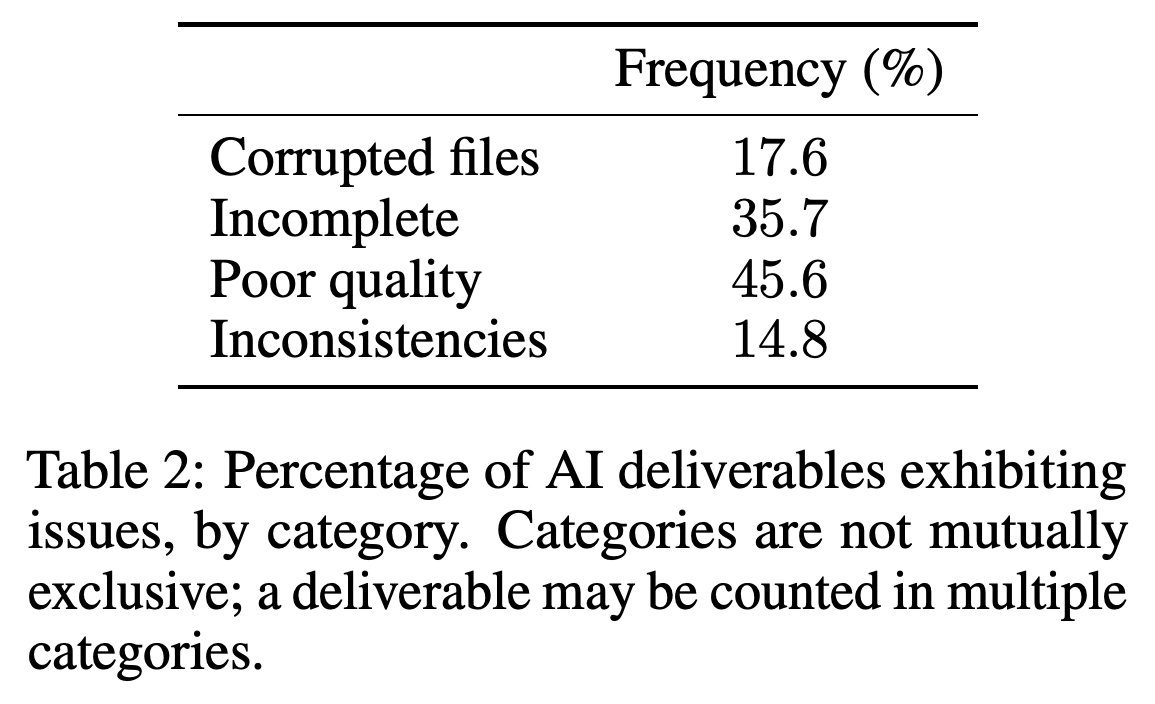
Clustering evaluator justifications from roughly 400 evaluations yields four recurring failure categories. Table 2 reports corrupted files in 17.6% of deliverables, incomplete work in 35.7%, poor quality in 45.6%, and inconsistencies in 14.8%; a deliverable can appear in multiple categories.
- Examples include empty or unusable files, missing assets, videos lasting 8 seconds when 8 minutes were requested, unnatural voice-overs, floor plans inconsistent with supplied sketches, and visual differences across views of the same object.
- The authors attribute many failures to difficulty checking and repairing outputs, particularly when verification requires interactive audiovisual inspection. This explanation comes from qualitative analysis rather than an experiment isolating its causal effect.
Poor quality is the most frequent labeled issue at 45.6%, followed by incompleteness at 35.7%. Multiple labels can apply to one deliverable, so these percentages cannot be summed into a total failure rate.
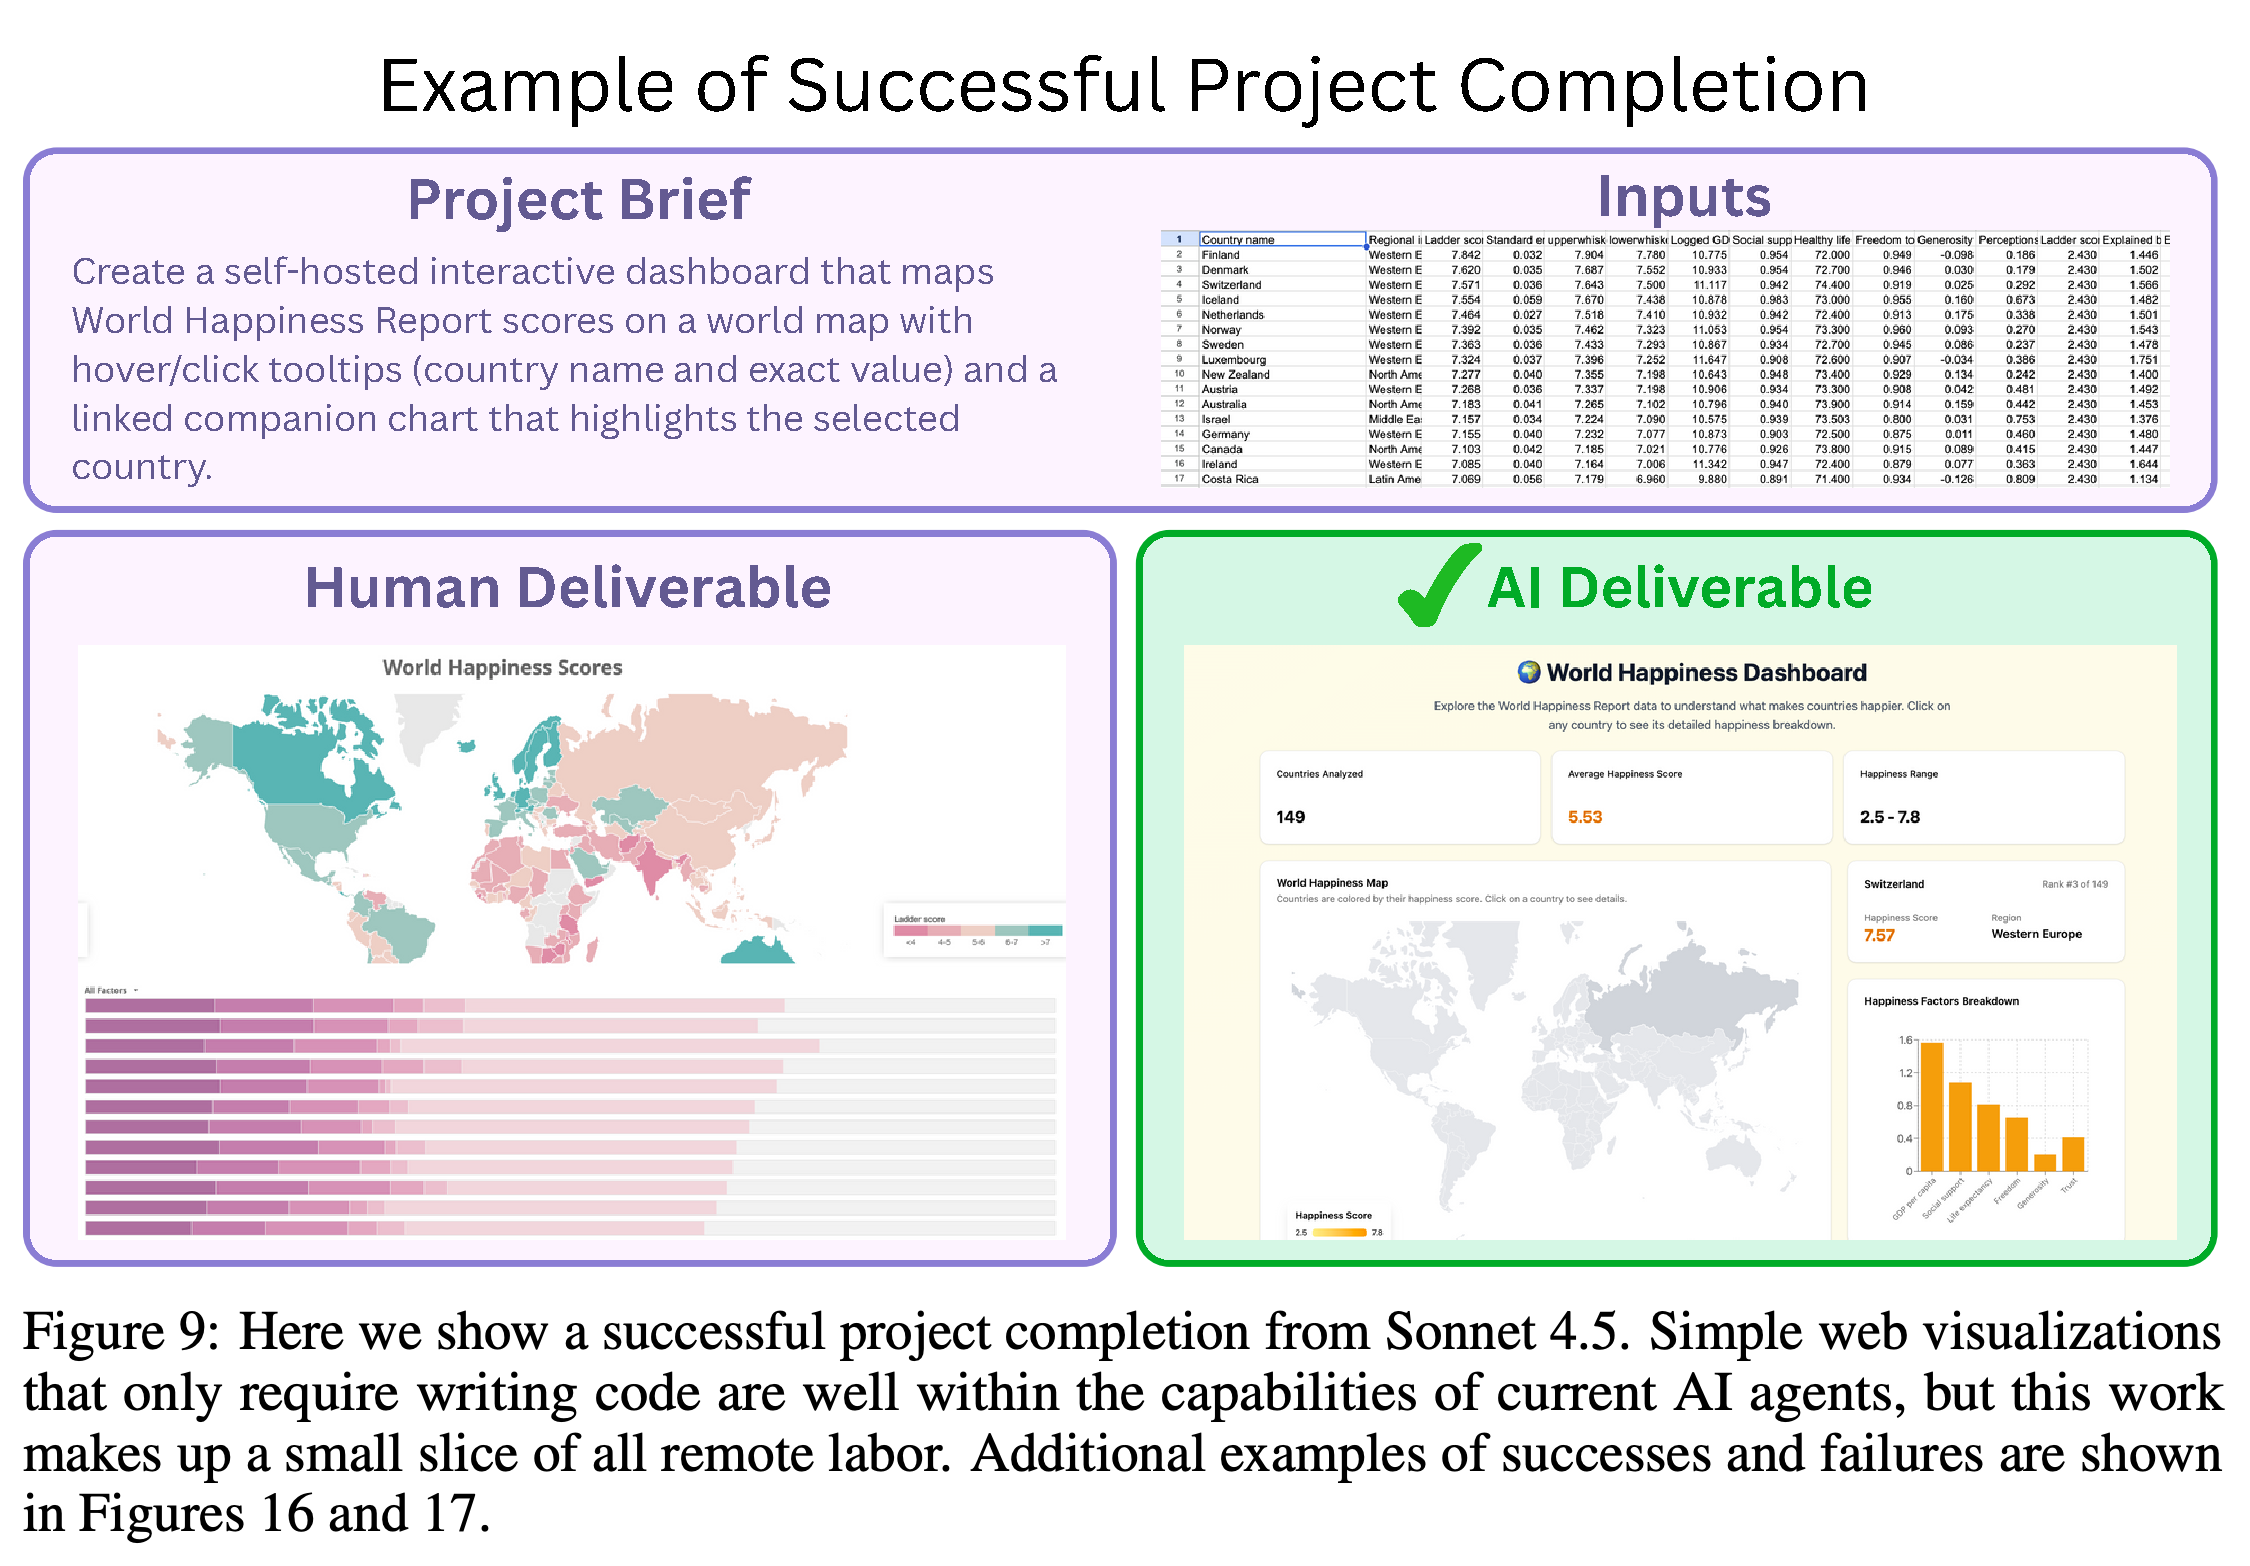
Accepted outputs include audio editing and mixing, image-based advertisements and logos, report writing, data retrieval, and code for interactive visualizations. Figure 9 shows an accepted Sonnet 4.5 World Happiness Report dashboard; Figures 16 and 17 show accepted Manus advertisements and rejected animation and product-demonstration projects.
- The paper describes successes in particular workflows but does not provide category-specific success rates sufficient to rank domains reliably.
- The dashboard brief requires linked map and chart interactions, illustrating that project acceptance can include functional behavior as well as appearance.
The figure places the supplied data and dashboard requirements above the professional reference and accepted Sonnet 4.5 output. It illustrates one successful interactive coding project without establishing a general success rate for visualization work.
5 Discussion
The discussion proposes that general cognitive abilities could allow AI to automate newly emerging jobs. The reported experiments assess existing projects and do not directly test this proposed generalization to future work.
- RLI excludes necessary client interaction, teamwork, delayed outcome assessment, and outputs unsuitable for its web viewer. Even a 100% automation rate would leave these activities untested.
- Human project costs are historical and unadjusted for inflation; most projects with known completion dates were completed within the preceding five years.
- Appendix C.2 excludes Content Writing and related categories because many such projects were already solvable by AI. This category selection affects interpretation of the aggregate automation rate.
6 Conclusion
The paper presents 240 projects across 23 digital freelance work categories as an economically grounded measure of autonomous project completion. Automation rates below 3% document a large acceptance gap between the evaluated agents and professional references on RLI, while pairwise preference scores distinguish partial completion and quality.
Appendix
- A Additional Results, A.1 Full Results: Table 3 includes GPT-5 (CUA), with a 0.8% automation rate and Elo of 431.6, alongside the main configurations. Table 4 reports accepted-project values of Manus $1,720, Sonnet 4.5 $1,280, GPT-5 (CLI) $1,180, Grok 4 $858, GPT-5 (CUA) $858, ChatGPT agent $520, and Gemini 2.5 Pro $210, each against $143,991 maximum possible value.
- A.2 Autoflation: Figure 10 tracks the effective cost reduction for the fixed project bundle as evaluated systems become available, choosing AI only when it completes a project acceptably at lower cost than the human reference. The authors audit successful outputs because false-positive acceptance, incorrectly accepting unsuccessful work, can distort this metric. A.3 Effect of Agent Scaffolds: GPT-5 (CLI) achieves 436.7 Elo and 1.7% automation, compared with 431.6 and 0.8% for GPT-5 (CUA); this establishes a configuration difference for the tested GPT-5 setups.
- B Evaluation Details, B.1 Model Details: Most Manus deliverables were generated in June 2025, with some generated in September 2025; Gemini evaluation uses Gemini 2.5 Pro. B.2 Elo Computation: Randomized ordering and stratified sampling ensure each model pair is compared on at least 10 projects, with a median of 25, and preferences are combined with model-versus-human evaluations. Bradley-Terry fitting, a model of pairwise preference probabilities, produces the scores; 100 project-level bootstrap samples, resampled project sets, produce the 95% confidence intervals in Figure 8.
- B.3 Evaluation and Generation Budgets: Reviews use soft limits of 20 minutes for automation rate and 30 minutes for Elo; Figure 11 reports mean durations of 11.4 and 17.4 minutes, with some reviews exceeding those limits. B.4 Evaluation Instructions: Training emphasizes the reasonable-client perspective, the human reference’s zone of acceptable error, tolerance for its minor flaws or non-critical omissions, and common AI failures. Instructions and reviewer quality were refined to reach at least 85% agreement on a random subset, with final automation-rate agreement of 94.4%.
- B.5 Evaluation verification: The authors manually audit every case labeled equal to or better than the human reference. Two co-authors also review human-versus-model pairs from 50 random projects and find no false negatives, incorrectly rejecting acceptable AI work, yielding a reported false-negative-rate bound of ≤5.8% with 95% confidence. Finding no errors in this sample does not establish their absence across the full benchmark.
- B.6 Agent Setup: Integrated agents, the computer-use environment, and OpenHands receive briefs, input files, and supported-output specifications. OpenHands includes image, speech, and video tools; the computer-use setup includes mouse, keyboard, screenshot, file-editing, and shell tools, with a default 1-hour session timeout. Sonnet 4.5 additionally receives output-verification instructions and context management exceeding 1M tokens, units of model input and output text; Figure 12 reports generation costs with mean $2.34, median $0.92, minimum $0.03, and maximum $29.51.
- B.7 Evaluation Platform Details: The open-source viewer supports documents, spreadsheets, Office files, images, audio, video, design files, three-dimensional models, databases, interactive websites, and Anki flashcard packages, with format-specific limitations. Fewer than 20 projects have evaluator notes, sometimes specifying that extra features in the human reference fall outside the brief and should be ignored. Figure 13 shows the brief, file directories, and side-by-side interactive ring models.
- C Dataset Details, C.1 Categorization: Upwork’s taxonomy contains 12 major categories and 64 subcategories; the final dataset covers 9 major categories and 23 subcategories. The authors prefer it to O*NET, a US taxonomy of occupational requirements and work activities, because long-term occupational responsibilities and generic activity labels are less suited to classifying complete freelance projects. Figure 14 compares RLI’s file counts and format diversity with GDPval.
- C.2 Filtering & Cleaning Criteria: Eligible work must be remote, self-contained, independently executable, immediately evaluable, and viewable in the platform, without necessary client or live-service interaction; unauthorized scraping and certain work categories are excluded. Cleaning checks completeness, anonymization, acceptable human references, input quality, fidelity to original requests, standardized briefs, and viewability. The appendix reports 45 eligible sourcing categories, whereas Section 3.2 reports 43; the supplied version does not reconcile these counts.
- C.3 Analysis Details: Completion-time comparisons use published GDPval and HCAST data and 275 completed Upwork jobs from a random sample of 60 freelancers. A judge large language model (LLM), a language model used to classify text, assigns RLI and GDPval briefs to software, research and writing, or other; HCAST is classified manually, while the Upwork type estimate classifies taxonomy category names. The appendix explicitly states that this estimate is not a job-level distribution, which would be more skewed toward software tasks.
- C.4 Data Collection Details: Freelancers verify their rights to sell work, identifying or copyrighted material is redacted or replaced, and additional examples are purchased or used with author permission. C.5 Project cost and completion time.: Professionals self-report costs in US dollars (USD) and hours, using midpoint values for ranges; costs are available for 95% of projects, times for 84%, and 5% have neither. Metrics omit projects missing required values; Figure 15 reports a Pearson correlation, a measure of linear association, of 0.785 between logarithmic cost and completion time.
- C.6 AI Deliverable Examples: Figure 16 shows accepted Manus Halloween advertisements, and Figure 17 shows rejected Gemini 2.5 Pro explanatory animation and GPT-5 earbud demonstrations. C.7 Detailed Project Examples: Figures 18 and 19 present extended briefs for earbud animations and models, interior design and furniture layouts, a Mega-Merge web game, and a World Happiness Index dashboard. Requirements include five earbud clips plus models, three bathroom design options, six furniture layouts, and a total game file size under 5 MB.
Brief Thoughts
The professional references make project acceptance concrete: reviewers can identify missing artifacts, unusable files, and quality failures that a working demonstration may conceal. These observed failures support prioritizing artifact inspection and output verification in agent engineering.
The 2.5% result measures performance on RLI under the tested configurations. Category exclusions, private test data, differing tools and prompts, historical self-reported costs, and the absence of experiments varying generation budgets constrain broader claims about deployment performance and economic substitution.