


Towards a Science of Scaling Agent Systems | Summary
09 Dec 2025 | Paper Review Multi-Agent Coordination LLM Agents Scaling LawsContents
This article explains the key points of Towards a Science of Scaling Agent Systems.
- 2025-12-09 (arXiv)
- Kim, Yubin, Gu, Ken, Park, Chanwoo, Park, Chunjong, Schmidgall, Samuel, Heydari, A. Ali, Yan, Yao, Zhang, Zhihan, Zhuang, Yuchen, Liu, Yun, et al.
- Google Research, Google DeepMind, Massachusetts Institute of Technology
- Paper
Summary
- Towards a Science of Scaling Agent Systems examines when adding language-model agents, systems that reason and act using environmental feedback, improves performance on interactive tasks. With shared prompts, tools, and computational budgets, Centralized coordination, where an orchestrator delegates and checks work, improves financial analysis on Finance Agent by +80.8% relative to a single agent, while Independent coordination, where isolated outputs are combined without verification, reduces sequential Minecraft planning on PlanCraft by −70.0%.
- The study evaluates 260 configurations across six interactive benchmarks, five coordination architectures, and three large language model (LLM) families. Its regression achieves cross-validated R² = 0.373, a measure of predictive fit on held-out configurations, increasing to 0.413 with the Agentic Capability Index (ACI), each model’s mean single-agent performance across the six benchmarks.
- The authors identify capability saturation, diminishing collaboration gains as single-agent performance rises, as their most consistently supported pattern and propose an approximate 45% baseline threshold. Tool-related coordination penalties and architecture-dependent error propagation are additional observations, but several associated regression effects lose significance when dependence among configurations within benchmarks is accounted for.
- Architecture selection reaches 87% accuracy on held-out configurations within the evaluated task regimes, compared with 20% for random selection and 54% for capability-only models. This result does not establish reliable selection for unseen models: the appendix reports that the equation incorrectly selects Hybrid, an architecture combining an orchestrator with peer communication, for all three held-out frontier models on BrowseComp-Plus, a web information-retrieval benchmark.
- The results support evaluating task decomposability, the extent to which work can be divided into parallel subtasks, alongside baseline performance and coordination cost before expanding an agent team. The evidence is limited by six benchmark domains, 20-instance software and terminal subsets, shared rather than individually optimized prompts, and preliminary team-size and model-mixing experiments.
1. Introduction
The introduction identifies two obstacles to understanding agent scaling: comparisons often vary prompts, tools, or compute alongside architecture, and final accuracy conceals coordination costs and error propagation. A Single-Agent System (SAS) maintains one sequential reasoning loop; a Multi-Agent System (MAS) distributes work across multiple agents, allowing parallel exploration and verification while dividing context across agents and requiring message exchange.
- The paper emphasizes tasks requiring repeated observations and actions. Benefits from voting on isolated answers need not carry over when agents acquire different information and mistakes affect subsequent execution.
- The contribution is a controlled architectural comparison and an empirical performance model. Its architecture-selection evidence is strongest within known task regimes; absolute prediction across unseen domains remains limited.
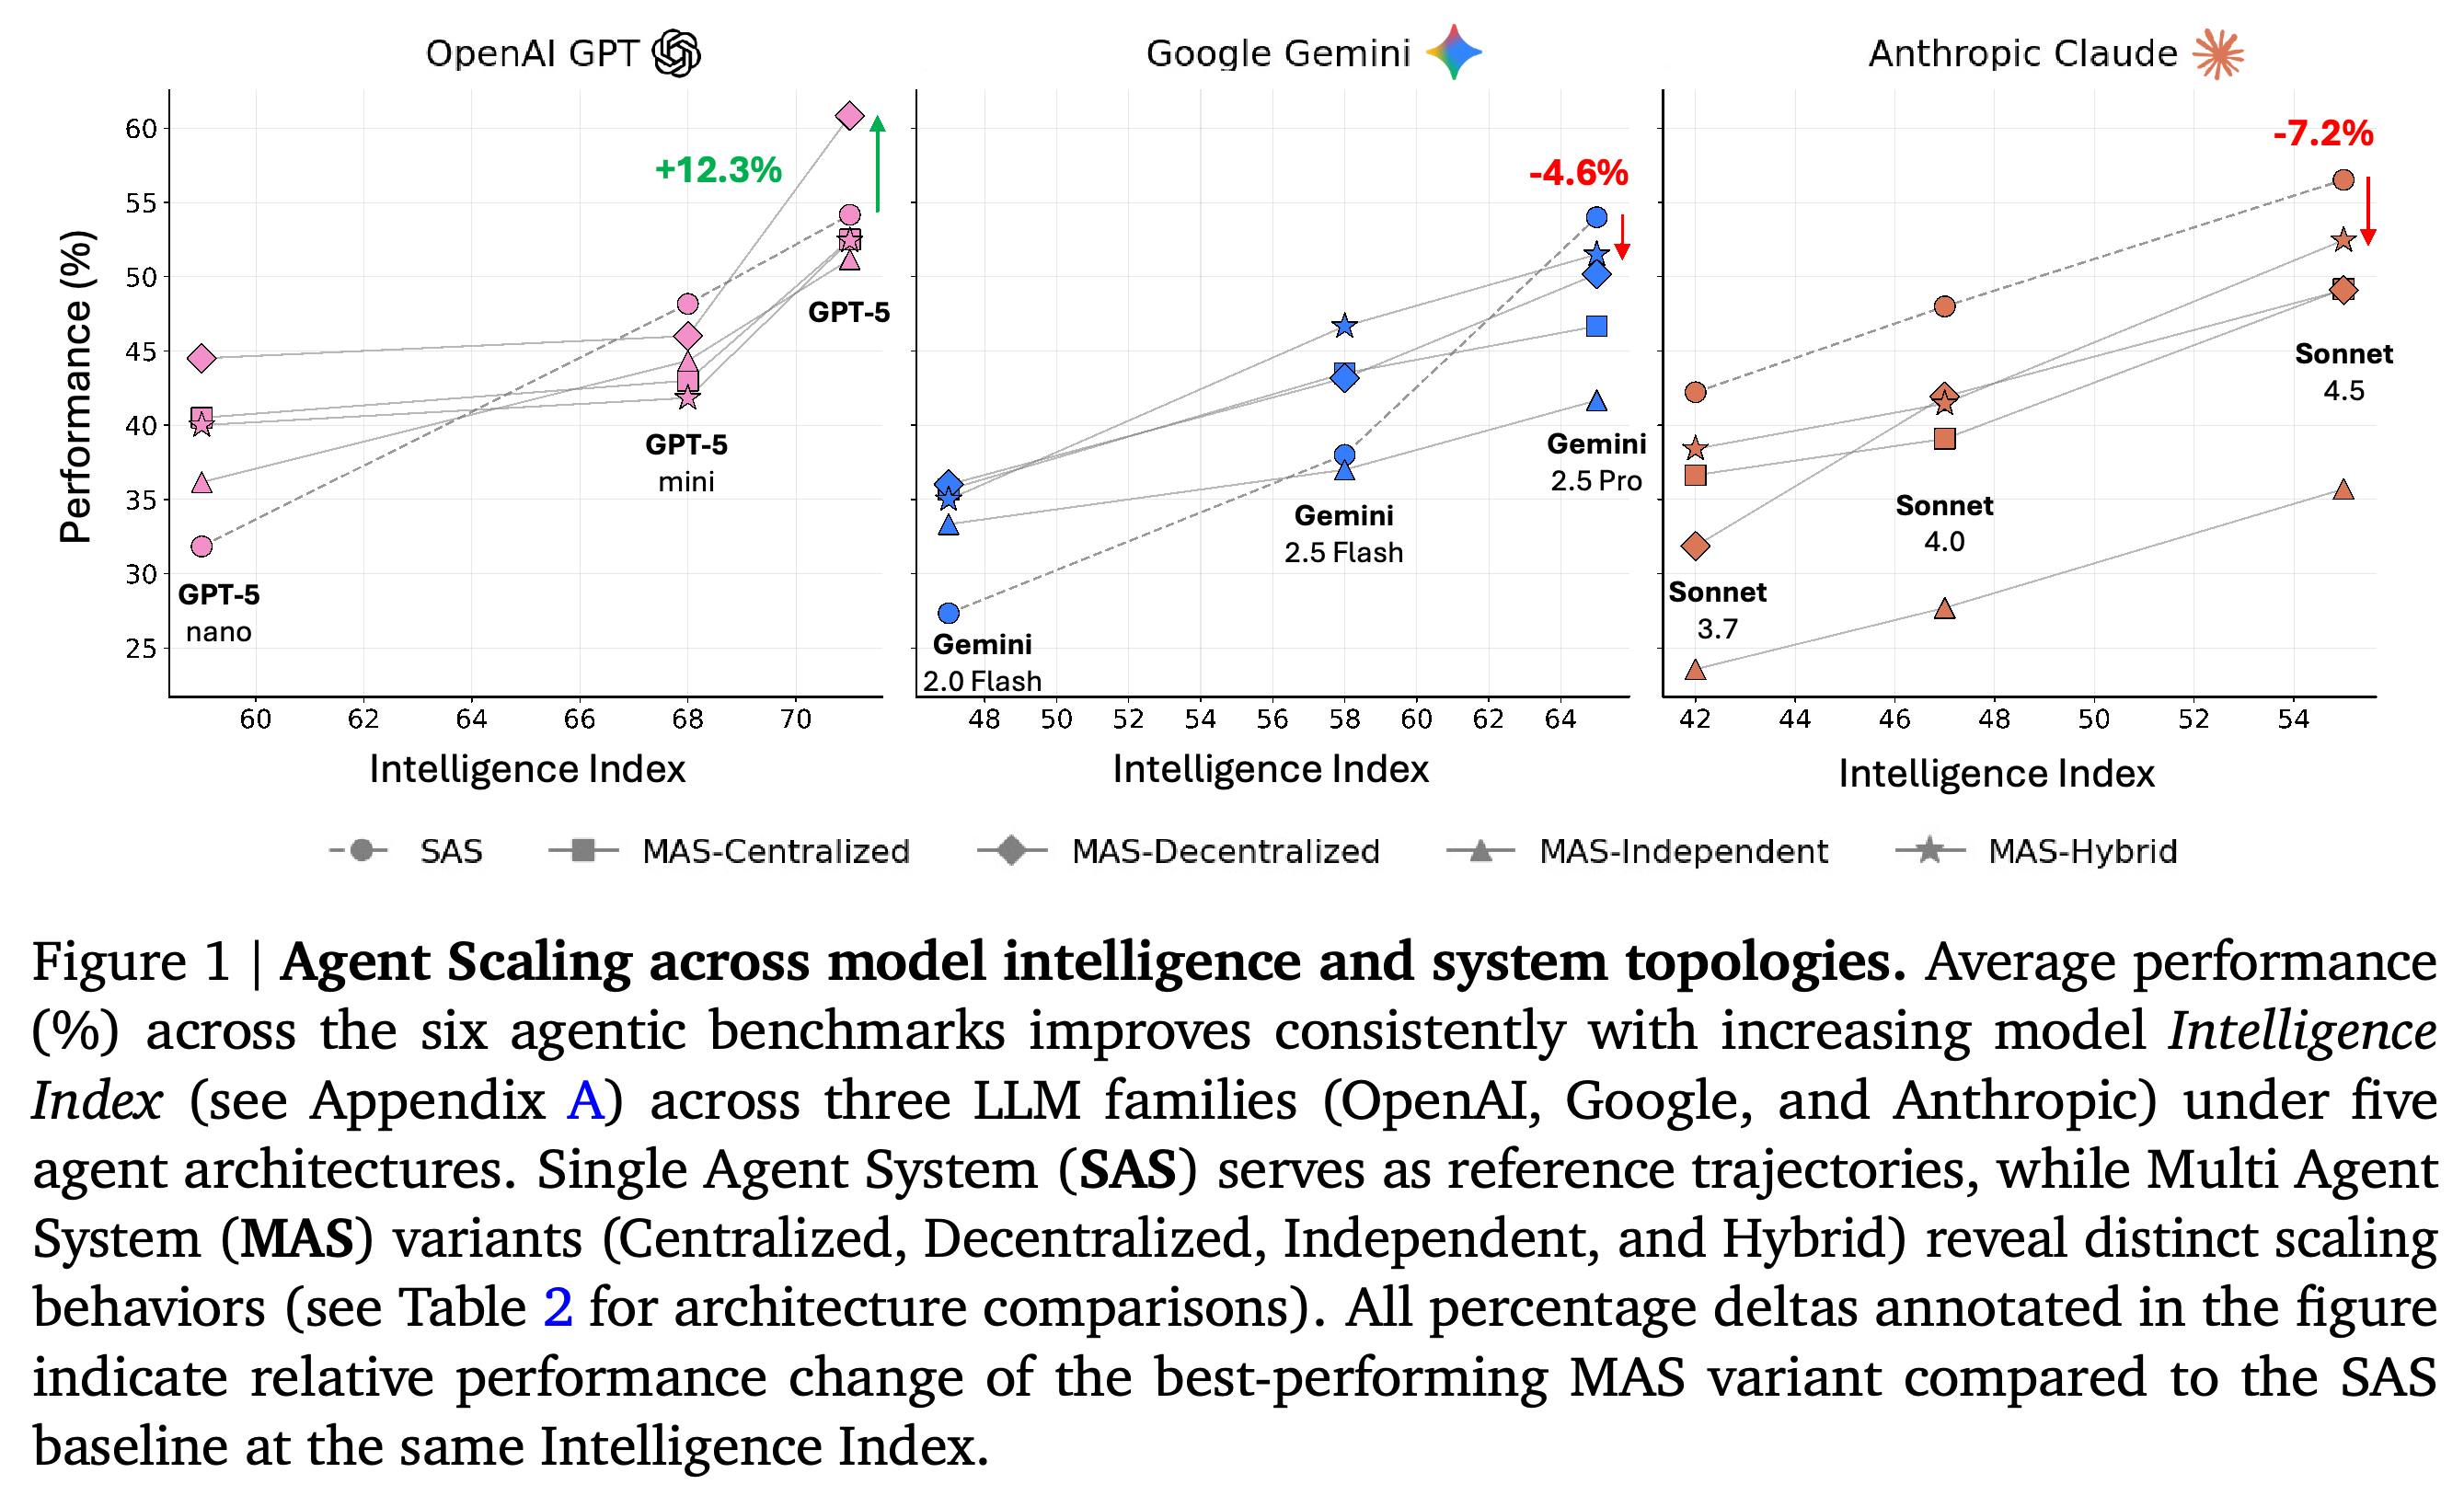
Higher Intelligence Index generally accompanies higher average task performance within each family, but collaboration’s advantage varies. At the strongest displayed model in each family, the best MAS changes performance by +12.3% for OpenAI, −4.6% for Google, and −7.2% for Anthropic relative to SAS at the same Intelligence Index.
2. Related Work
Related work covers single-agent and multi-agent designs, interactive benchmarks, and collaborative scaling, changes in performance as agent interactions or team size increase. The authors distinguish their contribution from earlier benchmark definitions by applying shared evaluation controls across coordination structures and model capabilities.
- Prior studies cited in the paper report diminishing benefits as base models improve, coordination failures, and substantial token costs. These motivate evaluating task structure and operational cost alongside accuracy.
- Neural scaling laws describe relationships between model performance and resources such as parameters and training compute. They do not directly establish how inference-time collaboration among agents should scale.
3. Agent Systems and Tasks
This section defines agent systems and the interactive task properties used to select benchmarks. The comparison varies communication topology, the pattern of information exchange, and orchestration policy, the rules directing and combining agent activity.
3.1. System Definition
An agent system is defined as S = (A, E, C, Ω), comprising agents, a shared environment, communication topology, and orchestration policy. Each agent has a reasoning policy, tool-action space, internal memory, and a decision function mapping its observation history to its next action; histories append action–observation pairs and undergo context truncation at MAX_TOKENS.
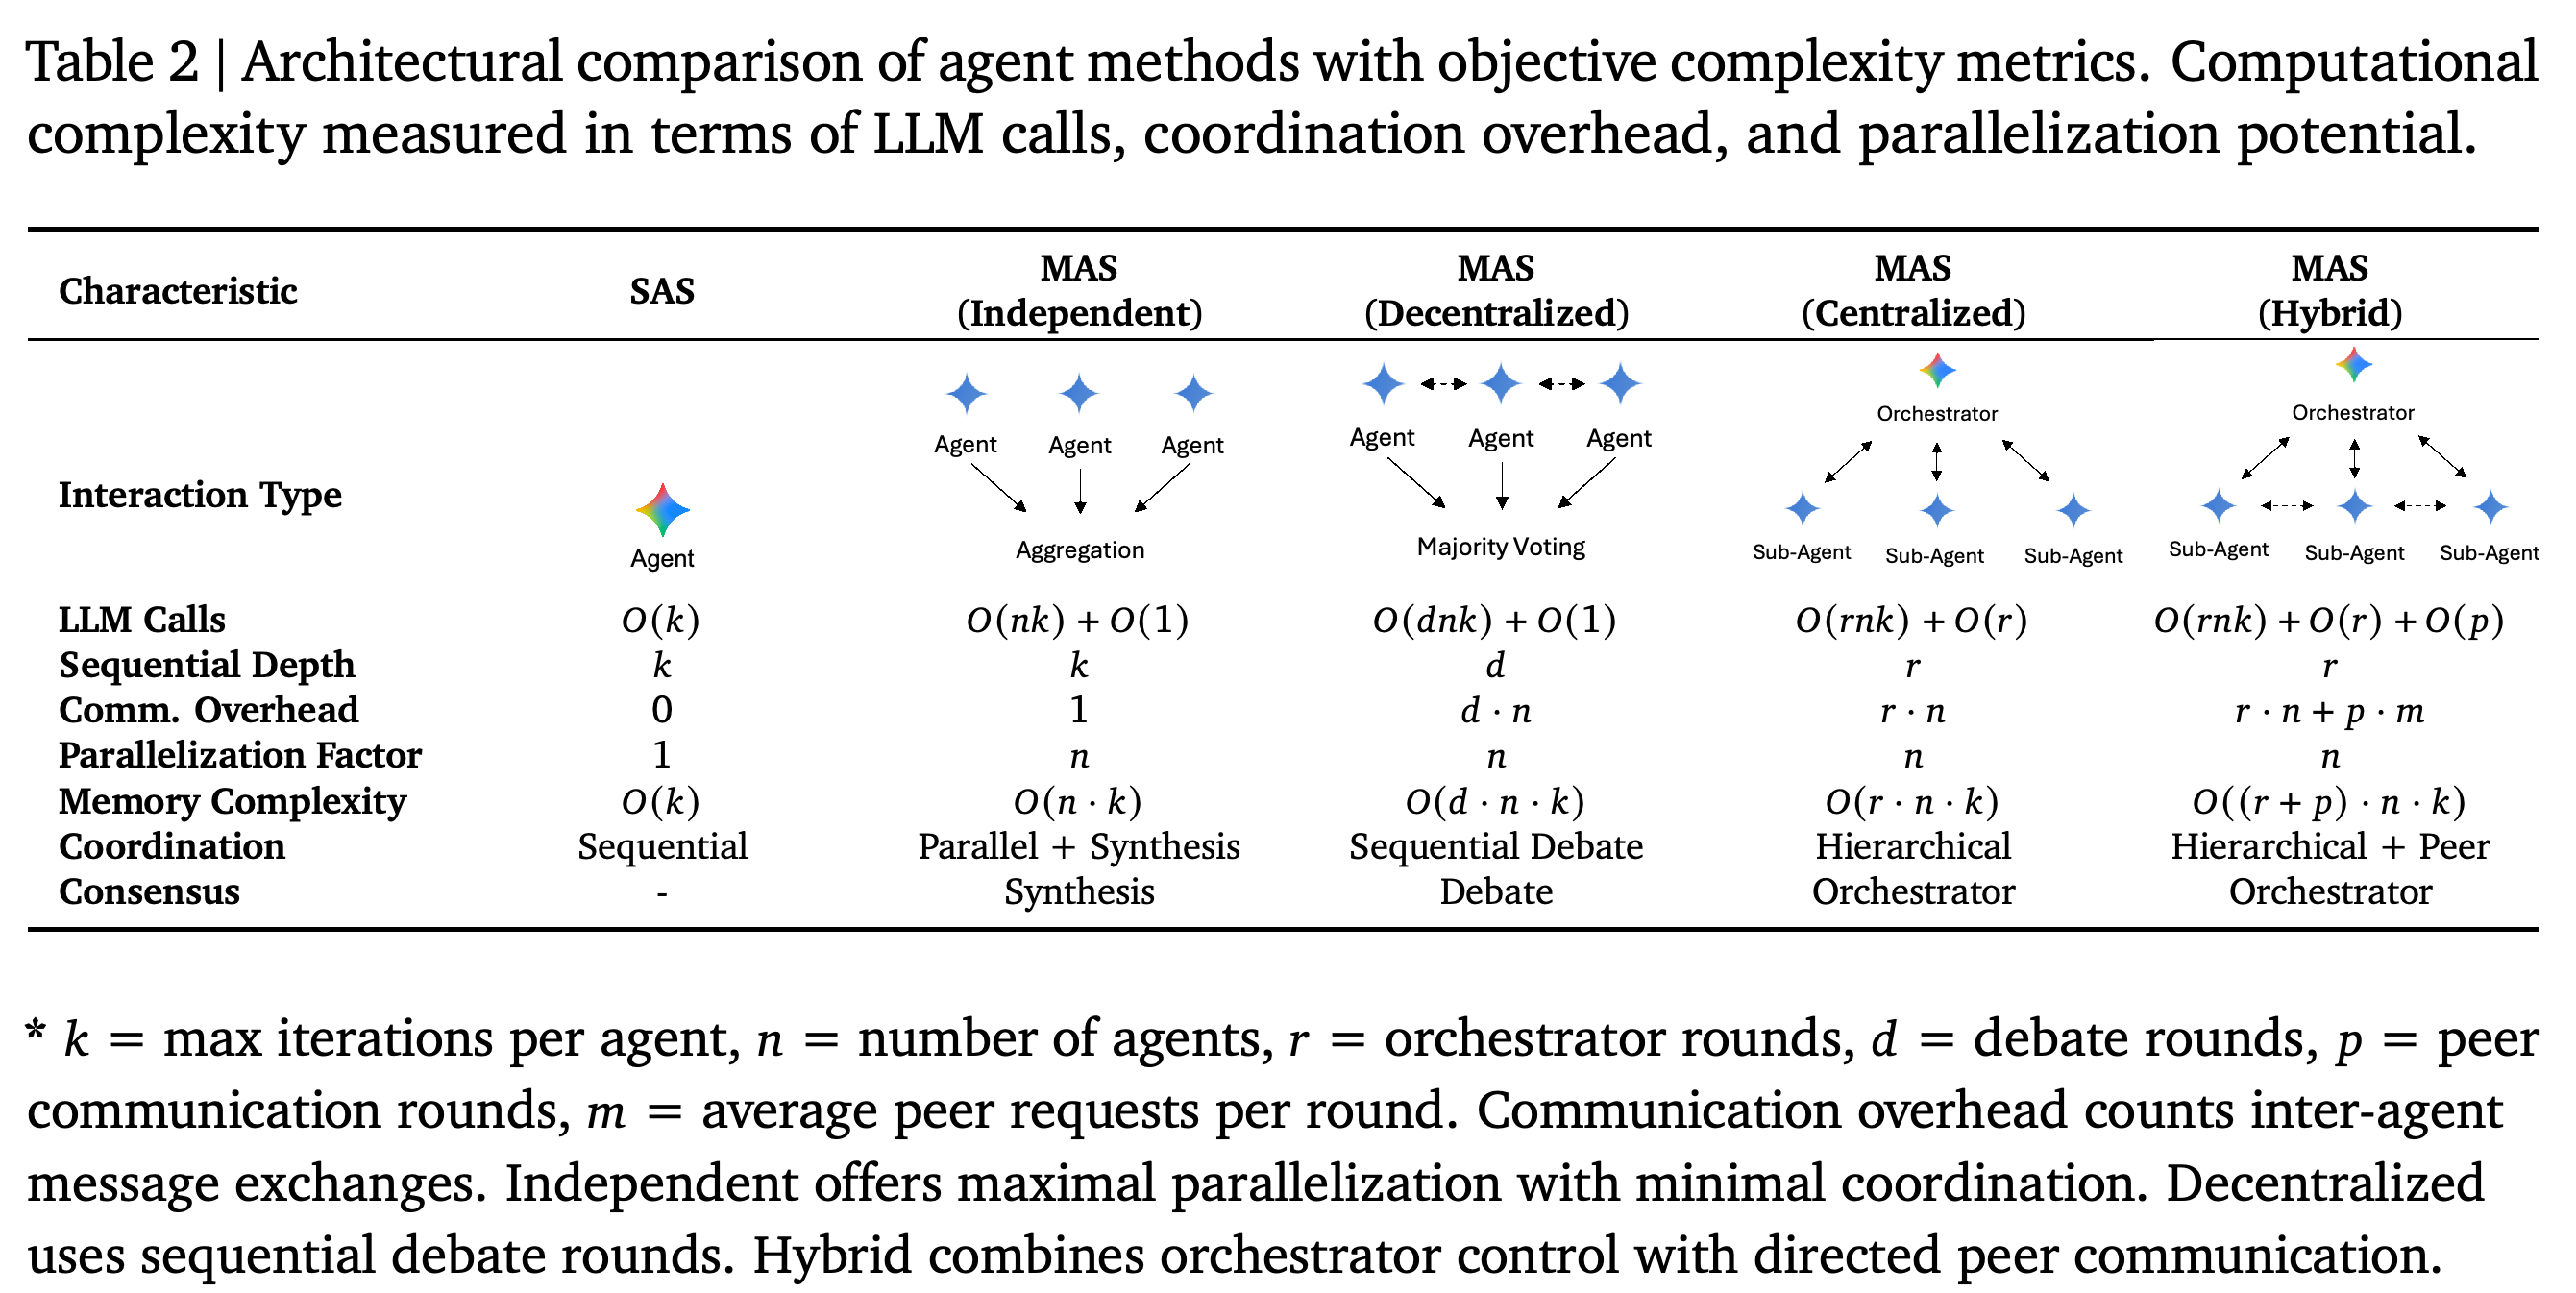
- Independent uses isolated agents followed by synthesis_only aggregation, which concatenates outputs without analytical comparison, cross-validation, or majority voting. Centralized uses an orchestrator to direct workers; Decentralized uses peer debate without an orchestrator; Hybrid combines hierarchical control with limited peer exchange.
- The architectures form a structural ablation, a comparison that introduces or removes coordination mechanisms, across orchestrator presence and peer communication. They differ in sequential depth, message overhead, parallelization, and memory requirements.
- Task-level error amplification is E_MAS/E_SAS, where E = 1 − P and P is task success. Trace-level amplification measures extra computational work associated with coordination failures; the reported 4.4× and 17.2× values refer to this trace measure, not multiples of final task failure rates.
3.2. Agentic Tasks and Benchmarks
A task is operationally agentic when an optimal interactive policy substantially outperforms the best single-forward-pass approach by a task-dependent threshold. The required properties are sequential interdependence, later actions depending on earlier observations; partial observability, relevant information initially being hidden; and adaptive strategy formation, updating behavior using new evidence.
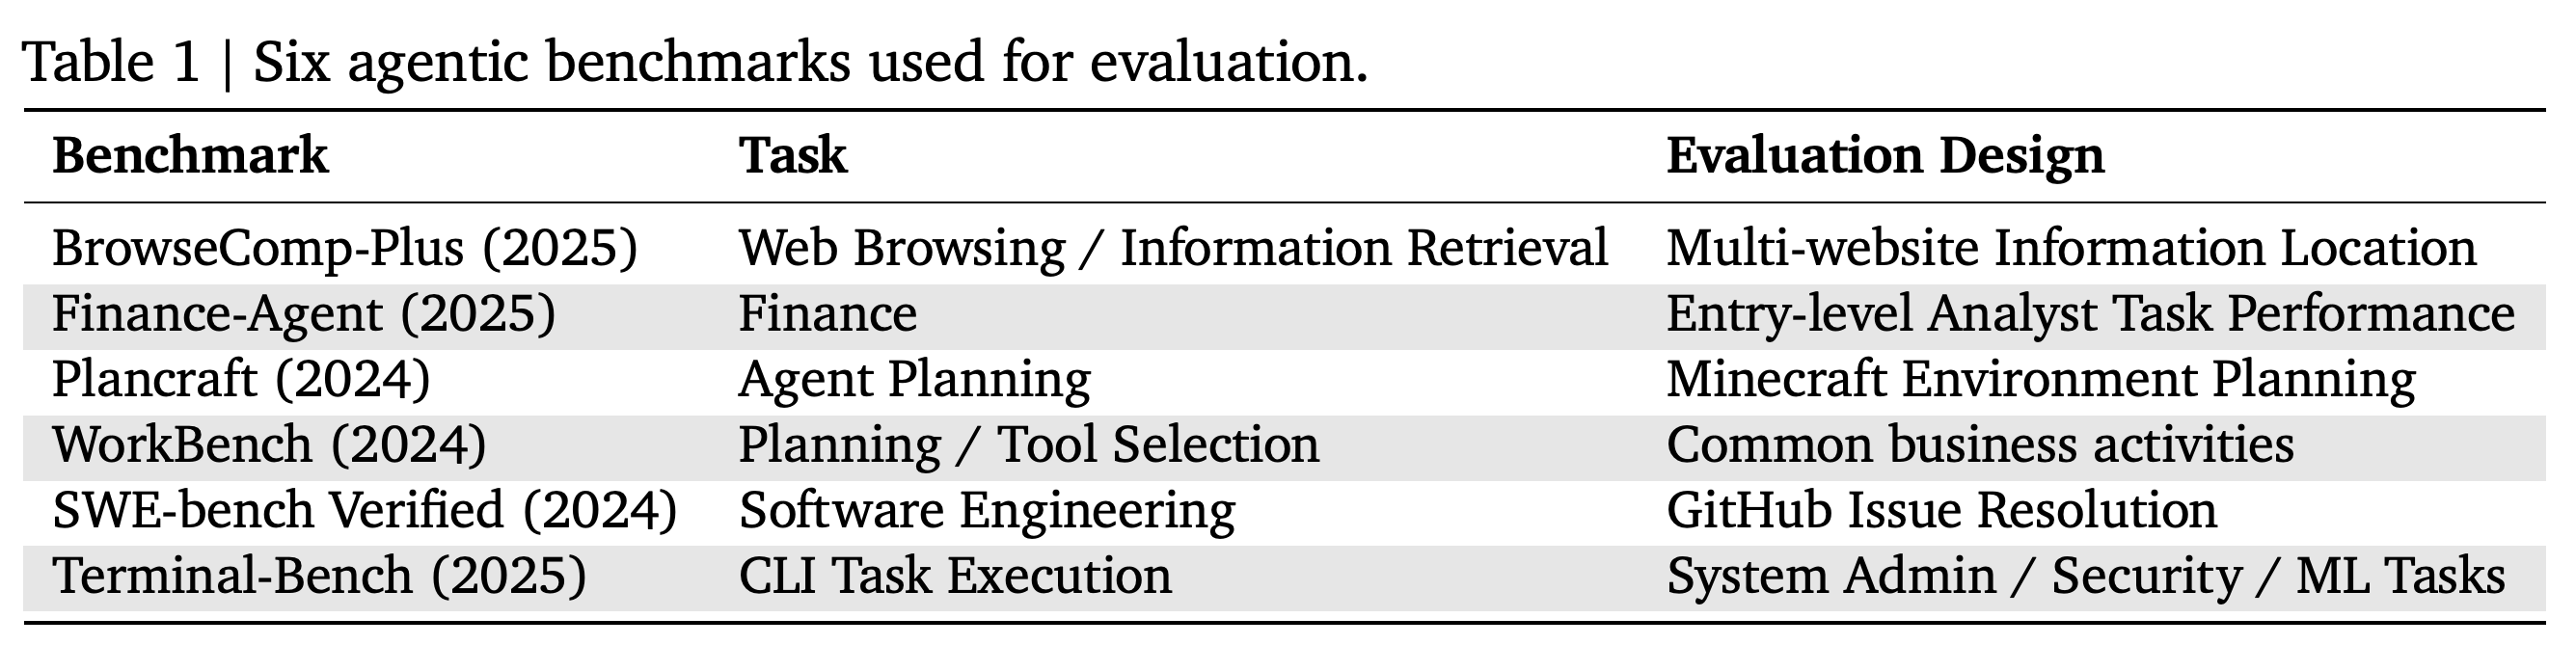
- The six benchmarks cover web information retrieval, financial analysis, Minecraft planning, workplace tool workflows, GitHub issue resolution, and terminal task execution.
- Architectural controls include identical tool interfaces and observation structures, baseline-normalized comparisons, and action–observation trajectories of length L > 3. Whether a task requires interaction depends on current model capability.
The six benchmarks require different forms of interaction, from retrieving information across websites to resolving repository issues and executing terminal tasks. This variation supports the paper’s analysis of task-dependent coordination benefits, though six benchmarks provide limited coverage of deployment settings.
4. Experiments & Results
The experiments ask which model, task, and coordination factors determine performance; when collaboration improves or degrades success; and whether measurable system properties can predict architecture choice. The analysis combines task outcomes with execution traces, records of reasoning and actions used to measure cost, communication, redundancy, and errors.
4.1. Setup
BrowseComp-Plus, Finance Agent, PlanCraft, and Workbench each contribute 45 configurations, comprising 9 models × 5 architectures; SWE-bench Verified and Terminal-Bench each contribute 40, comprising 8 models × 5 architectures. The first four use 50–100 instances per configuration, while the latter two use 20-instance subsets; available tool counts span {2, 3, 4, 5, 7, 16}.
- The models are GPT-5-nano, GPT-5-mini, GPT-5; Gemini-2.0 Flash, Gemini-2.5 Flash, Gemini-2.5 Pro; and Claude Sonnet 3.7, Claude Sonnet 4, Claude Sonnet 4.5. The paper states that Claude Sonnet 3.7 was unavailable for the two benchmarks evaluated in Docker, software that runs tasks in containerized environments.
- Intelligence Index, a composite capability score incorporating reasoning, coding, and knowledge evaluations, spans 42–71 in the fitted configurations. The paper reports matched maximum total iterations and a mean total reasoning-token budget of 4,800 tokens per trial, with smaller per-agent allocations in teams; Appendix A notes that some capability scores are reconstructed estimates.
- Coordination overhead measures relative reasoning-turn growth; message density counts messages per reasoning turn; redundancy measures similarity among agent outputs; coordination efficiency normalizes success by relative turn count. Model weights remain frozen without fine-tuning, and task prompts are shared rather than optimized separately for each model.
Independent introduces parallel workers with aggregation, while debate and orchestration add sequential rounds and message exchanges. Similar worker counts can therefore impose different coordination and memory costs, making agent count an incomplete description of system scale.
4.2. Main Results
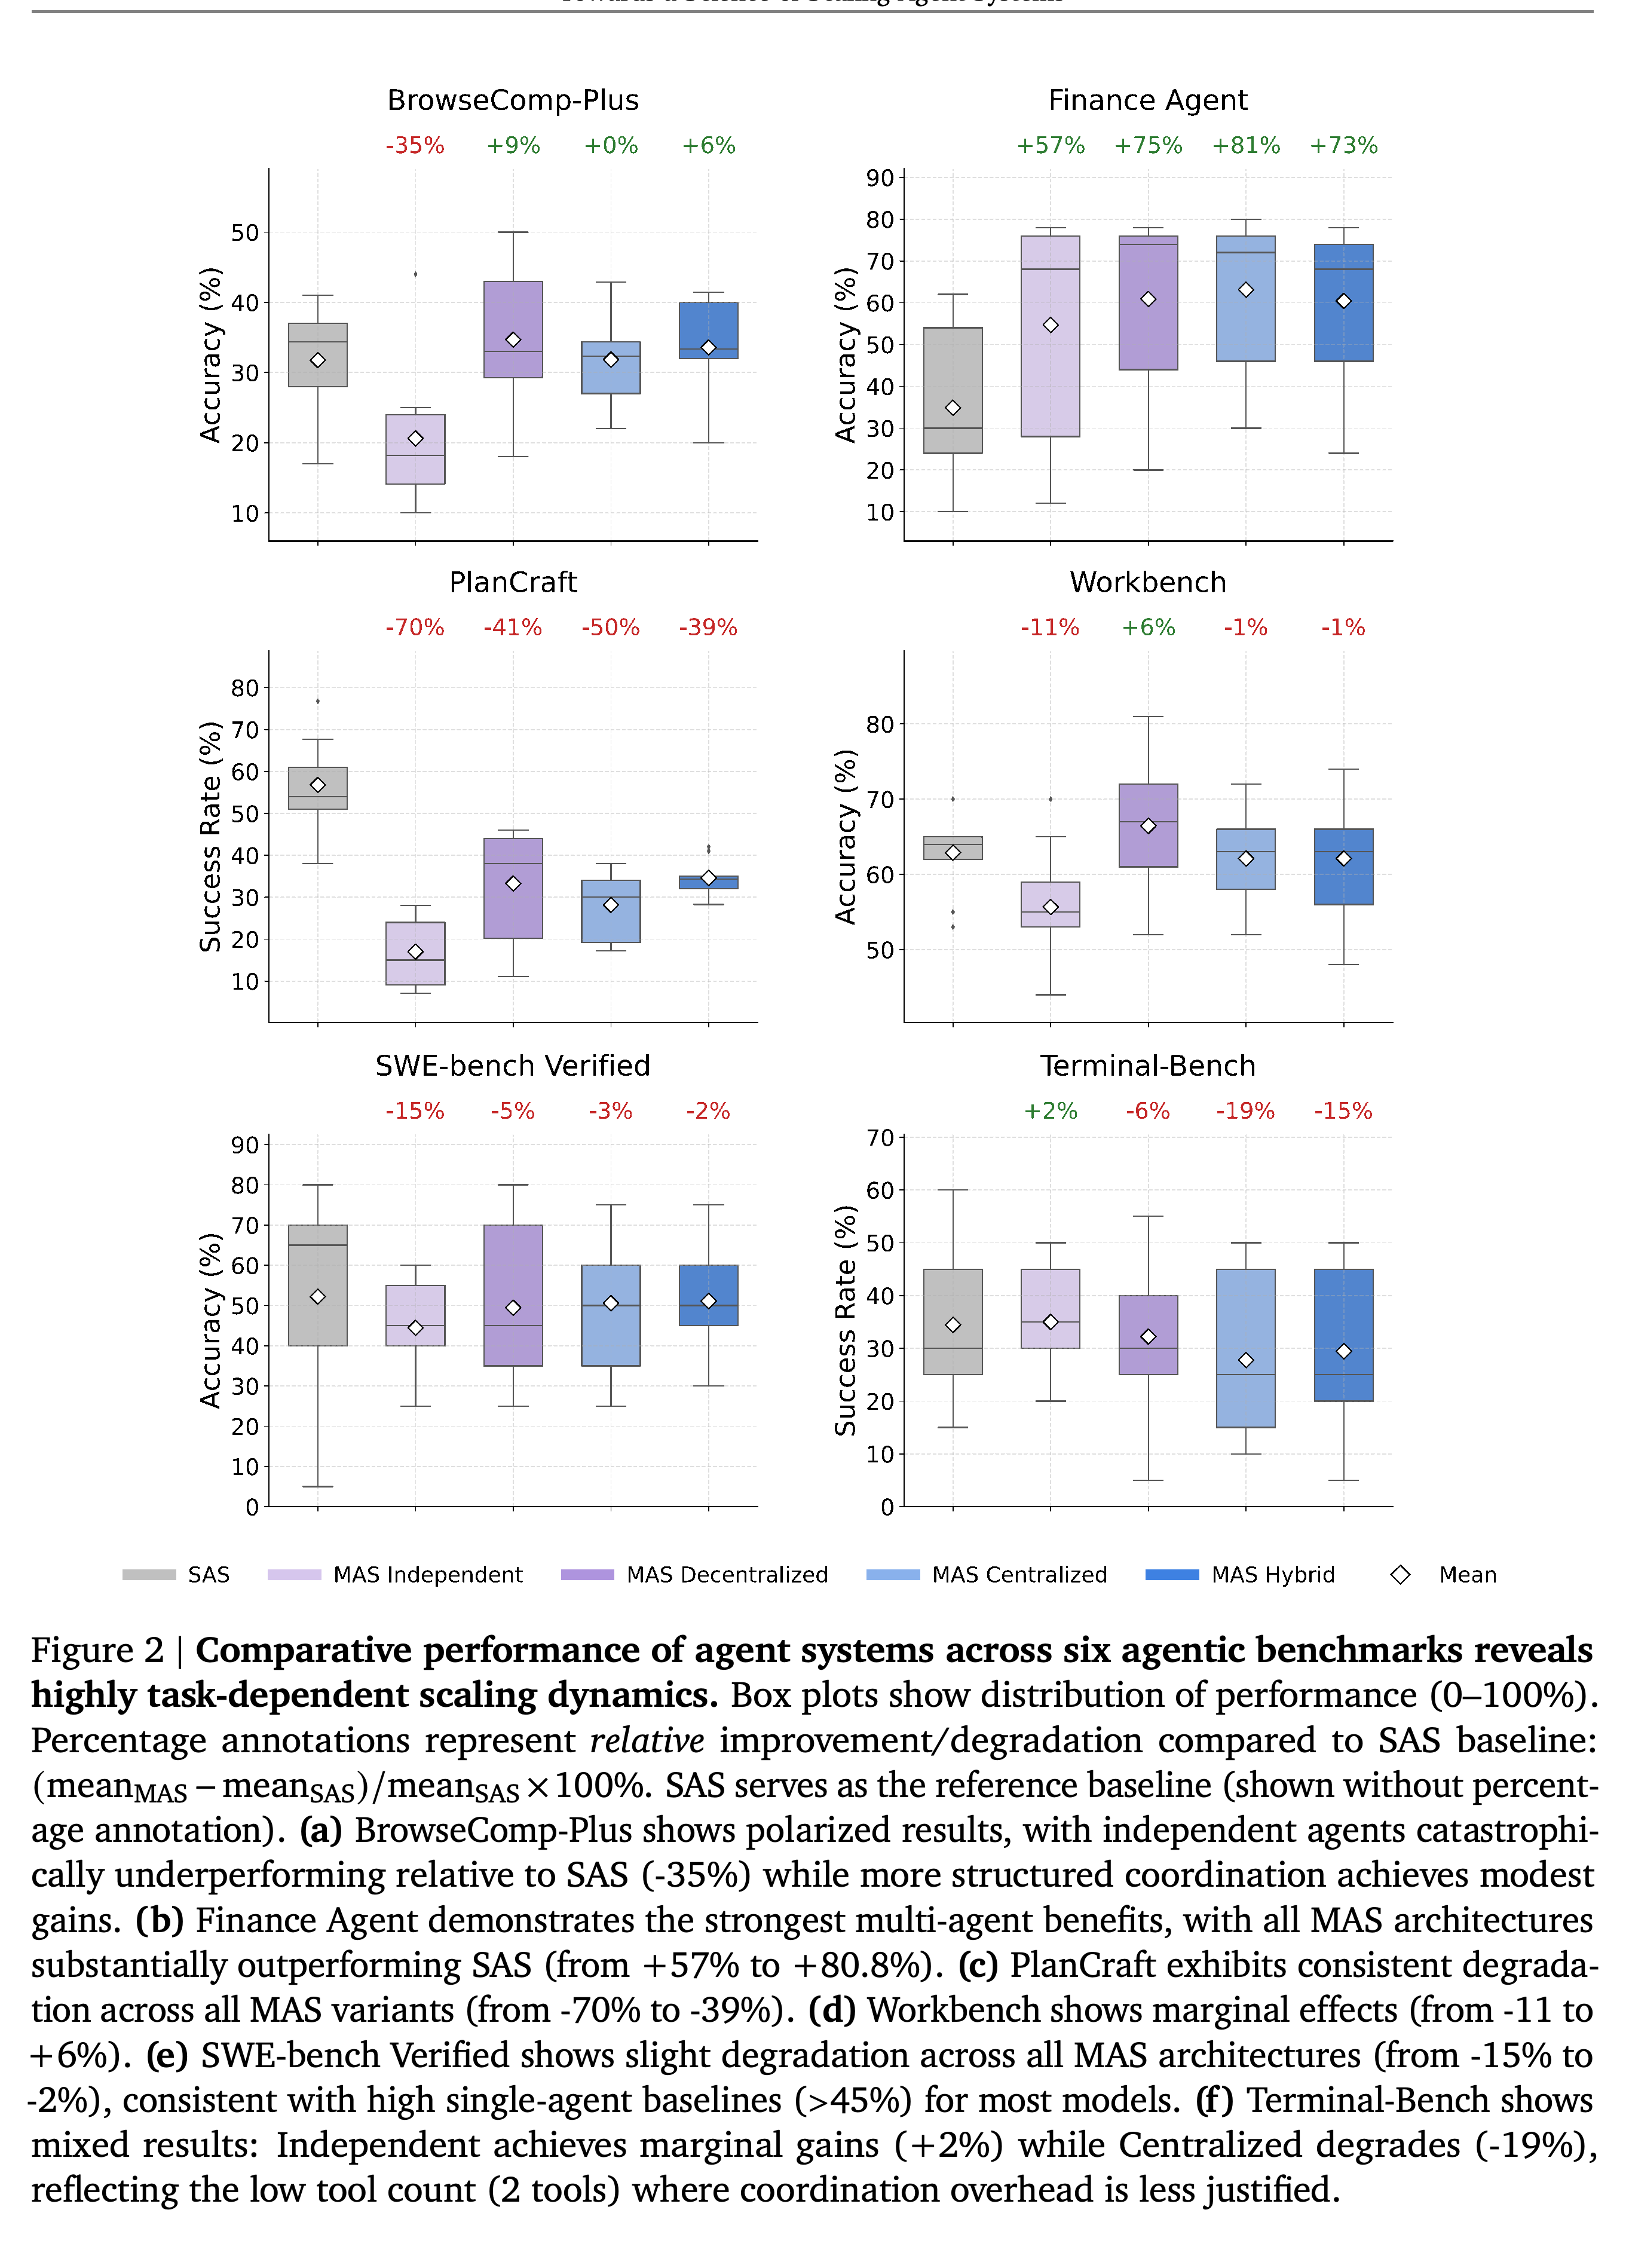
Performance changes depend strongly on the benchmark. Centralized Finance Agent reaches mean success 0.631 versus SAS 0.349 (+80.8%), whereas all MAS variants degrade PlanCraft: Independent reaches 0.170 versus SAS 0.568 (−70.0%), Centralized 0.282 (−50.3%), Decentralized 0.332 (−41.5%), and Hybrid 0.346 (−39.1%).
- Decentralized provides smaller gains on BrowseComp-Plus, 0.347 versus 0.318 (+9.2%), and Workbench, 0.664 versus 0.629 (+5.6%). Financial trace examples divide research into complementary information streams; planning examples introduce redundant recipe and inventory checks into a short sequential execution path.
- All MAS variants reduce mean SWE-bench Verified performance relative to SAS 0.522, ranging from −2.1% for Hybrid to −14.9% for Independent. Terminal-Bench is mixed: Independent achieves 0.350 versus SAS 0.344 (+1.7%), while Centralized reaches 0.278 (−19.2%).
- Across benchmarks and architectures, the reported mean relative MAS change is −0.3%, with a 95% confidence interval, an uncertainty range around the estimate, of [−58.7%, +77.2%] and standard deviation 37.5%. Finance Agent and PlanCraft have similar domain-complexity scores but opposite outcomes, showing that this score alone does not determine coordination benefit.
Every MAS variant improves the financial benchmark’s mean and reduces planning performance. Workplace gains are small, software results decline on average, and terminal results vary; the annotations are relative changes in mean performance, not percentage-point differences.
4.3. Scaling principles
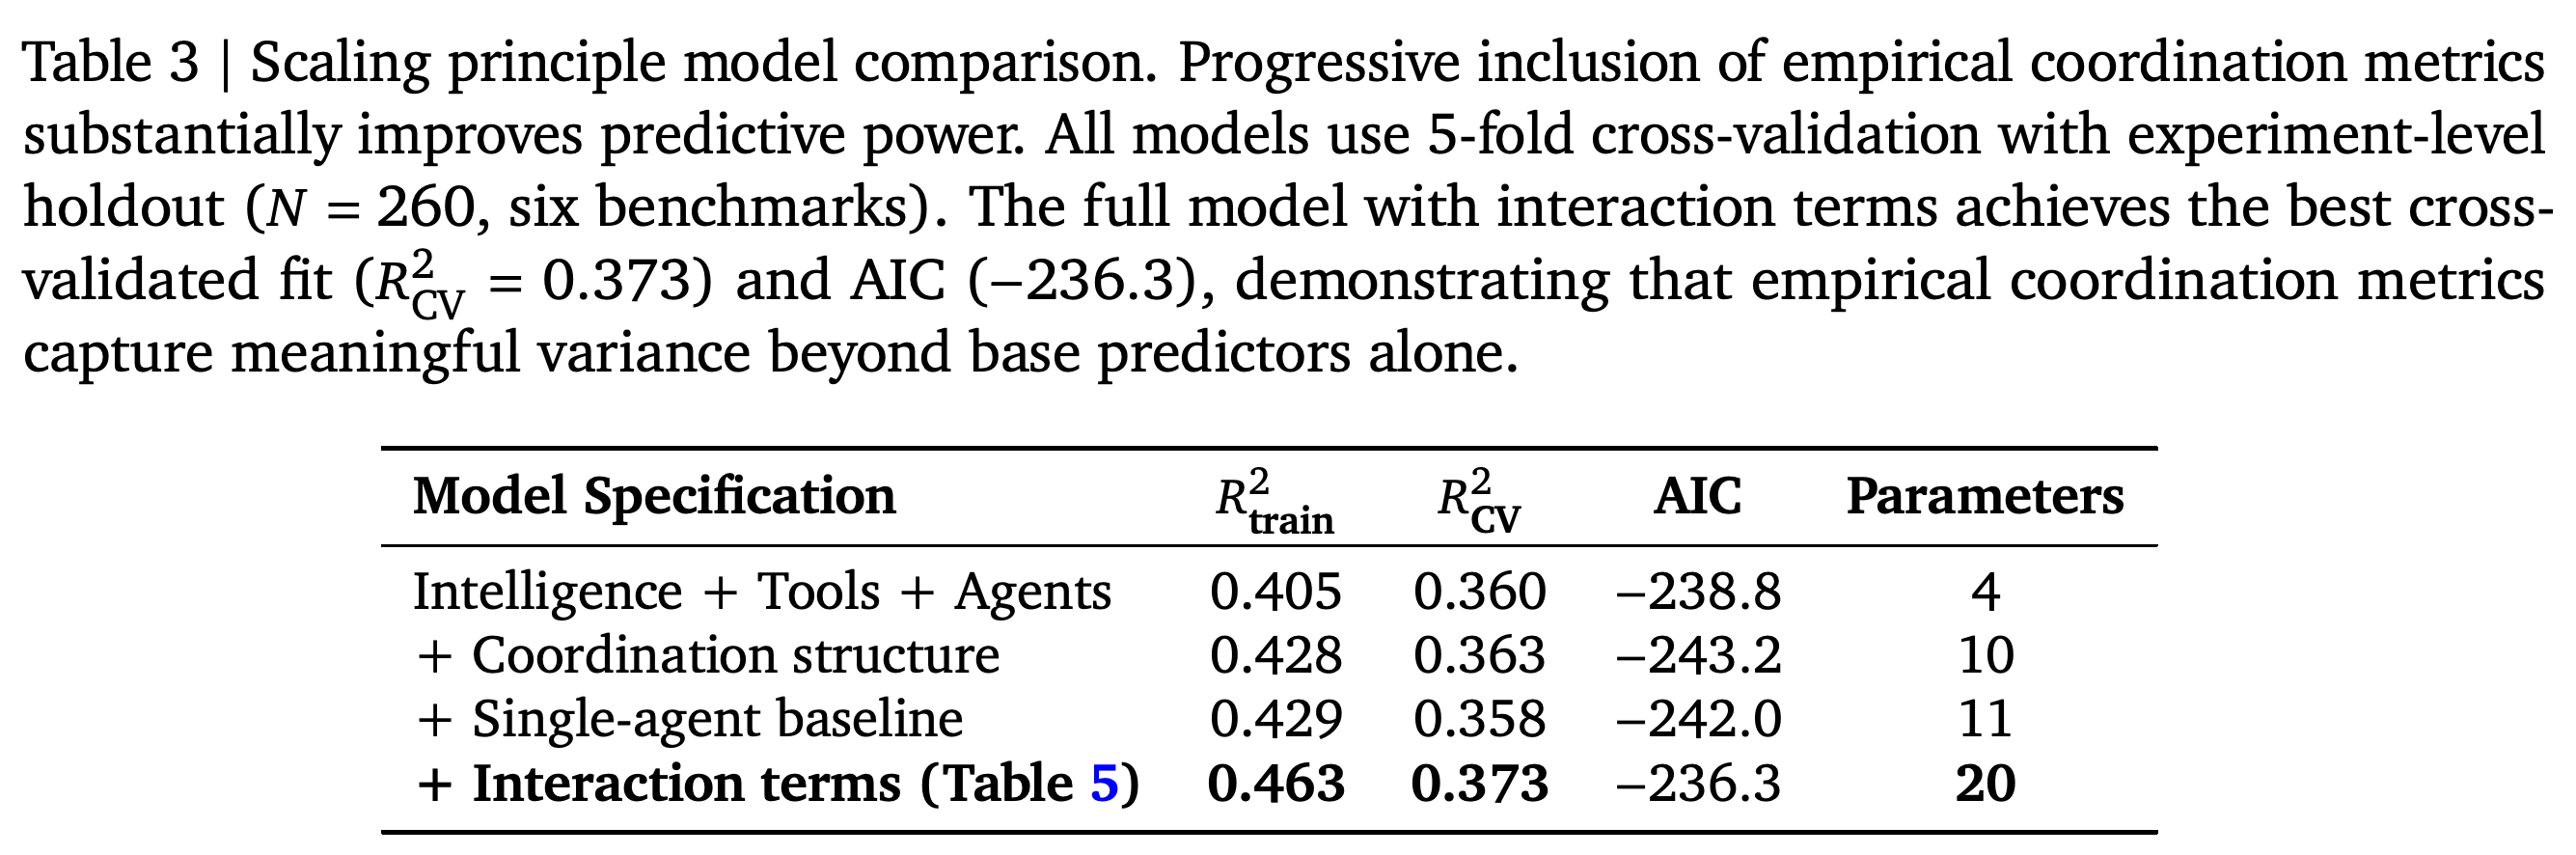
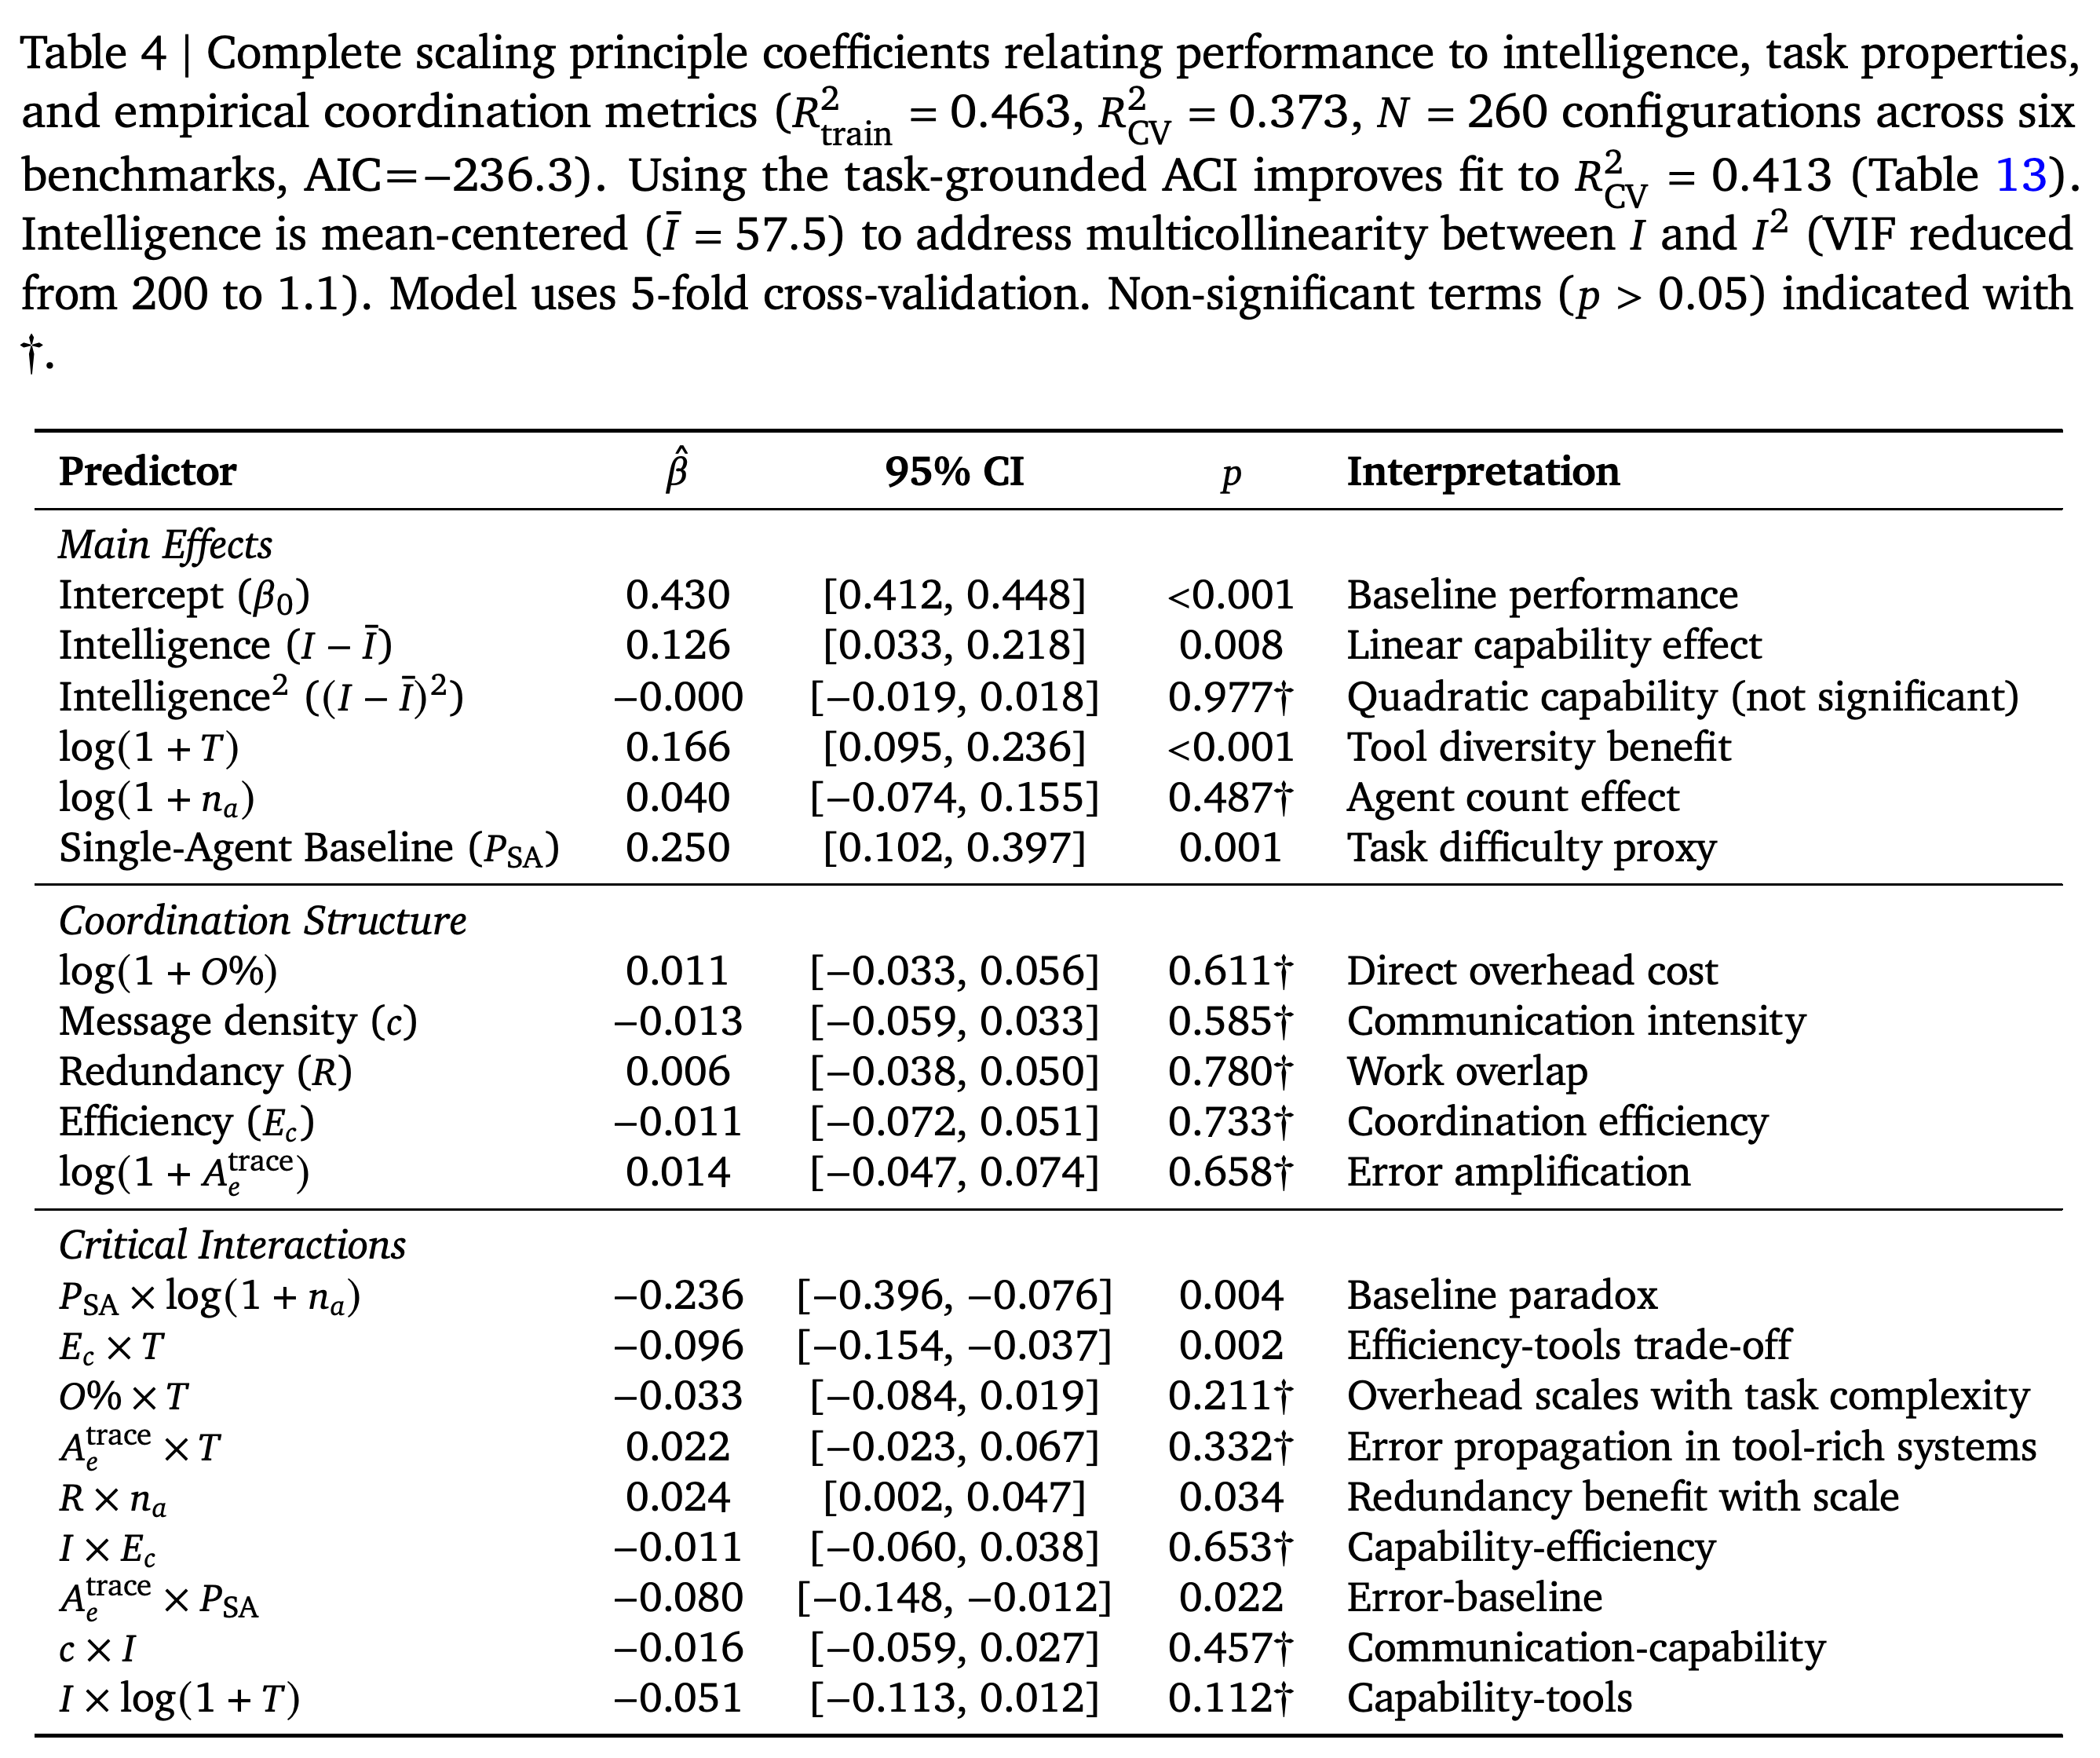
The scaling equation uses 20 parameters covering model capability, agent and tool counts, the single-agent baseline, empirical coordination measures, and nine interactions, terms representing joint relationships between predictors. Predictors are transformed where specified and standardized to mean zero and unit standard deviation; five-fold cross-validation holds out experimental configurations, producing R²_train = 0.463 and R²_CV = 0.373 (±0.170 SD), where SD denotes standard deviation, with Intelligence Index.
- Replacing Intelligence Index with ACI raises R²_train to 0.481 and R²_CV to 0.413 (±0.130 SD), with no reported reversals in predictor significance. ACI correlates moderately with Intelligence Index, r = 0.45, and requires benchmark execution to obtain.
- The baseline–agent interaction is negative, β = −0.236, p = 0.004 under ordinary least squares (OLS), regression that minimizes squared residuals. The efficiency–tools interaction is also negative, β = −0.096, 95% confidence interval [−0.154, −0.037], p = 0.002; these standardized coefficients should not be multiplied directly by raw predictor values.
- The full model improves cross-validated R² modestly over Intelligence + Tools + Agents, from 0.360 to 0.373. Table 3 assigns the full model AIC = −236.3, while the coordination-structure model has −243.2; lower Akaike information criterion (AIC), a fit measure penalizing model complexity, is preferable, so the table contradicts its caption’s claim that the full model has the best AIC.
Additional coordination increases dollar cost without a consistent performance advantage across families. In the OpenAI panel, Decentralized has higher plotted mean performance and lower cost than Centralized or Hybrid, qualifying the source caption’s claim of gains from those two architectures. The plot covers 180 configurations from four benchmarks, with error bars showing uncertainty in the means.
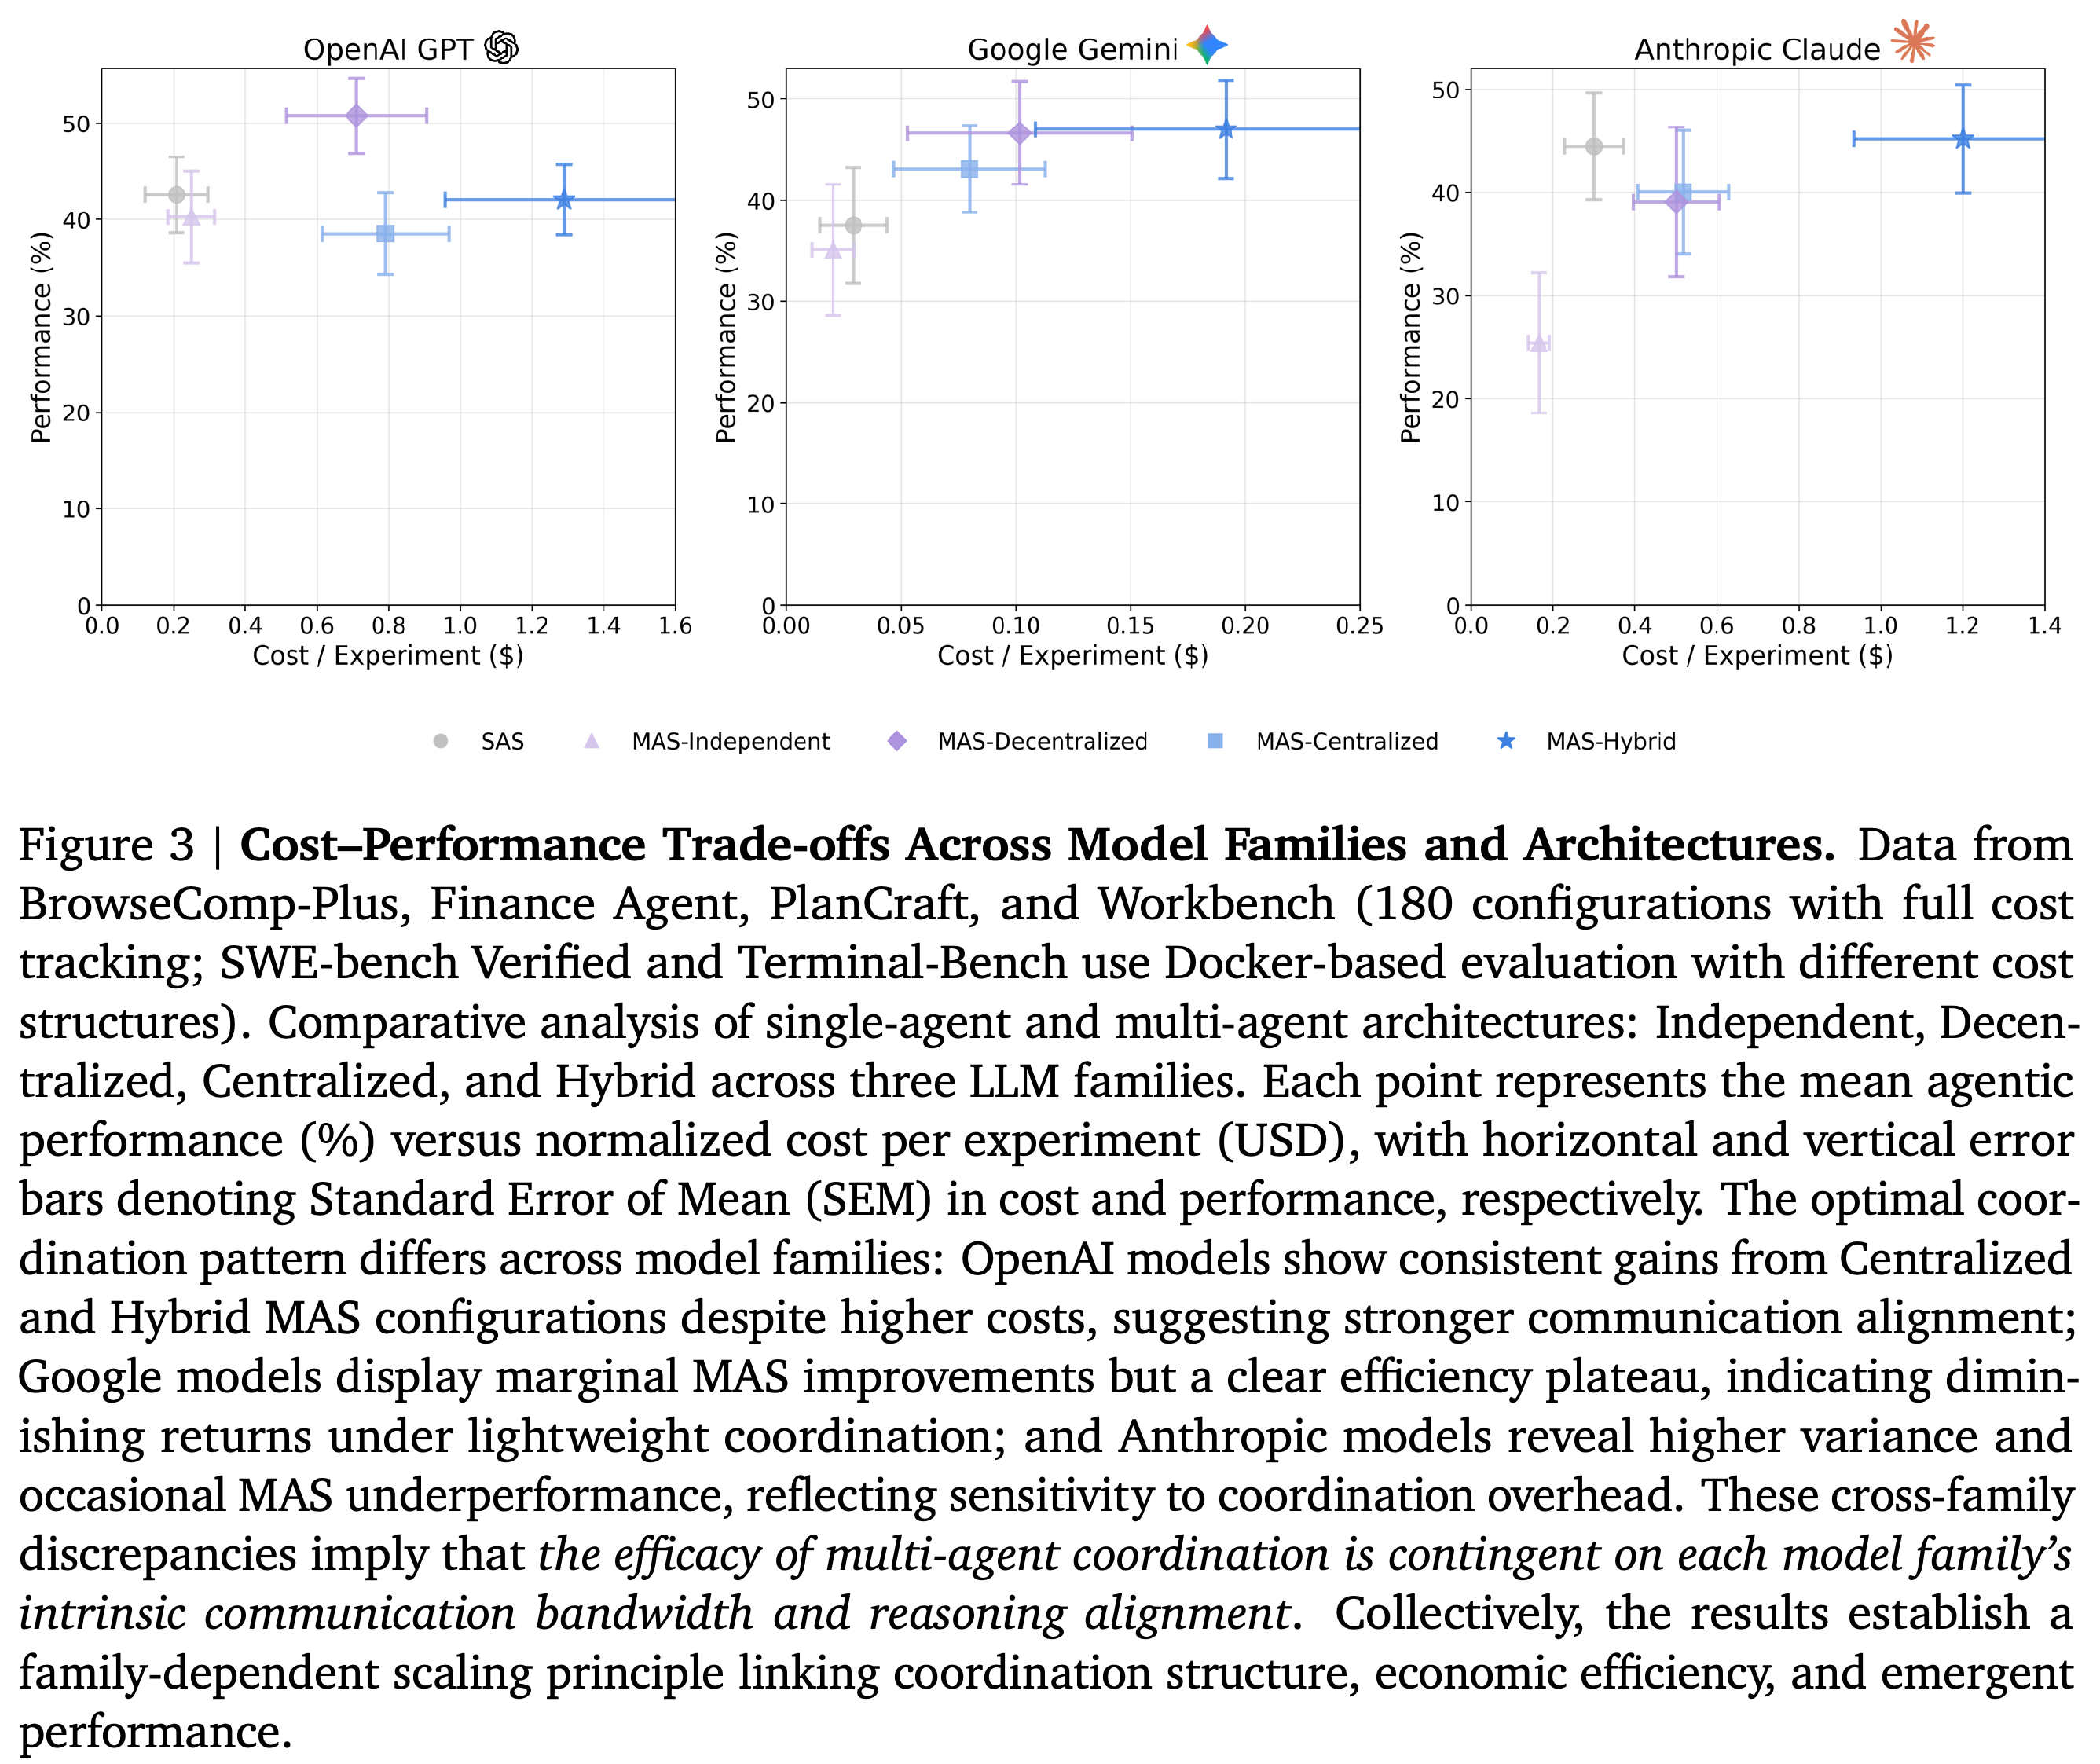
The paper derives an approximate 45% raw single-agent performance boundary from the agent-count and baseline–agent coefficients. Within-domain held-out evaluation reports 87% correct architecture selection, exceeding random choice at 20% and capability-only selection at 54%.
- Illustrative task regimes favor SAS for sequential planning, Centralized for decomposable analysis, and Decentralized for some tool-heavy workflows. Workbench exhibits modest collaboration gains despite a high baseline, so the threshold is an empirical tendency rather than a universal rule.
- The model has no dataset-specific parameters, but evaluation that holds out an entire dataset limits claims about absolute performance on unseen domains. Its coordination predictors are architecture-level constants applied uniformly across benchmarks, limiting their representation of task-specific coordination behavior.
The full interaction model raises cross-validated R² from 0.360 to 0.373 while increasing the parameter count from 4 to 20. The coordination-structure model has the lowest displayed AIC, −243.2; the full model’s better cross-validated fit does not support the source caption’s claim that it also has the best AIC.
The negative baseline–agent and efficiency–tools interactions support the initial saturation and tool-cost interpretations under naive OLS. Agent count alone, quadratic capability, and error amplification’s main effect are nonsignificant; later robustness checks weaken several initially significant terms.
4.4. Coordination Efficiency, Error Dynamics, and Information Transfer
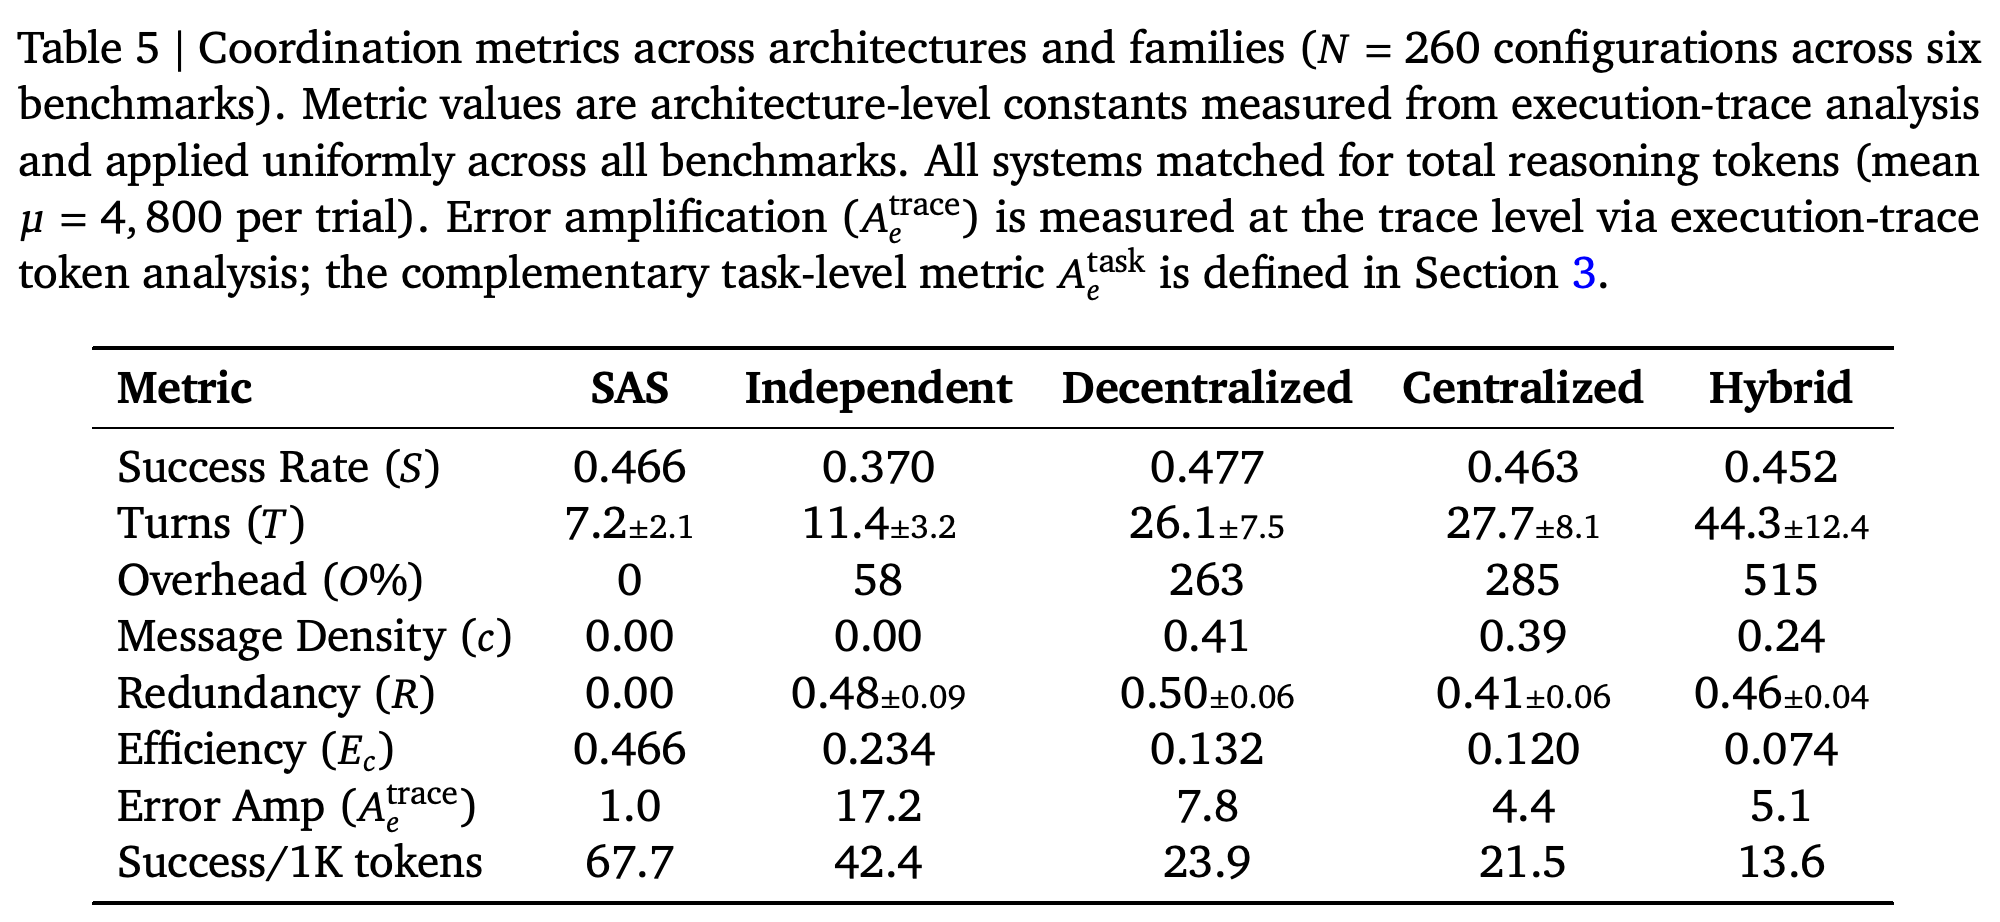
Execution traces reveal substantial coordination costs: mean turns increase from 7.2 for SAS to 11.4 for Independent, 26.1 for Decentralized, 27.7 for Centralized, and 44.3 for Hybrid. Corresponding overhead is 58%, 263%, 285%, and 515%, while coordination efficiency decreases from 0.466 for SAS to 0.234, 0.132, 0.120, and 0.074.
- An architecture-aggregated descriptive fit gives T = 2.72 × (n + 0.5)^1.724, R² = 0.974, with exponent confidence interval [1.685, 1.763]. Large differences between architectures at the same team size limit its interpretation as a general law of agent count; the message-density fit likewise describes only communicating MAS configurations.
- Trace-level error amplification is 17.2 for Independent, 7.8 for Decentralized, 4.4 for Centralized, and 5.1 for Hybrid, against SAS 1.0. Architectures with verification reportedly reduce factual errors by 22.7% on average, with 95% confidence interval [20.1%, 25.3%], but error amplification’s main regression effect is not significant after controlling for other measures.
- Information gain, estimated reduction in task uncertainty after coordination, correlates with collaboration benefit in structured domains, r = 0.71, p < 0.001. Successful Finance Agent trials average 1.4 bits versus 0.4 bits for failures; weaker relationships in other domains limit generalization.
Decentralized’s aggregate success rate of 0.477 is slightly above SAS at 0.466, while its turn count rises from 7.2 to 26.1. Hybrid has the highest overhead, 515%, and lowest coordination efficiency, 0.074; Centralized’s trace-level error amplification is 4.4 compared with Independent’s 17.2. These predictors are architecture-level constants applied uniformly across benchmarks.
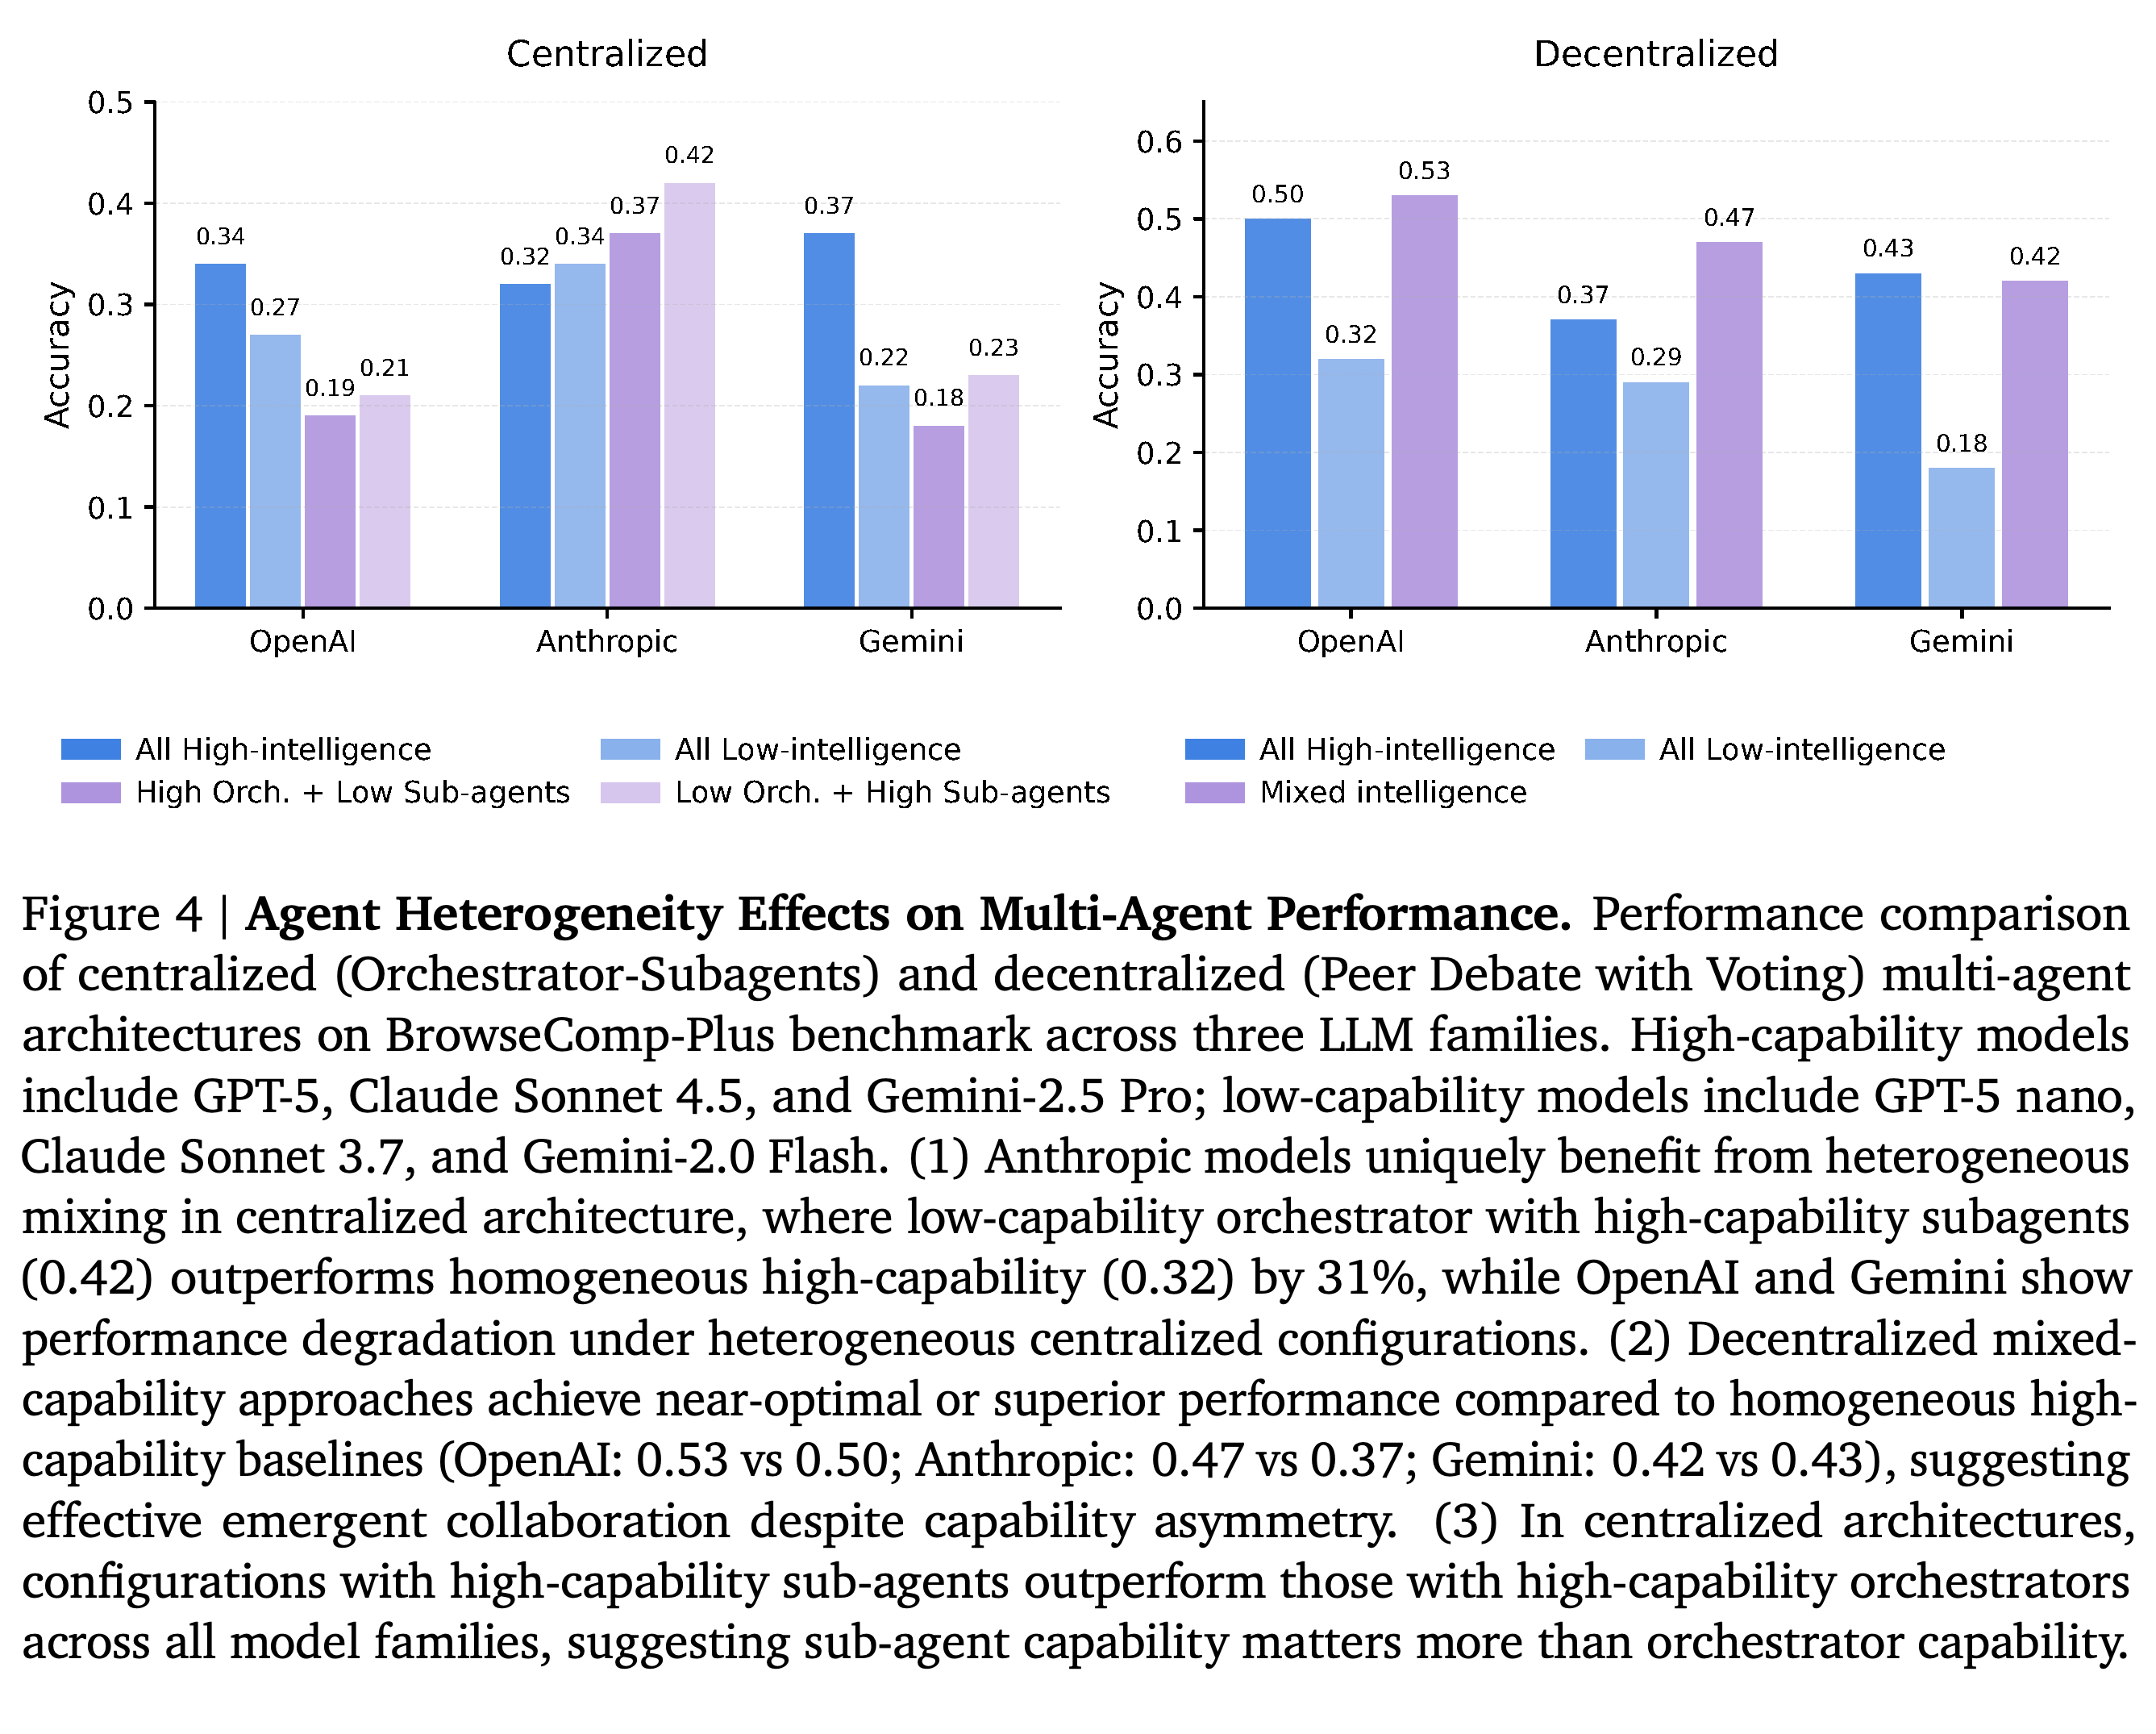
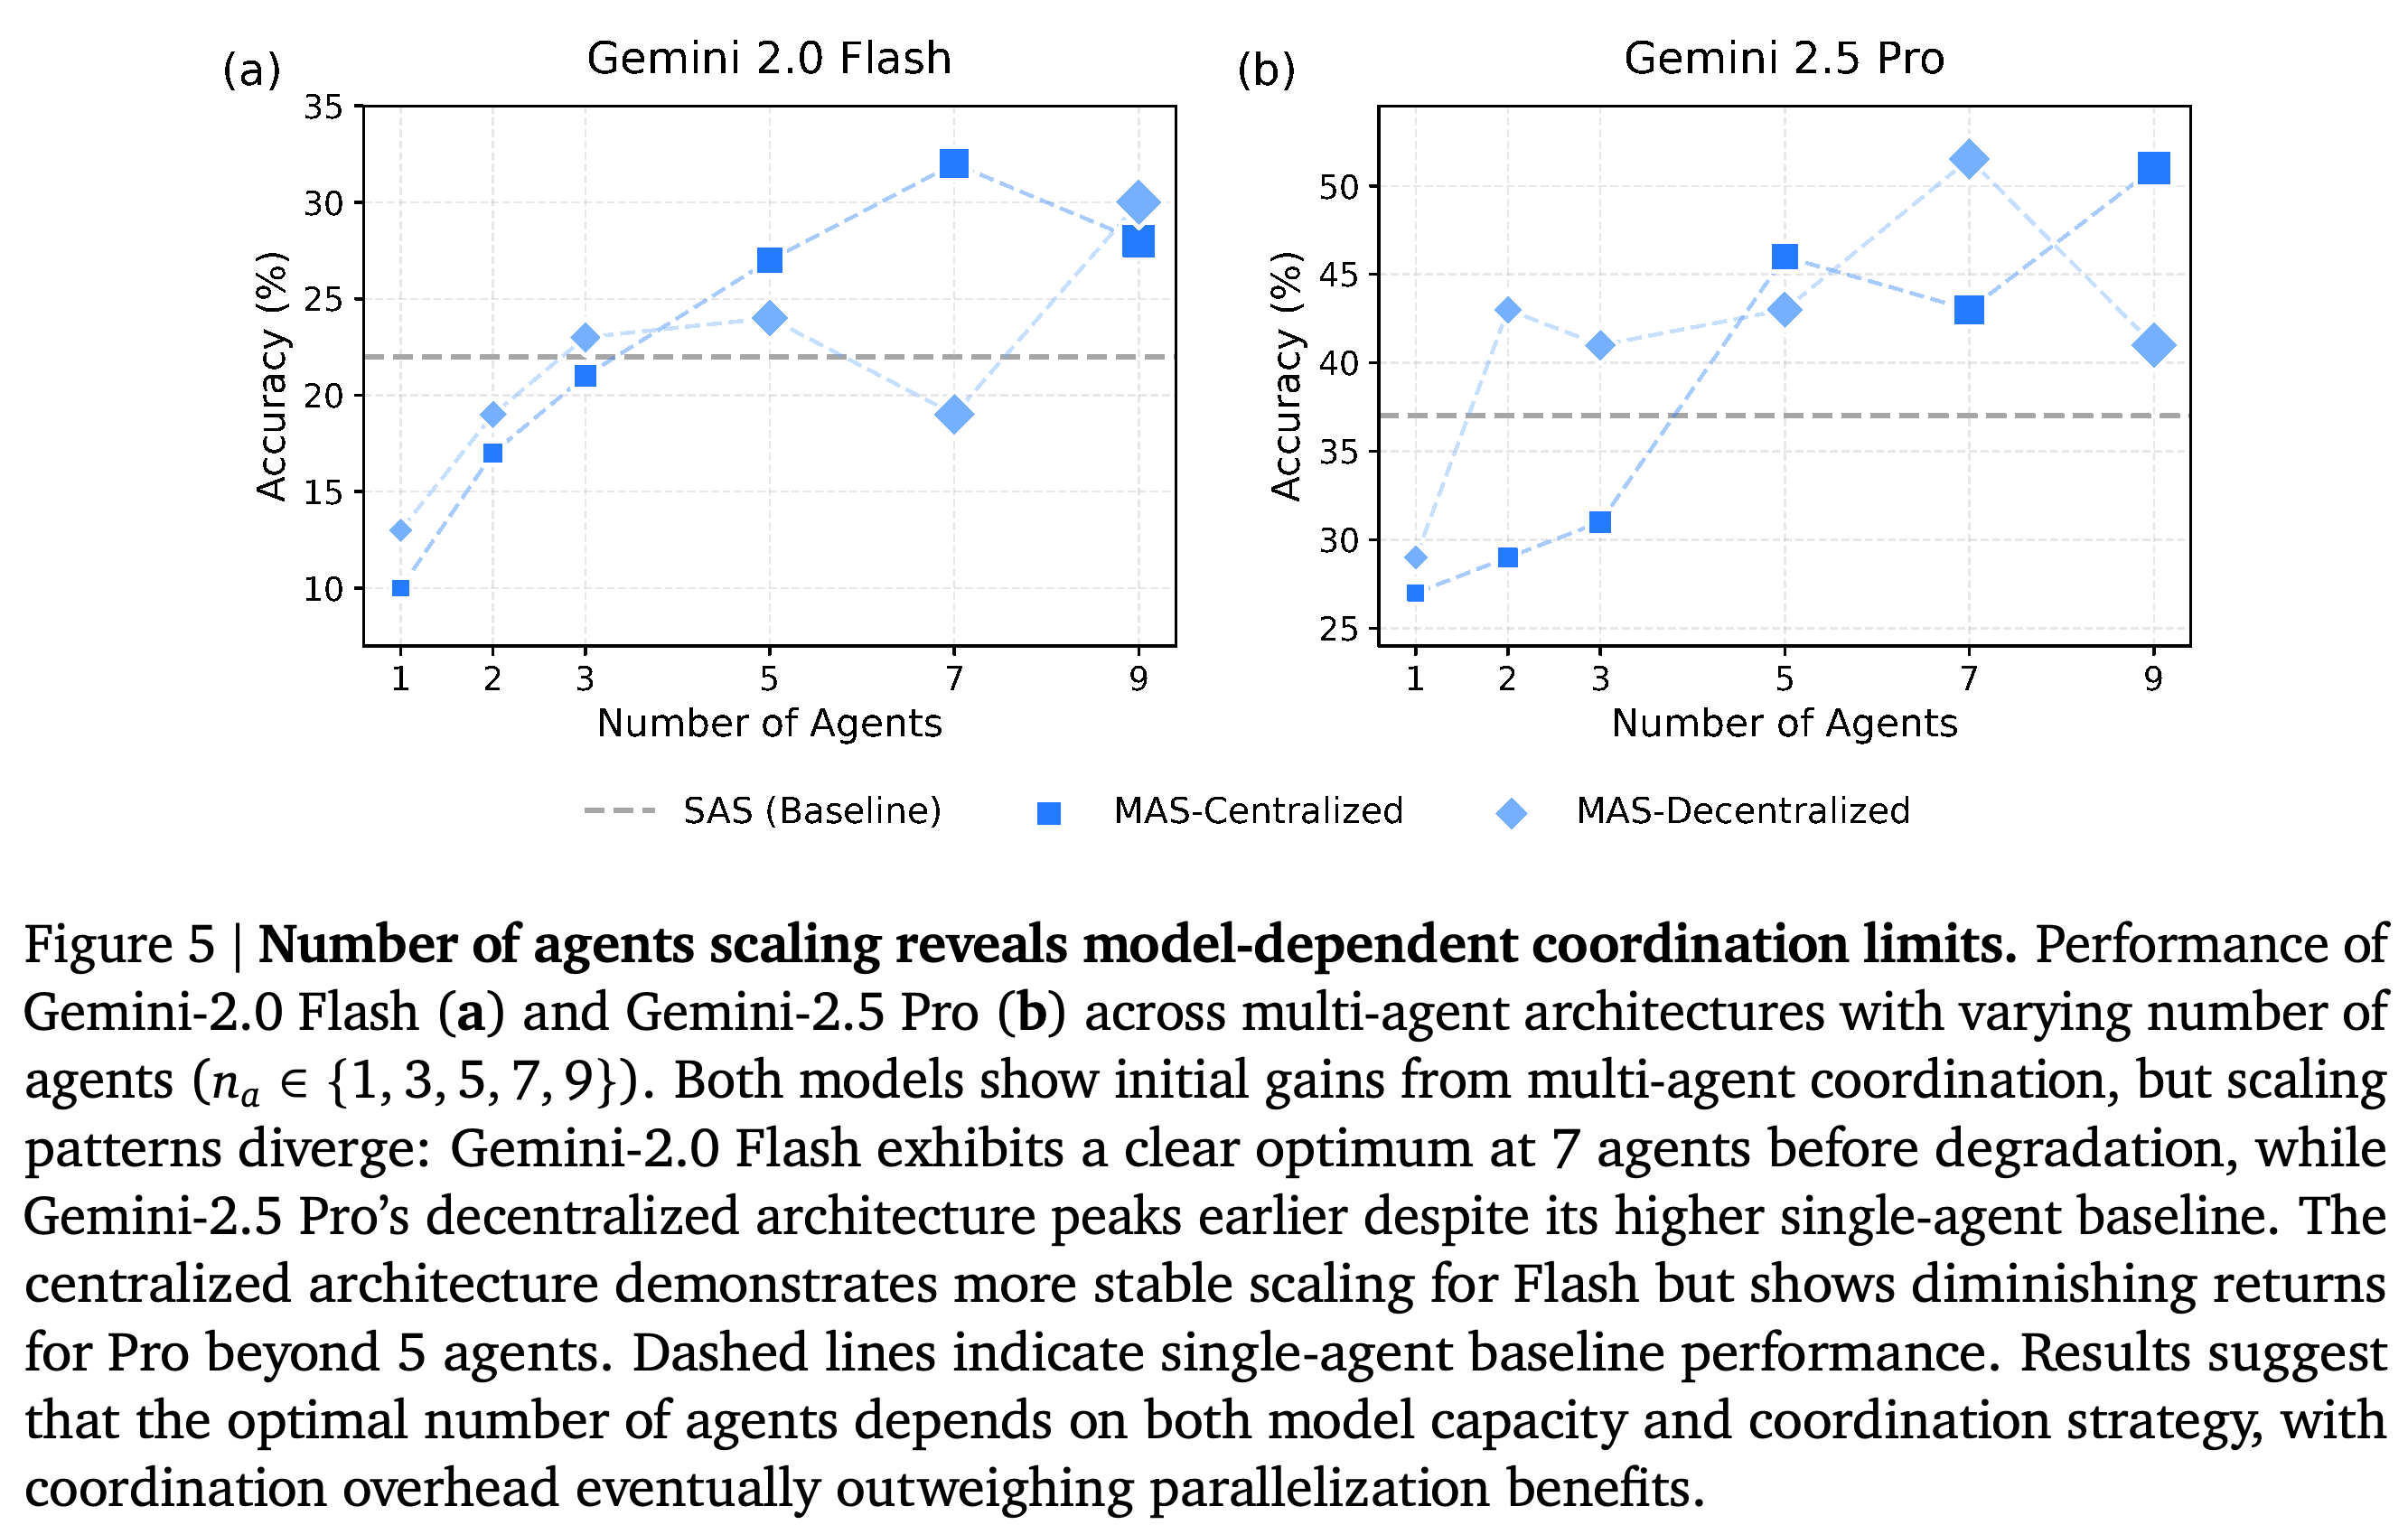
Exploratory experiments examine heterogeneous teams, agents using models of different capabilities, and larger team sizes. On BrowseComp-Plus, Figure 4 shows that mixing can help some decentralized configurations and one Anthropic centralized role assignment, while Figure 5 shows irregular, model-dependent responses to additional agents.
- Figure 4 reports Anthropic accuracy 0.42 for a lower-capability orchestrator with stronger workers versus 0.32 for an all-high-capability team. Table 12 uses a different strong-model baseline, assigning that same mixed configuration a −0.01 difference; this inconsistency prevents an unqualified estimate of its benefit.
- The larger-team plots contain reversals and later recoveries, including Gemini-2.5 Pro Centralized recovering at nine agents. They support architecture-specific sensitivity rather than a universal optimum at a particular team size.
- Hybrid has the highest reported coordination-failure rate, covering message interpretation, task allocation, and state synchronization errors, at 12.4%, compared with 1.8% for Centralized and 3.2% for Decentralized. The paper treats vendor differences as empirical signatures because underlying model mechanisms are not isolated.
Mixed decentralized teams match or exceed the plotted all-high-capability baseline for OpenAI and Anthropic, while centralized mixing reduces OpenAI and Gemini performance. The Anthropic centralized exception uses a weaker orchestrator with stronger workers, but its strong-model baseline differs from Table 12, preventing an unqualified estimate of the gain.
Gemini-2.0 Flash Centralized peaks at seven agents and declines at nine; its Decentralized curve instead reaches its highest displayed value at nine. Gemini-2.5 Pro fluctuates, with Decentralized peaking at seven and Centralized recovering at nine. The curves support model- and architecture-dependent behavior, and the plotted axis includes two agents although the source caption’s listed set omits that value.
4.5. Robustness and Sensitivity Analysis
Robustness checks account for dependence among configurations within each of six benchmarks and for testing 19 predictor coefficients. Cluster-robust standard errors, uncertainty estimates allowing observations within a dataset to be correlated, inflate by up to 2.9× relative to naive OLS; Table 14 retains single_agent_baseline at p = 0.004 and error_x_baseline at p = 0.030.
- Holm–Bonferroni correction, a procedure controlling false positives across simultaneous tests, retains log_tools at p_Holm < 0.001, single_agent_baseline at 0.018, and efficiency_x_tools at 0.026. These corrections use naive OLS p-values and are reported separately from clustering.
- The negative baseline_x_agents interaction loses conventional significance under both cluster-robust inference, p = 0.105, and Holm correction, p_Holm = 0.084. The authors’ capability-saturation interpretation therefore requires qualification: the exact interaction used to derive the threshold does not survive either correction.
- The paper reports 94% agreement with the approximate 45% threshold across 16 model×benchmark configurations on SWE-bench Verified and Terminal-Bench, p < 0.001. Its prose also says only single_agent_baseline survives cluster-robust inference, conflicting with Table 14’s significant error_x_baseline term.
5. Limitations
The study covers canonical coordination patterns and preliminary scaling up to nine agents, rather than the full design space of specialized or larger teams. Shared task prompts improve comparison control but may disadvantage architectures or model families that would benefit from separate prompt optimization.
- SWE-bench Verified and Terminal-Bench use only 20 instances each. Bootstrap intervals, uncertainty ranges obtained by resampling observations, use 10,000 resamples and typically extend about ±20 percentage points per cell, leaving individual architecture comparisons underpowered.
- Six text-based benchmark domains do not establish transfer to embodied systems that act in physical environments, multimodal interaction involving multiple data types, real-world feedback loops, or extended temporal dependencies. Model-mixing tests are preliminary and do not establish that specialized teams overcome saturation.
- Only six dataset clusters support the statistical analysis. Natural-language communication also introduces cost and latency; different communication representations or routing policies could produce different scaling behavior.
6. Conclusion
The conclusion identifies capability saturation as the authors’ most robust interpretation and describes tool-related penalties and trace-level error amplification as additional directional patterns. The controlled comparison shows that coordination benefits vary with task structure; the predictive model’s strongest architecture-selection evidence comes from held-out configurations within evaluated regimes, while frontier-model results provide only preliminary evidence of numerical prediction within BrowseComp-Plus.
Data Availability
The paper lists public benchmark sources: BrowseComp-Plus (https://arxiv.org/abs/2508.06600, 100 instances), Finance-Agent (https://arxiv.org/abs/2508.00828, 50 instances), PlanCraft (https://arxiv.org/abs/2412.21033, 100 instances), and Workbench (https://arxiv.org/abs/2405.00823, 100 instances). SWE-bench Verified (https://www.swebench.com/) uses a deterministic shuffle with seed 42 to select 20 of 500 instances; TerminalBench (https://www.tbench.ai/) uses the first 20 of 86 instances, and per-instance results are reported at etc/analysis/.
Code Availability
The repository https://github.com/ybkim95/agent-scaling contains the evaluation framework, configurations, prompt templates, analysis scripts, and representative sanitized execution traces. The paper directs readers to repository documentation for additional artifacts required for full reproduction.
Appendix
- A. Model Intelligence Index describes extending the Artificial Analysis Intelligence Index (https://artificialanalysis.ai/evaluations/artificial-analysis-intelligence-index). Unreported model scores are reconstructed using an equal-weighting formulation aligned with Intelligence Index v3.0; starred component scores are estimates. The authors acknowledge unavailable private tests, nondeterminism, and approximate long-context evaluations.
- B. Out-of-Sample Validation evaluates GPT-5.2, Gemini-3.0 Pro, and Gemini-3.0 Flash on BrowseComp-Plus, all with Intelligence Index = 75, beyond the fitted 42–71 range. Across 15 predictions, mean absolute error (MAE), the average absolute difference between predicted and observed success, is 0.077 overall, 0.061 for MAS, and 0.138 for SAS. The equation nevertheless predicts Hybrid as best for all three models while Centralized or Decentralized actually wins, and Hybrid’s mean relative prediction error is +37.0%; numerical calibration does not establish successful frontier-model architecture selection.
- C. Domain Complexity, C.1. Complexity Score Assignment, and C.2. Domain Characterisation define an ordinal D ∈ [0, 1] using sequential interdependence, state-space complexity, changes in the environment during execution, and observed coordination-overhead sensitivity. Scores are Workbench 0.000, Finance Agent 0.407, PlanCraft 0.419, BrowseComp-Plus 0.839, SWE-bench Verified 0.255, and Terminal-Bench 0.414. C.3. Critical Threshold proposes D ≈ 0.40, but financial gains above this value, software degradation below it, and calibration against MAS outcomes limit its value as an independent prospective selection rule.
- D. Datasets specifies benchmark tasks and scoring: financial expert rubrics, web-answer evaluation, expected workplace function-call sequences, successful Minecraft crafting within step limits, repository patches passing tests, and objective terminal task completion. E. Implementation Details and E.1. Technical Infrastructure describe LiteLLM (https://www.litellm.ai/) for provider interfaces, LangChain (https://www.langchain.com/) for orchestration, and tools including Tavily (https://tavily.com/) for web search and Python execution.
- E.2. Agent Configuration specifies a maximum of 10 iterations for SAS, 3 agents for Independent, 3 workers plus 1 orchestrator with at most 5 orchestration rounds for Centralized, and 3 agents with 3 debate rounds for Decentralized. E.3. Prompt Compilation System uses YAML, a structured text format, for templates and role-specific extensions; E.4. Evaluation Methodology reports shared interfaces, consistent context truncation, frozen weights, and benchmark subset sizes. The appendix’s architecture-specific iteration limits do not by themselves explain how the main body’s stated matching of maximum total iterations was enforced.
- E.5. Information Gain Computation estimates ΔI = 1/2 log(Var[Y|s_pre]/Var[Y|s_post]), where Y is binary task success and the states describe pre- and post-coordination reasoning. It samples K = 10 traces per state at temperature τ = 0.7, a sampling setting controlling output variation, and uses Var[Y|s] = p̂(s)(1 − p̂(s)). F. SWE-bench Verified and Terminal-Bench Results supplies heterogeneous-team comparisons, alternative capability fits, statistical corrections, and 95% bootstrap intervals; Table 16 additionally lists gemini-3-flash despite the main setup describing eight models for each of these benchmarks.
Brief Thoughts
The opposite effects on Finance Agent and PlanCraft make a useful case for testing task decomposition and verification before increasing team size. The predictive model needs more caution: its R² improvement over a simple baseline is small, several interactions weaken under clustering, and frontier-model architecture selection fails in the appendix. I would use these patterns to design local comparisons and validate the approximate 45% threshold and architecture rankings on the intended workload.